-

Figure 1.
Weight loss in polymer pouches during the storage at 37.8 ± 0.2 °C for 7 months.
-

Figure 2.
Color change in the purple mashed potatoes samples with light exposure and storage at 37.8 ± 0.2 °C for 7 months packaged in the AL-Foil, PAA and TLMO pouches.
-
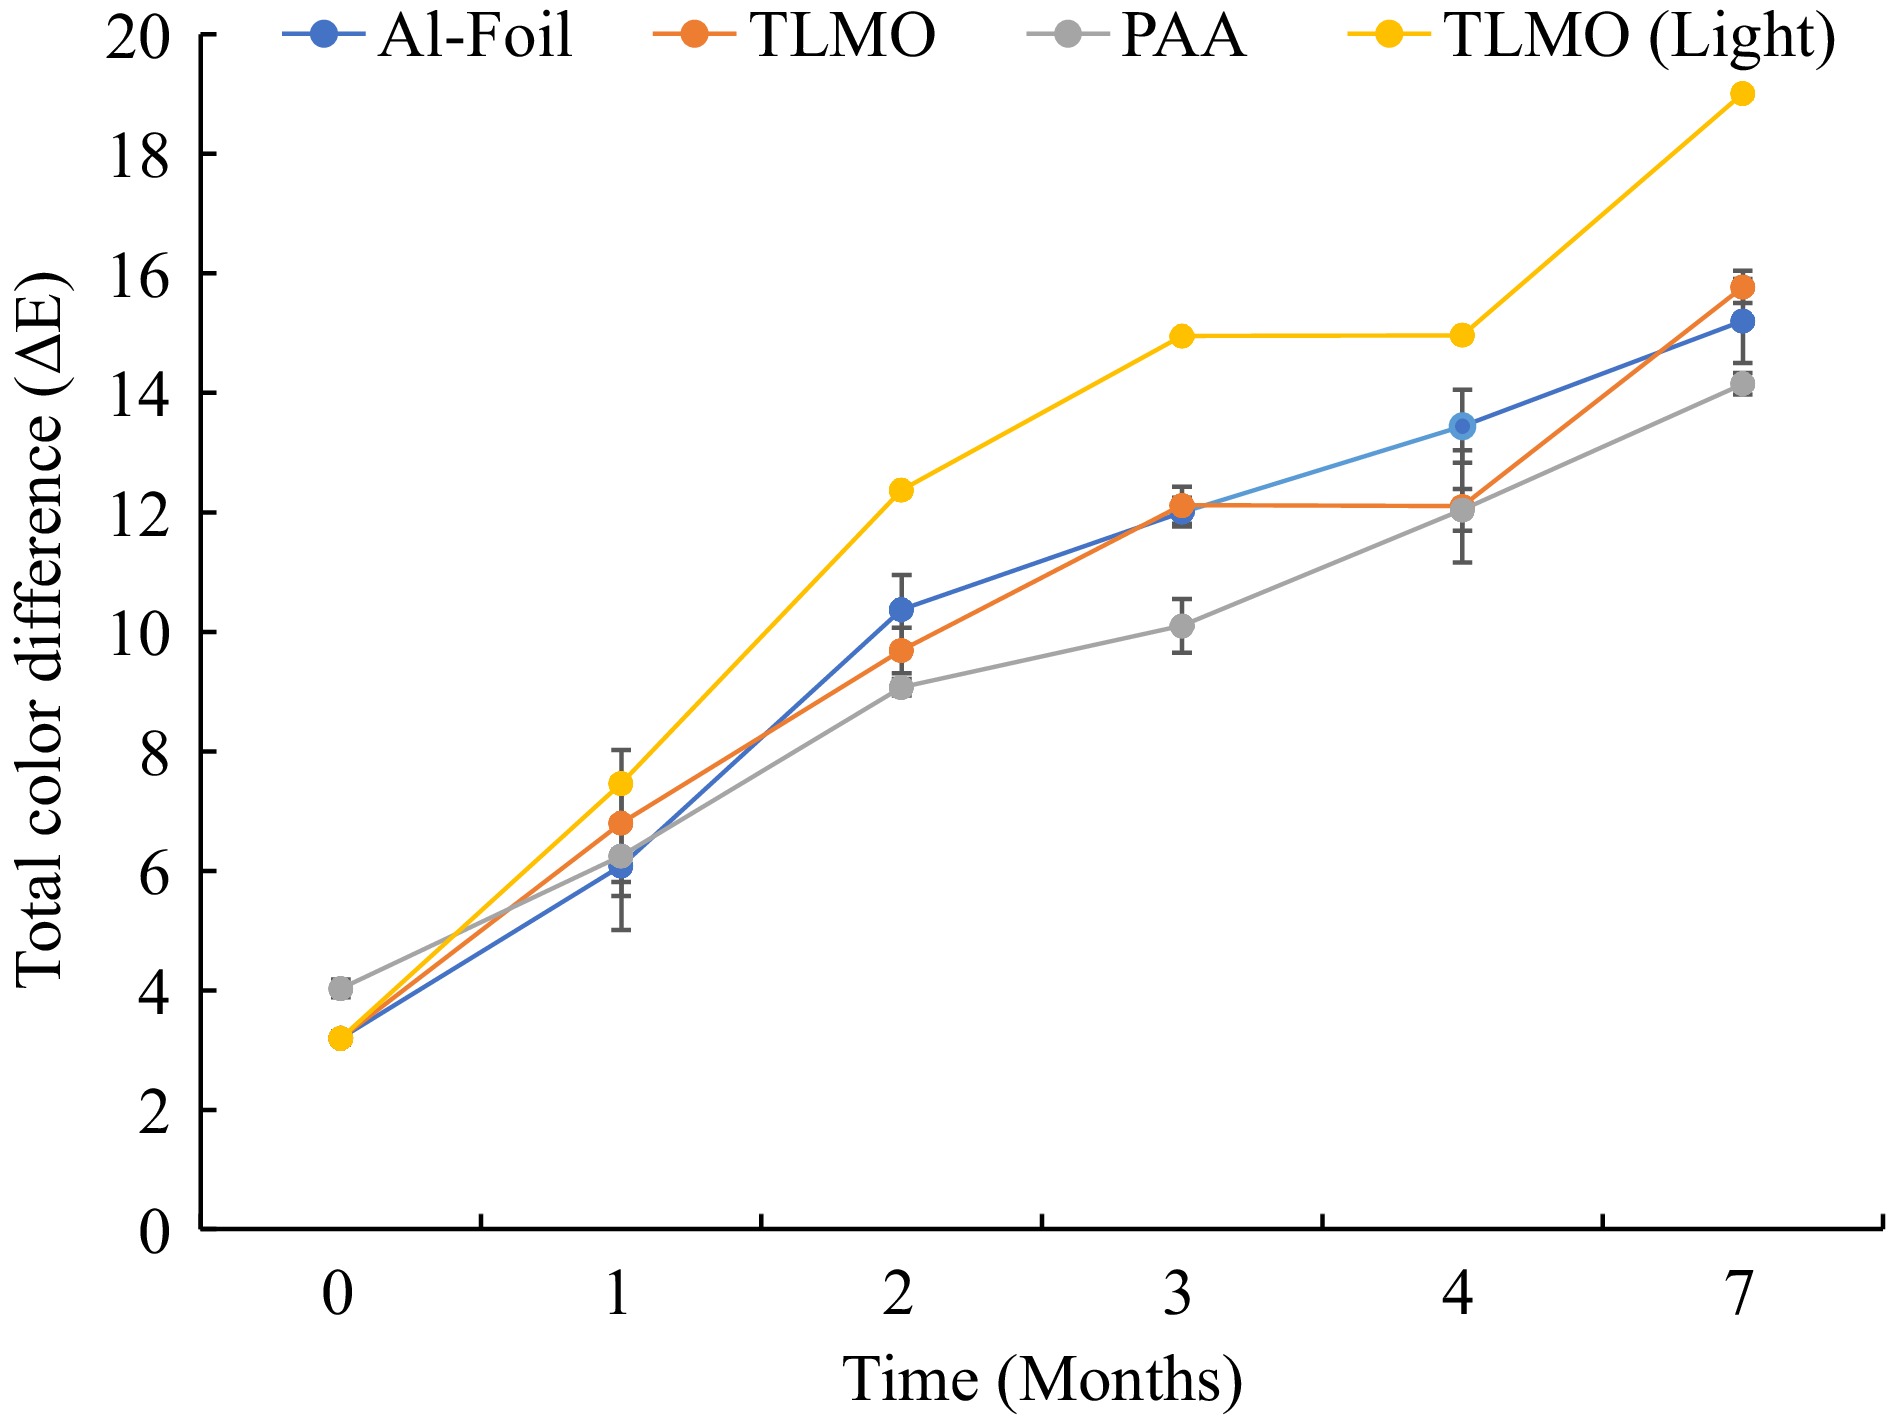
Figure 3.
Changes in the total color difference (ΔE) in the packaged purple mash potatoes with and without light exposure during storage for 7 months at 37.8 ± 0.2 °C
-
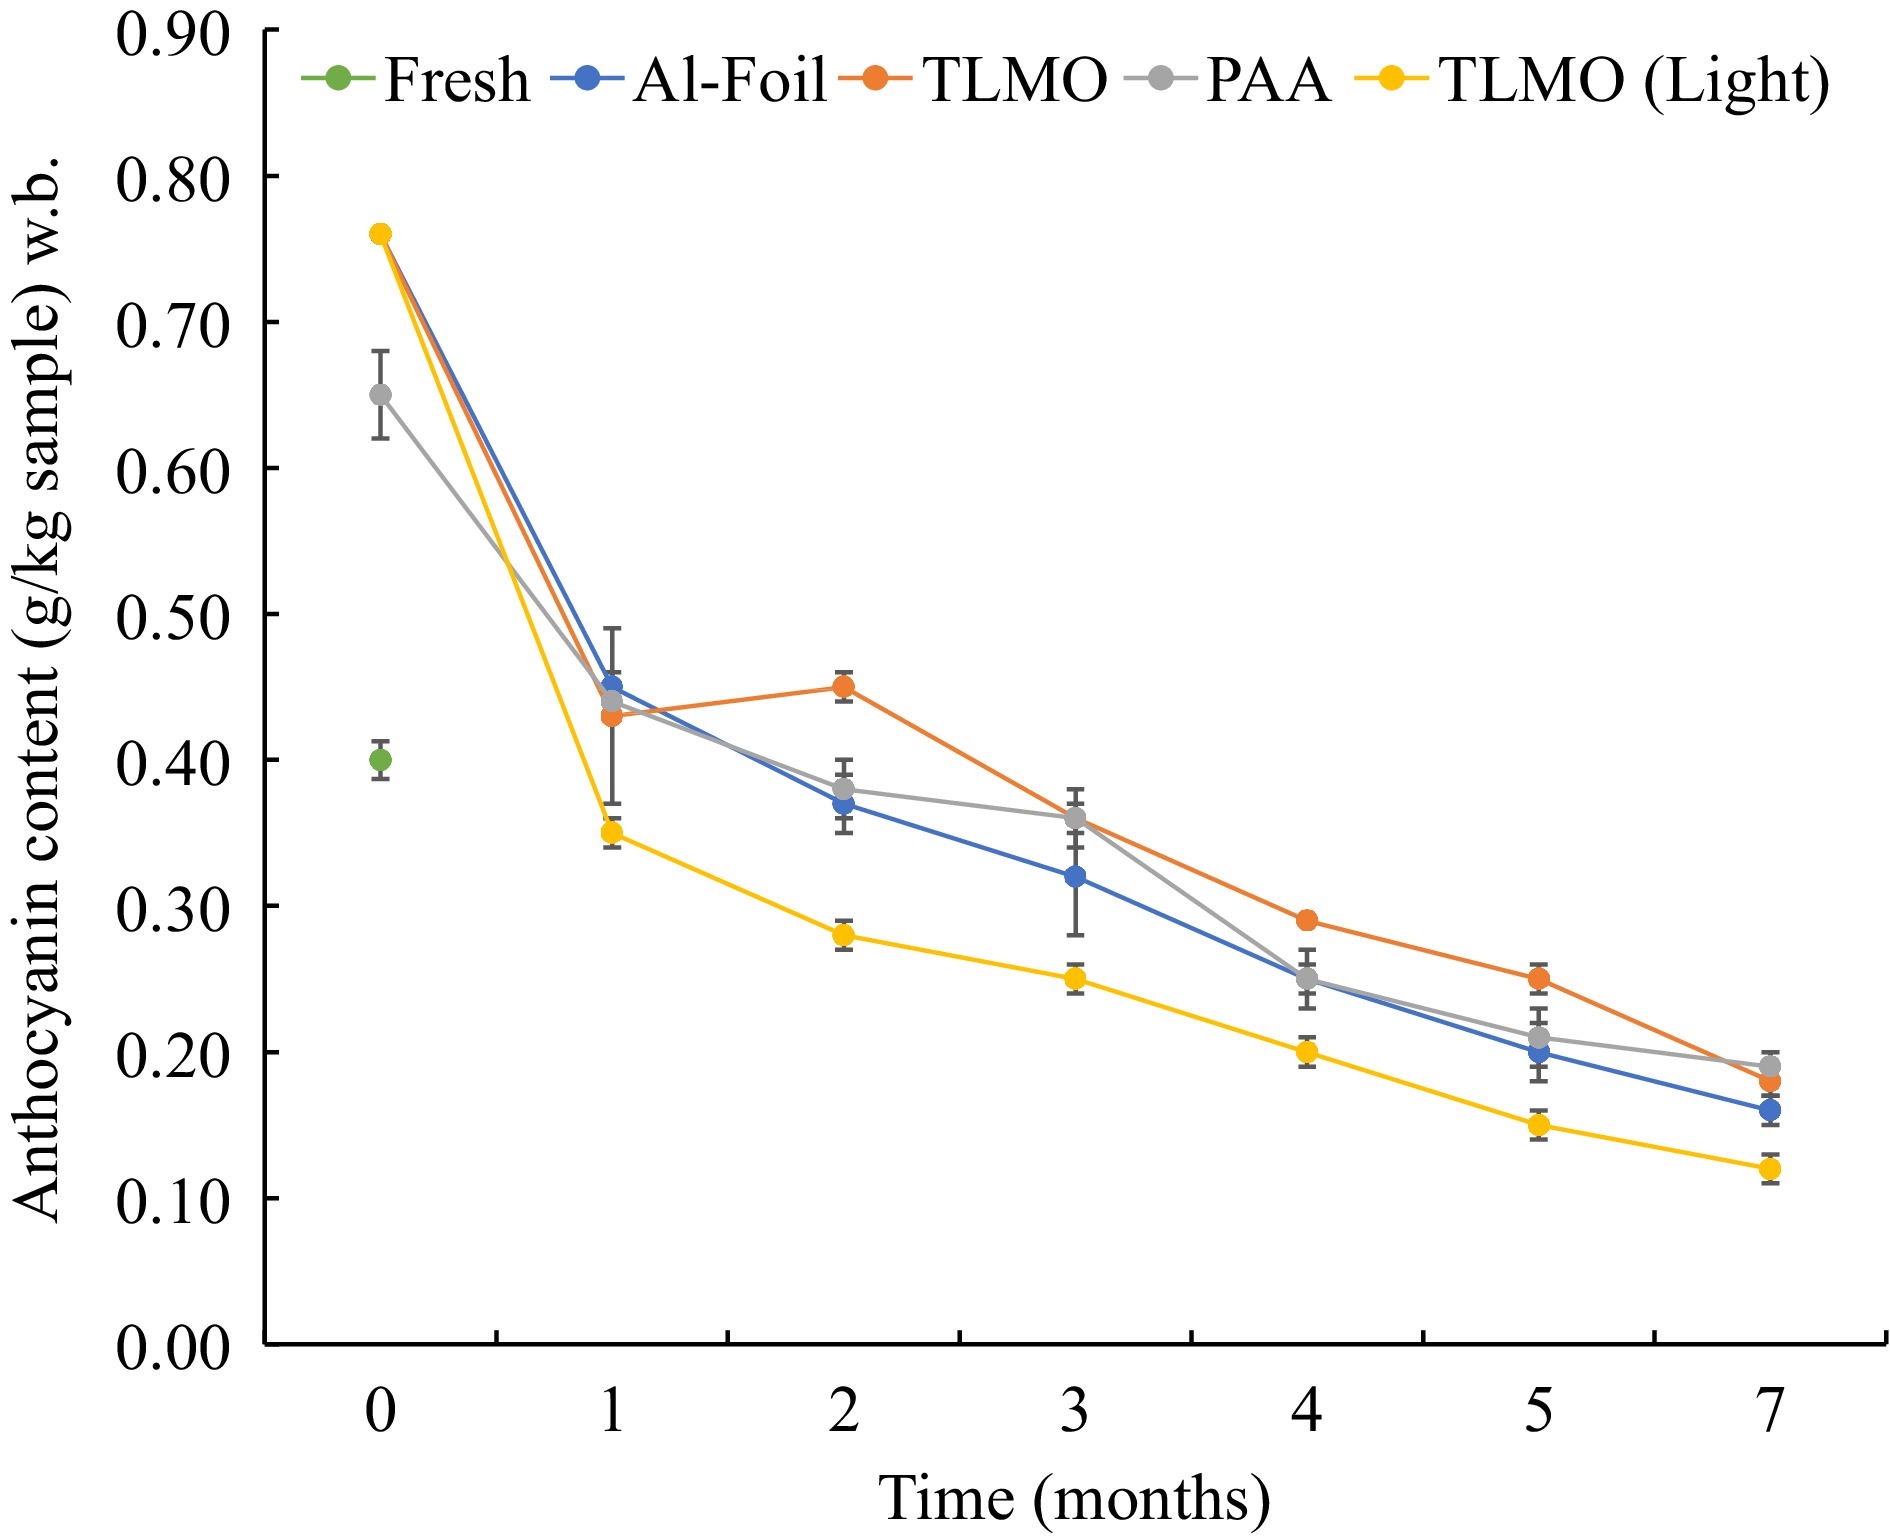
Figure 4.
Anthocyanin content in purple mash potato in all the pouches during storage at 37.8 ± 0.2 °C for 7 months.
-

Figure 5.
Total phenolic content in purple mash potato in all the pouches during storage at 37.8 ± 0.2 ºC for 7 months. The mean values were compared for significant differences for determining the pouch effect (Superscripts: A−D), storage effects (I−II) and processing effects (a−b), respectively.
-
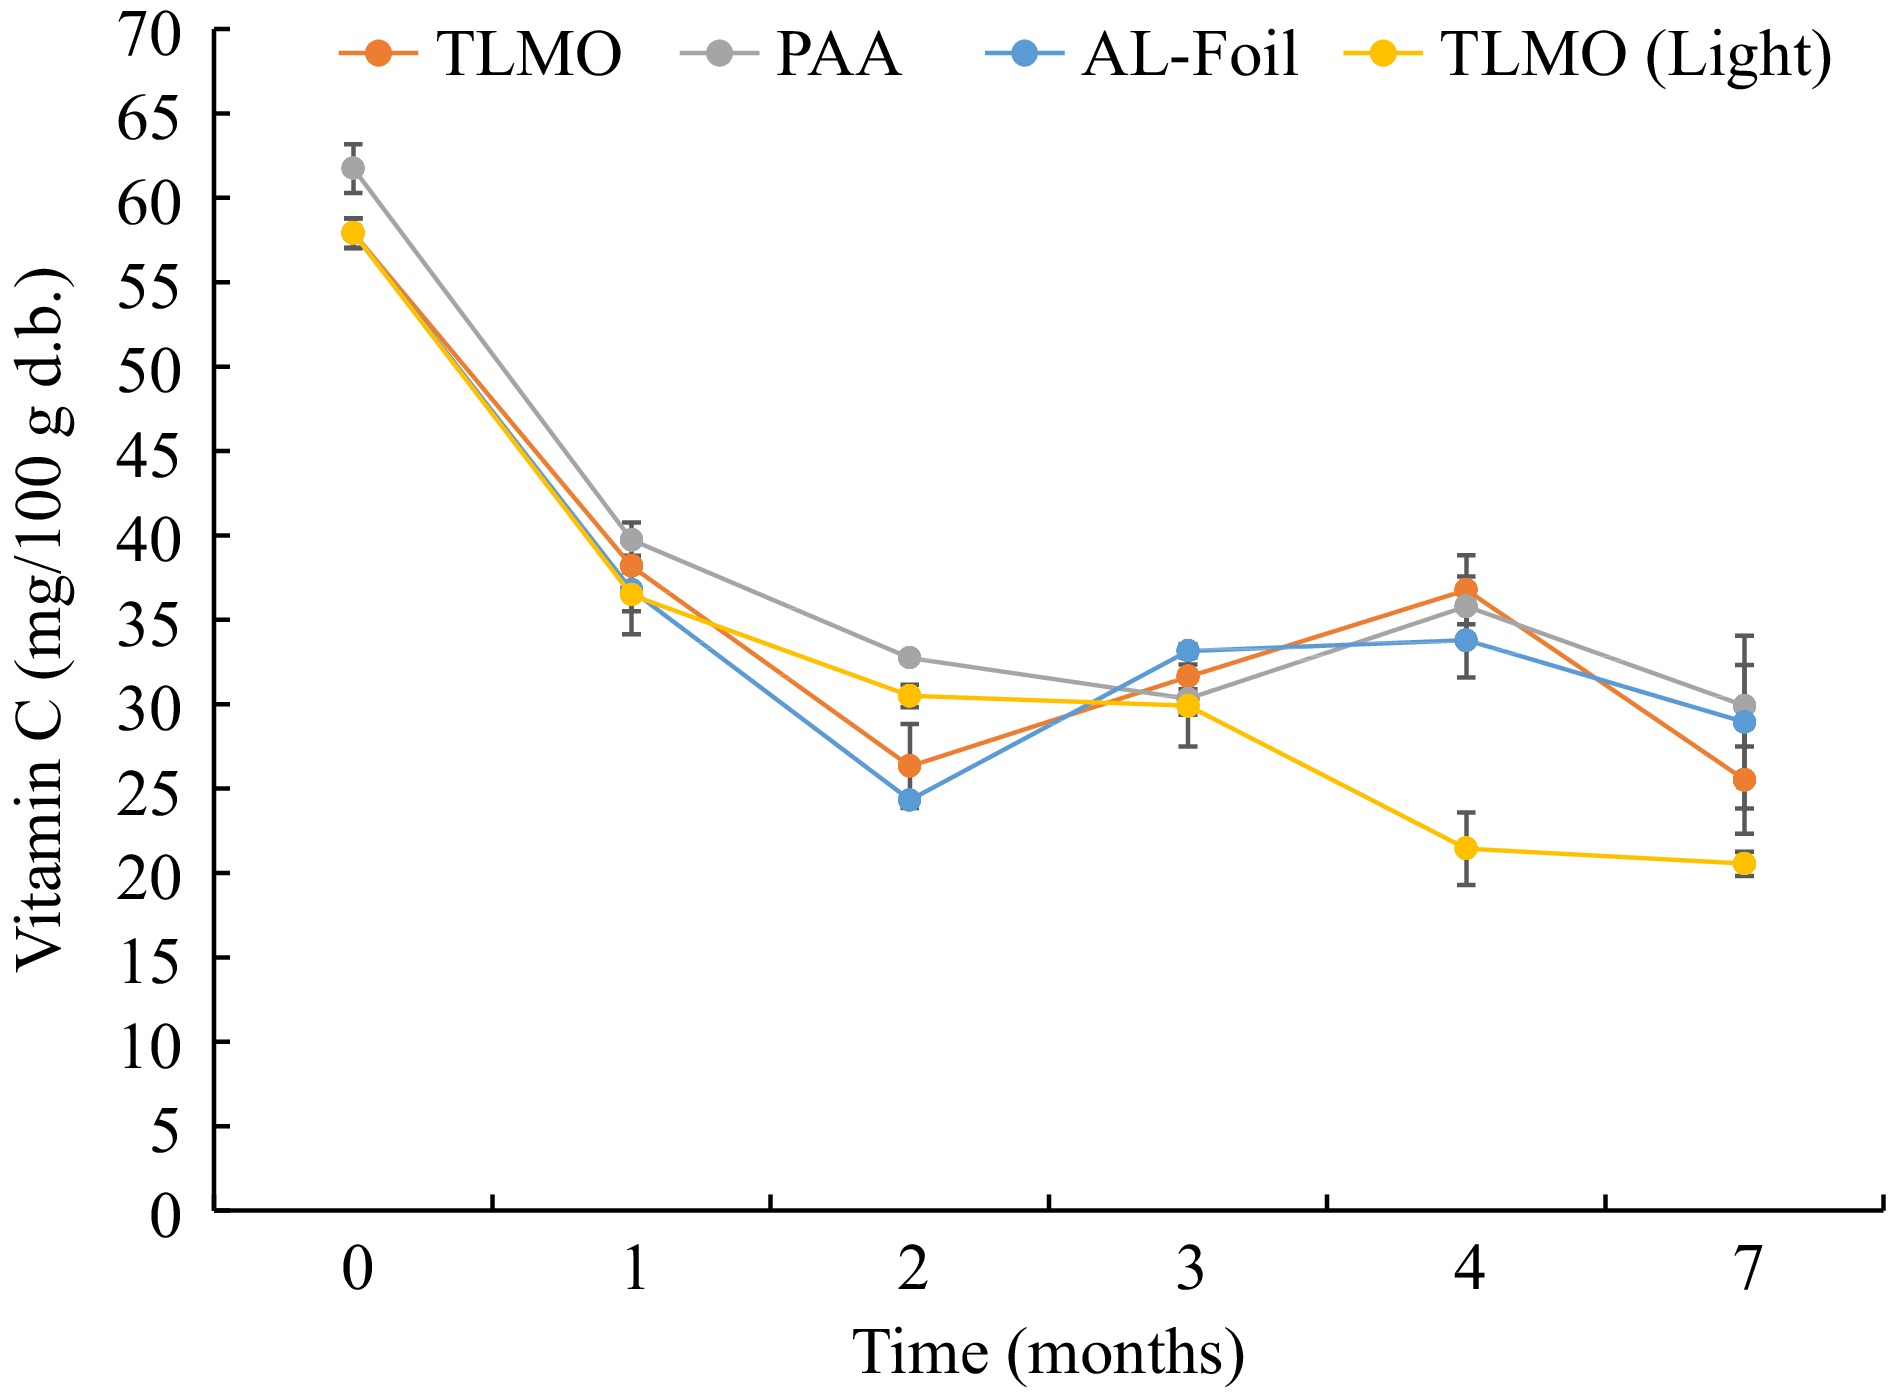
Figure 6.
Non-encapsulated Vitamin C content in purple mash potatoes in all the pouches including light exposure pouch during storage at 37.8 ± 0.2 ºC for 7 months.
-

Figure 7.
Non-encapsulated Vitamin C (NVC) and encapsulated Vitamin C (EVC) content in purple mash potatoes in TLMO & PAA pouches during storage at 37.8 ± 0.2 ºC for 7 months. The mean values were compared for significant differences for determining the effect of packaging used (lowercase superscripts), storage (uppercase superscripts) and MATS processing (roman superscripts), respectively.
-
Package Structure Dimensions (L × W)(cm) Total thickness (µm, n = 5) TLMO AlOx-coated PET (12 µm)//AlOx-coated PET (12 µm)//
AlOx-coated PET (12 µm)//
ONy (15 µm)//CPP (70 µm)18.5 × 14 121 ± 0.8 PAA PET (12 µm)//organic coating (1 µm) // ONy (15 µm)//CPP (60 µm) 18 × 13 95 ± 0.4 AL-Foil PET (12 µm)//aluminum (9 µm)//nylon (15 µm)//PP (80 µm) 21 × 12 120 ± 0.1 ONy and CPP indicate biaxially oriented nylon 6 and cast polypropylene, respectively. Table 1.
Details regarding the package label, structure, dimensions (length × width), and thickness of multilayer pouches studied.
-
Pouch type OTR
(cc/m2·day)WVTR
(g/m2.day)Before processing After processing After storage
at 38ºC/ 7 monthsBefore processing After processing After storage for
38 ºC/ 7 monthsTLMO ND ND 0.34 ± 0.00AB 0.13 ± 0.01aA 0.32 ± 0.08cB 0.23 ± 0.03bB PAA 0.21 ± 0.01ab 0.19 ± 0.03a 0.29 ± 0.12bA 5.92 ± 0.08aB 12.5 ± 0.89bA 12.6 ± 0.29bA Values are presented as Mean ± SD. Different lowercase and uppercase superscripts show significant differences (P < 0.05) between values within rows and columns, respectively. ND: Not detectable since the value is lower than the instrument’s detection limit. ONy and CPP indicate biaxially oriented nylon 6 and cast polypropylene, respectively. Table 2.
Oxygen Transmission Rate (OTR) and Water Vapor Transmission Rate (WVTR) of polymer pouches before and after MATS processing and after storage at 37.8 ± 0.2 ºC.
Figures
(7)
Tables
(2)