-
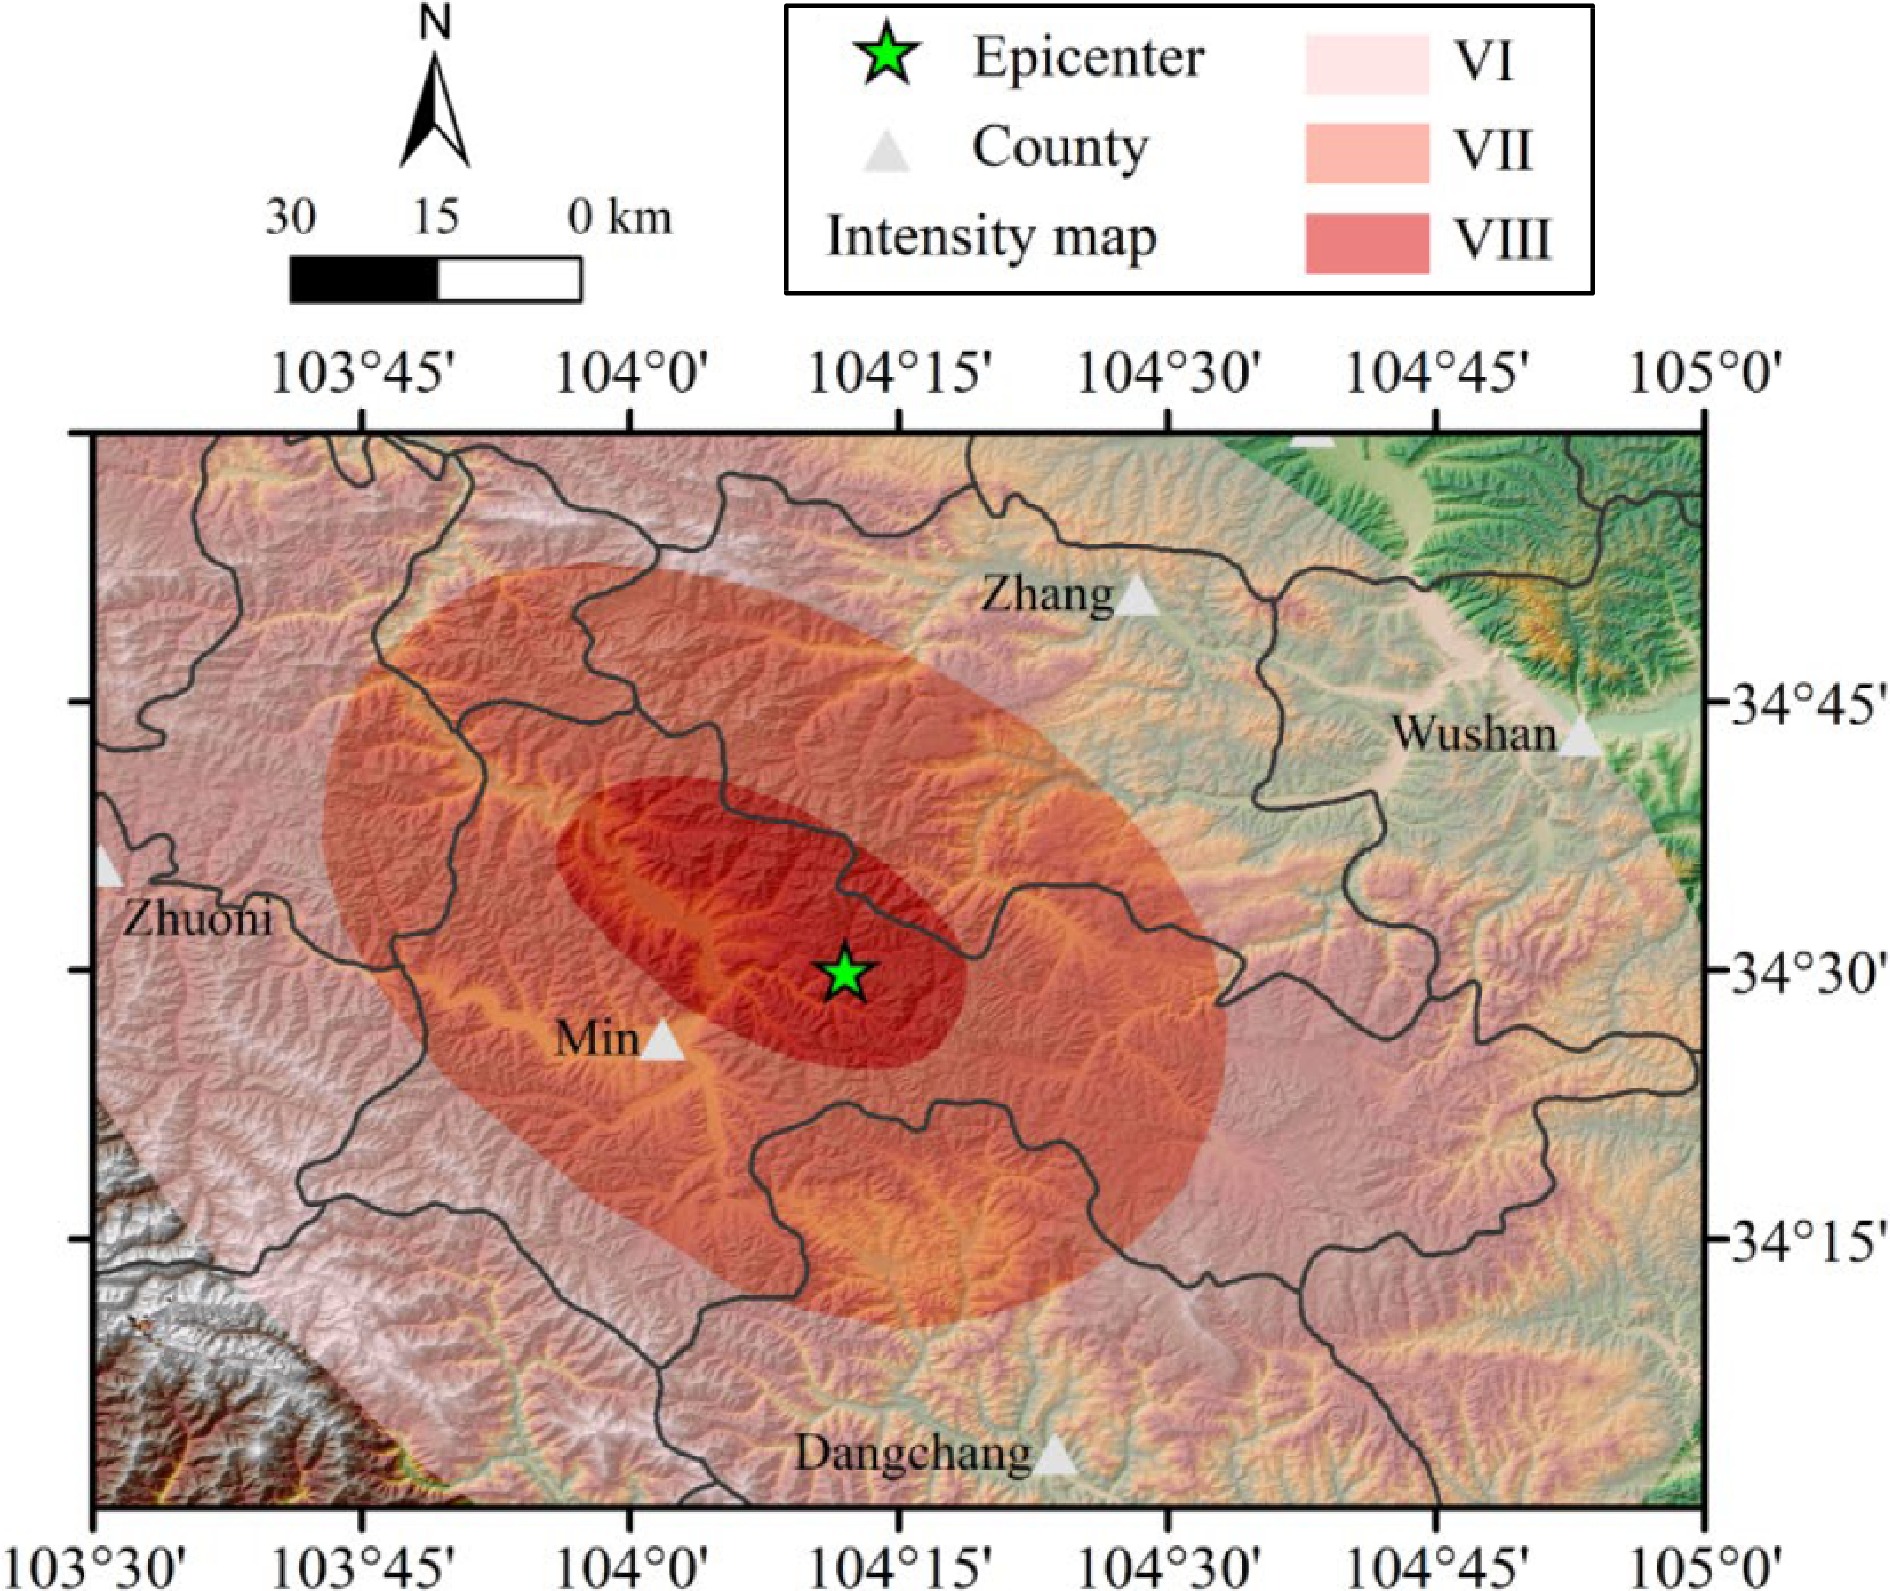
Figure 1.
Location of the 2013 Ms6.6 Min-Zhang earthquake.
-
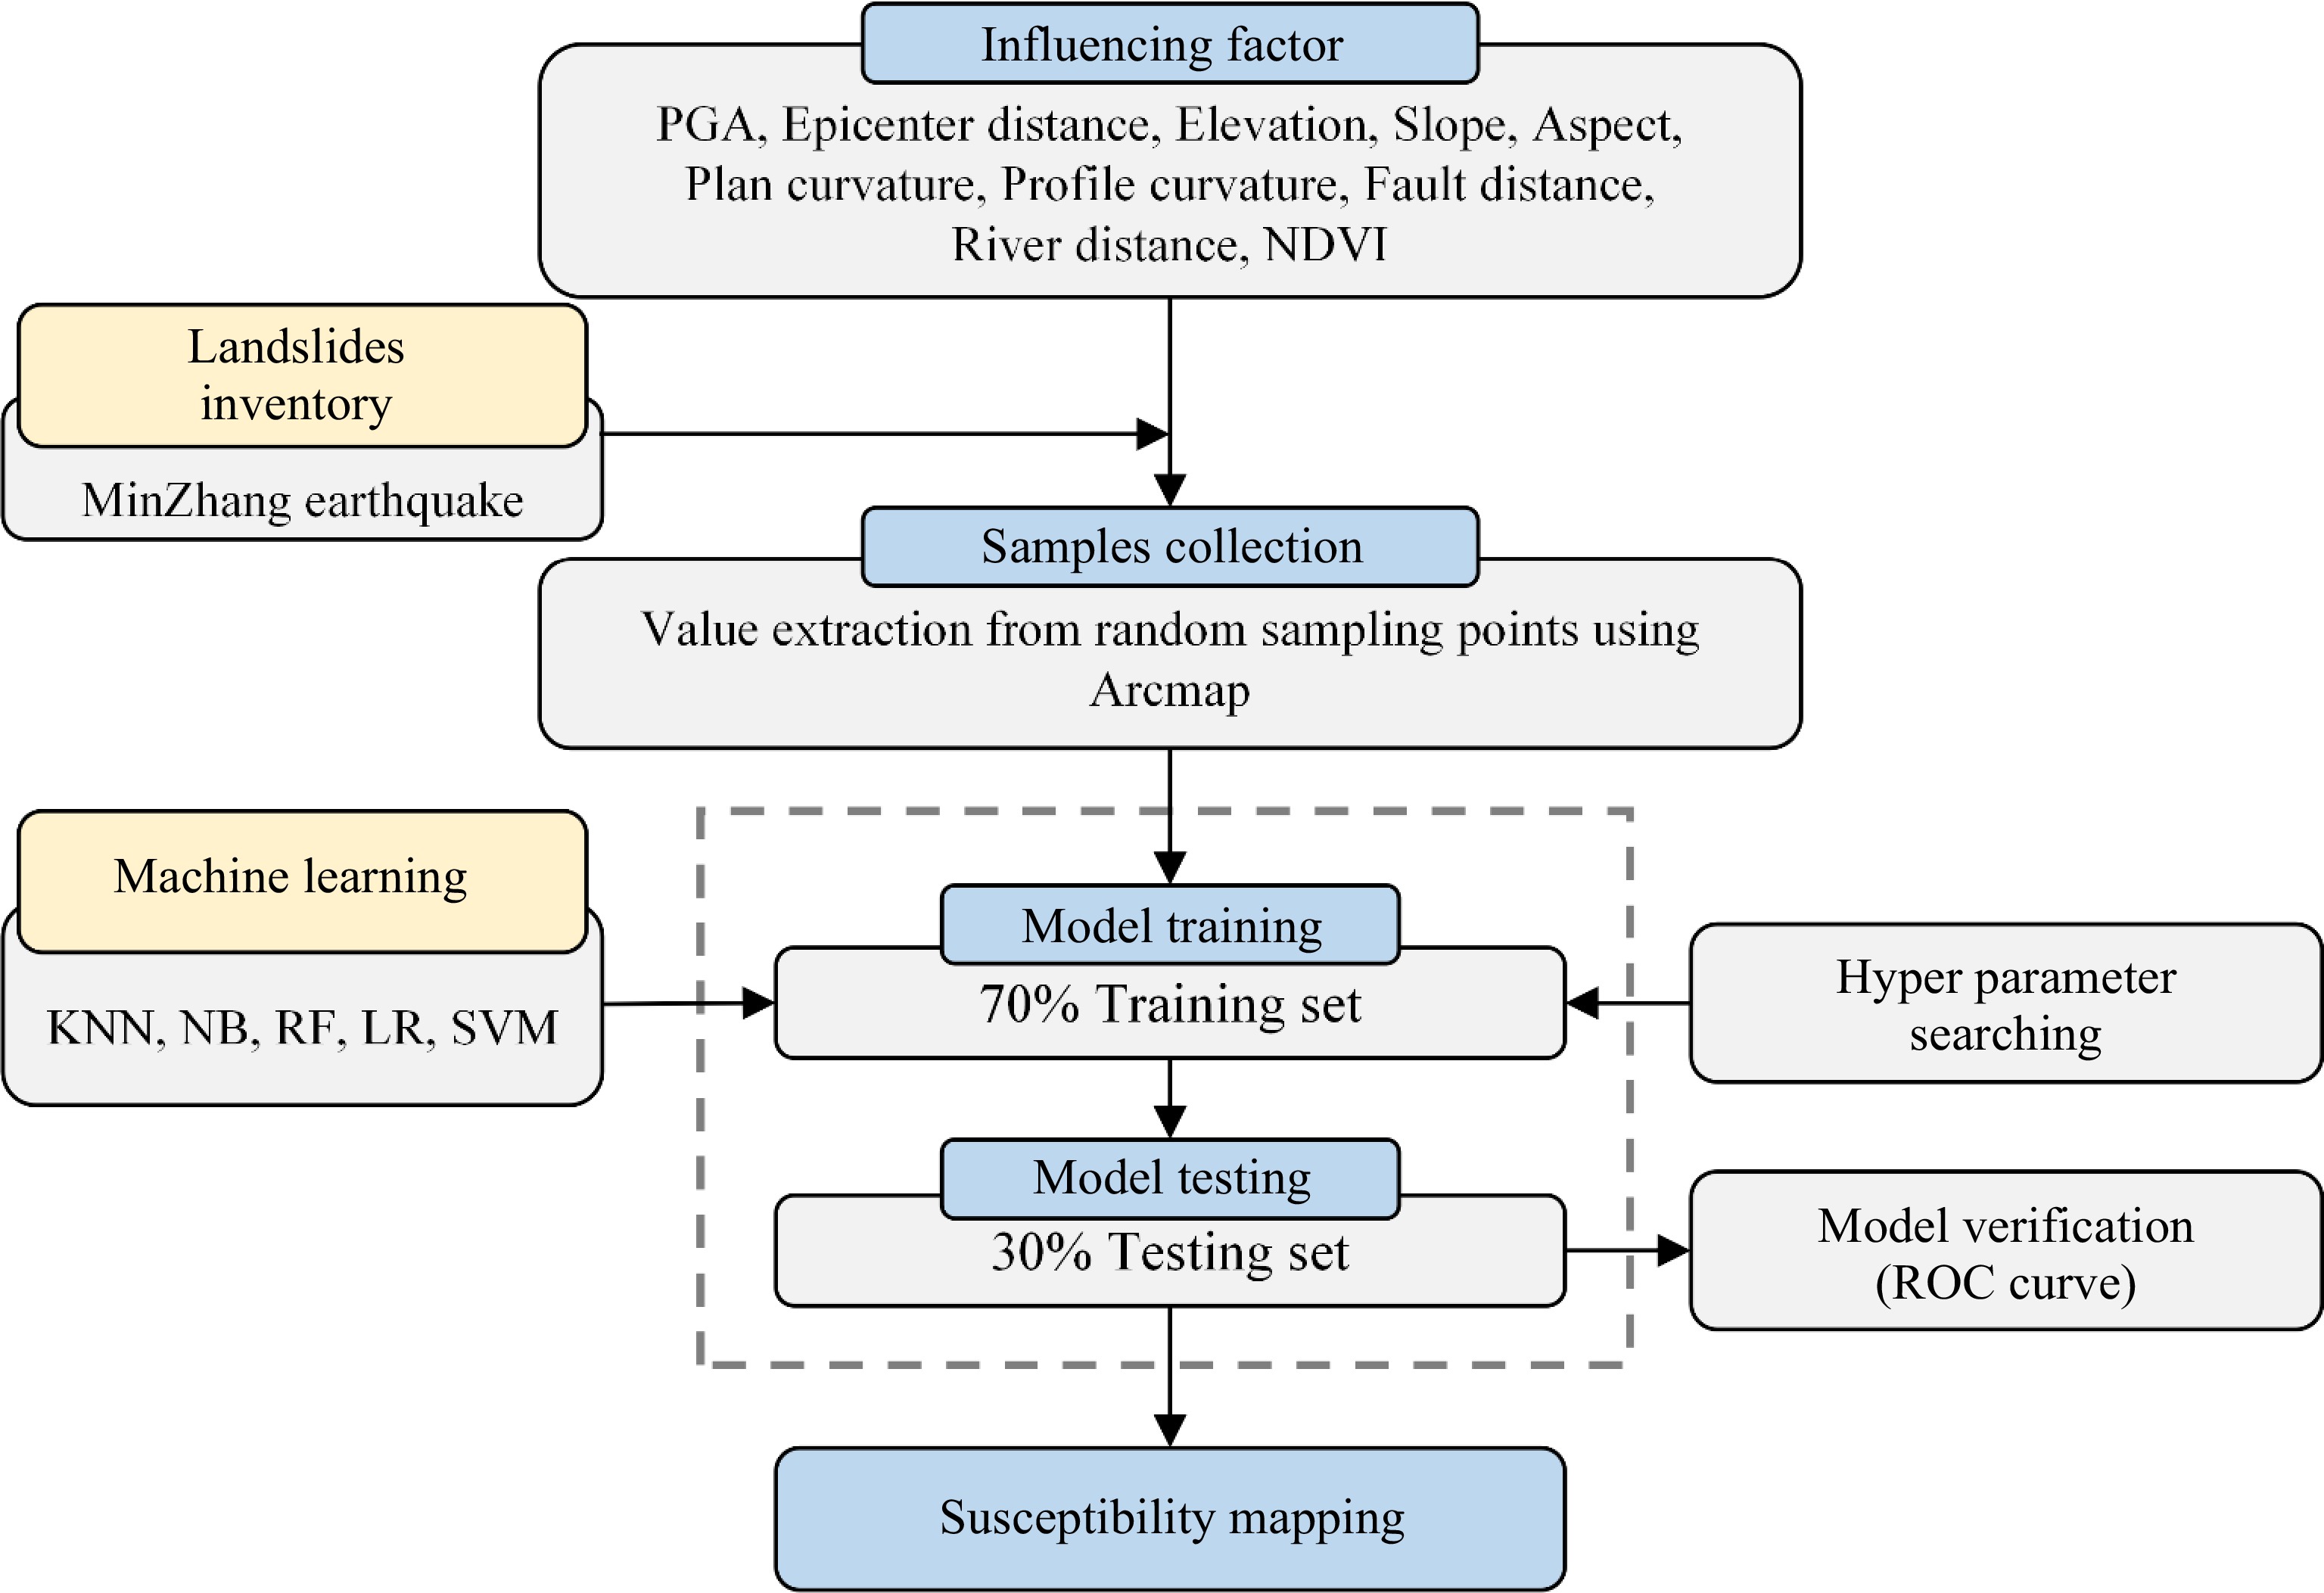
Figure 2.
Model framework for seismic landslide prediction.
-
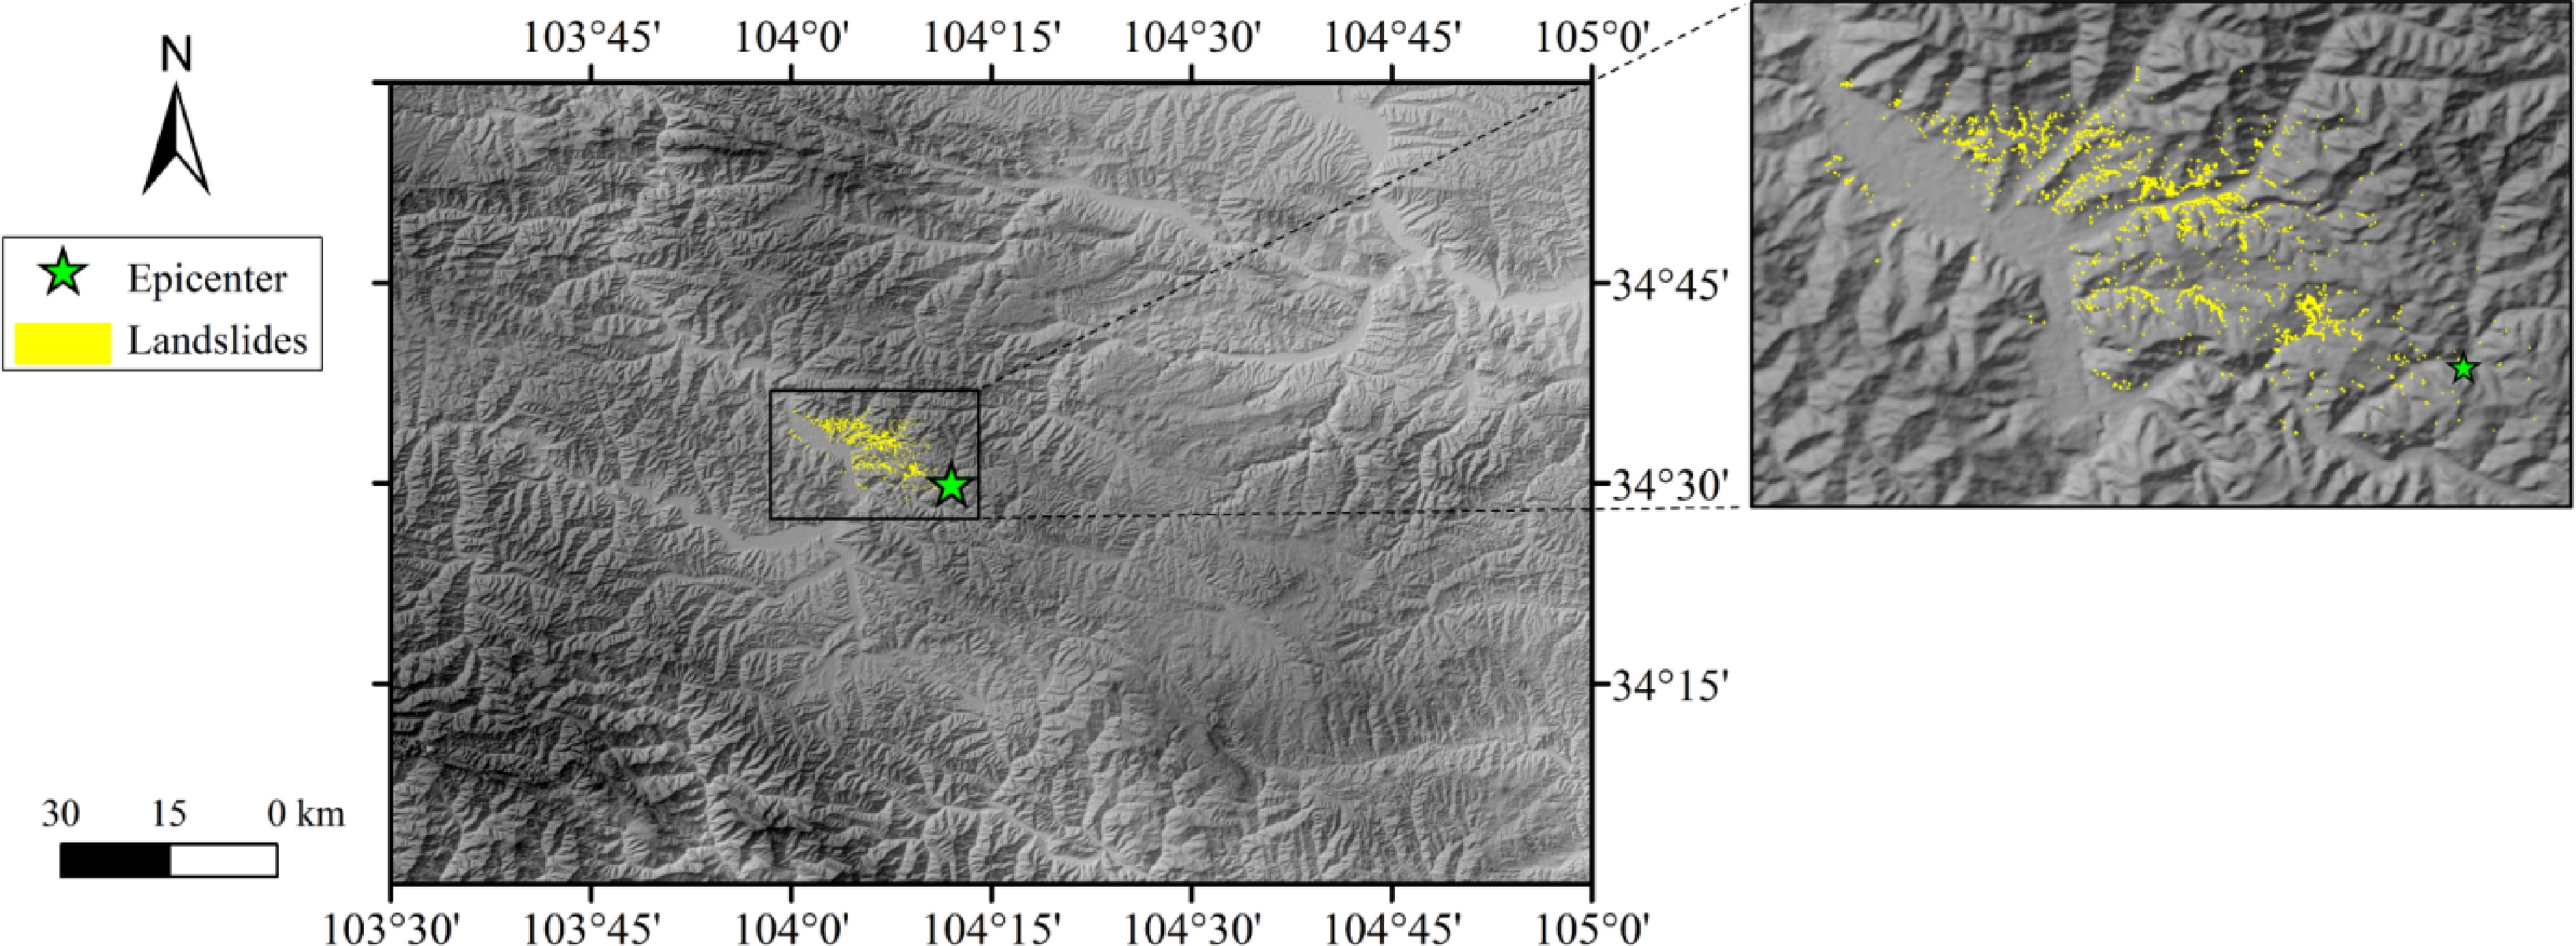
Figure 3.
Seismic landslide inventory map.
-
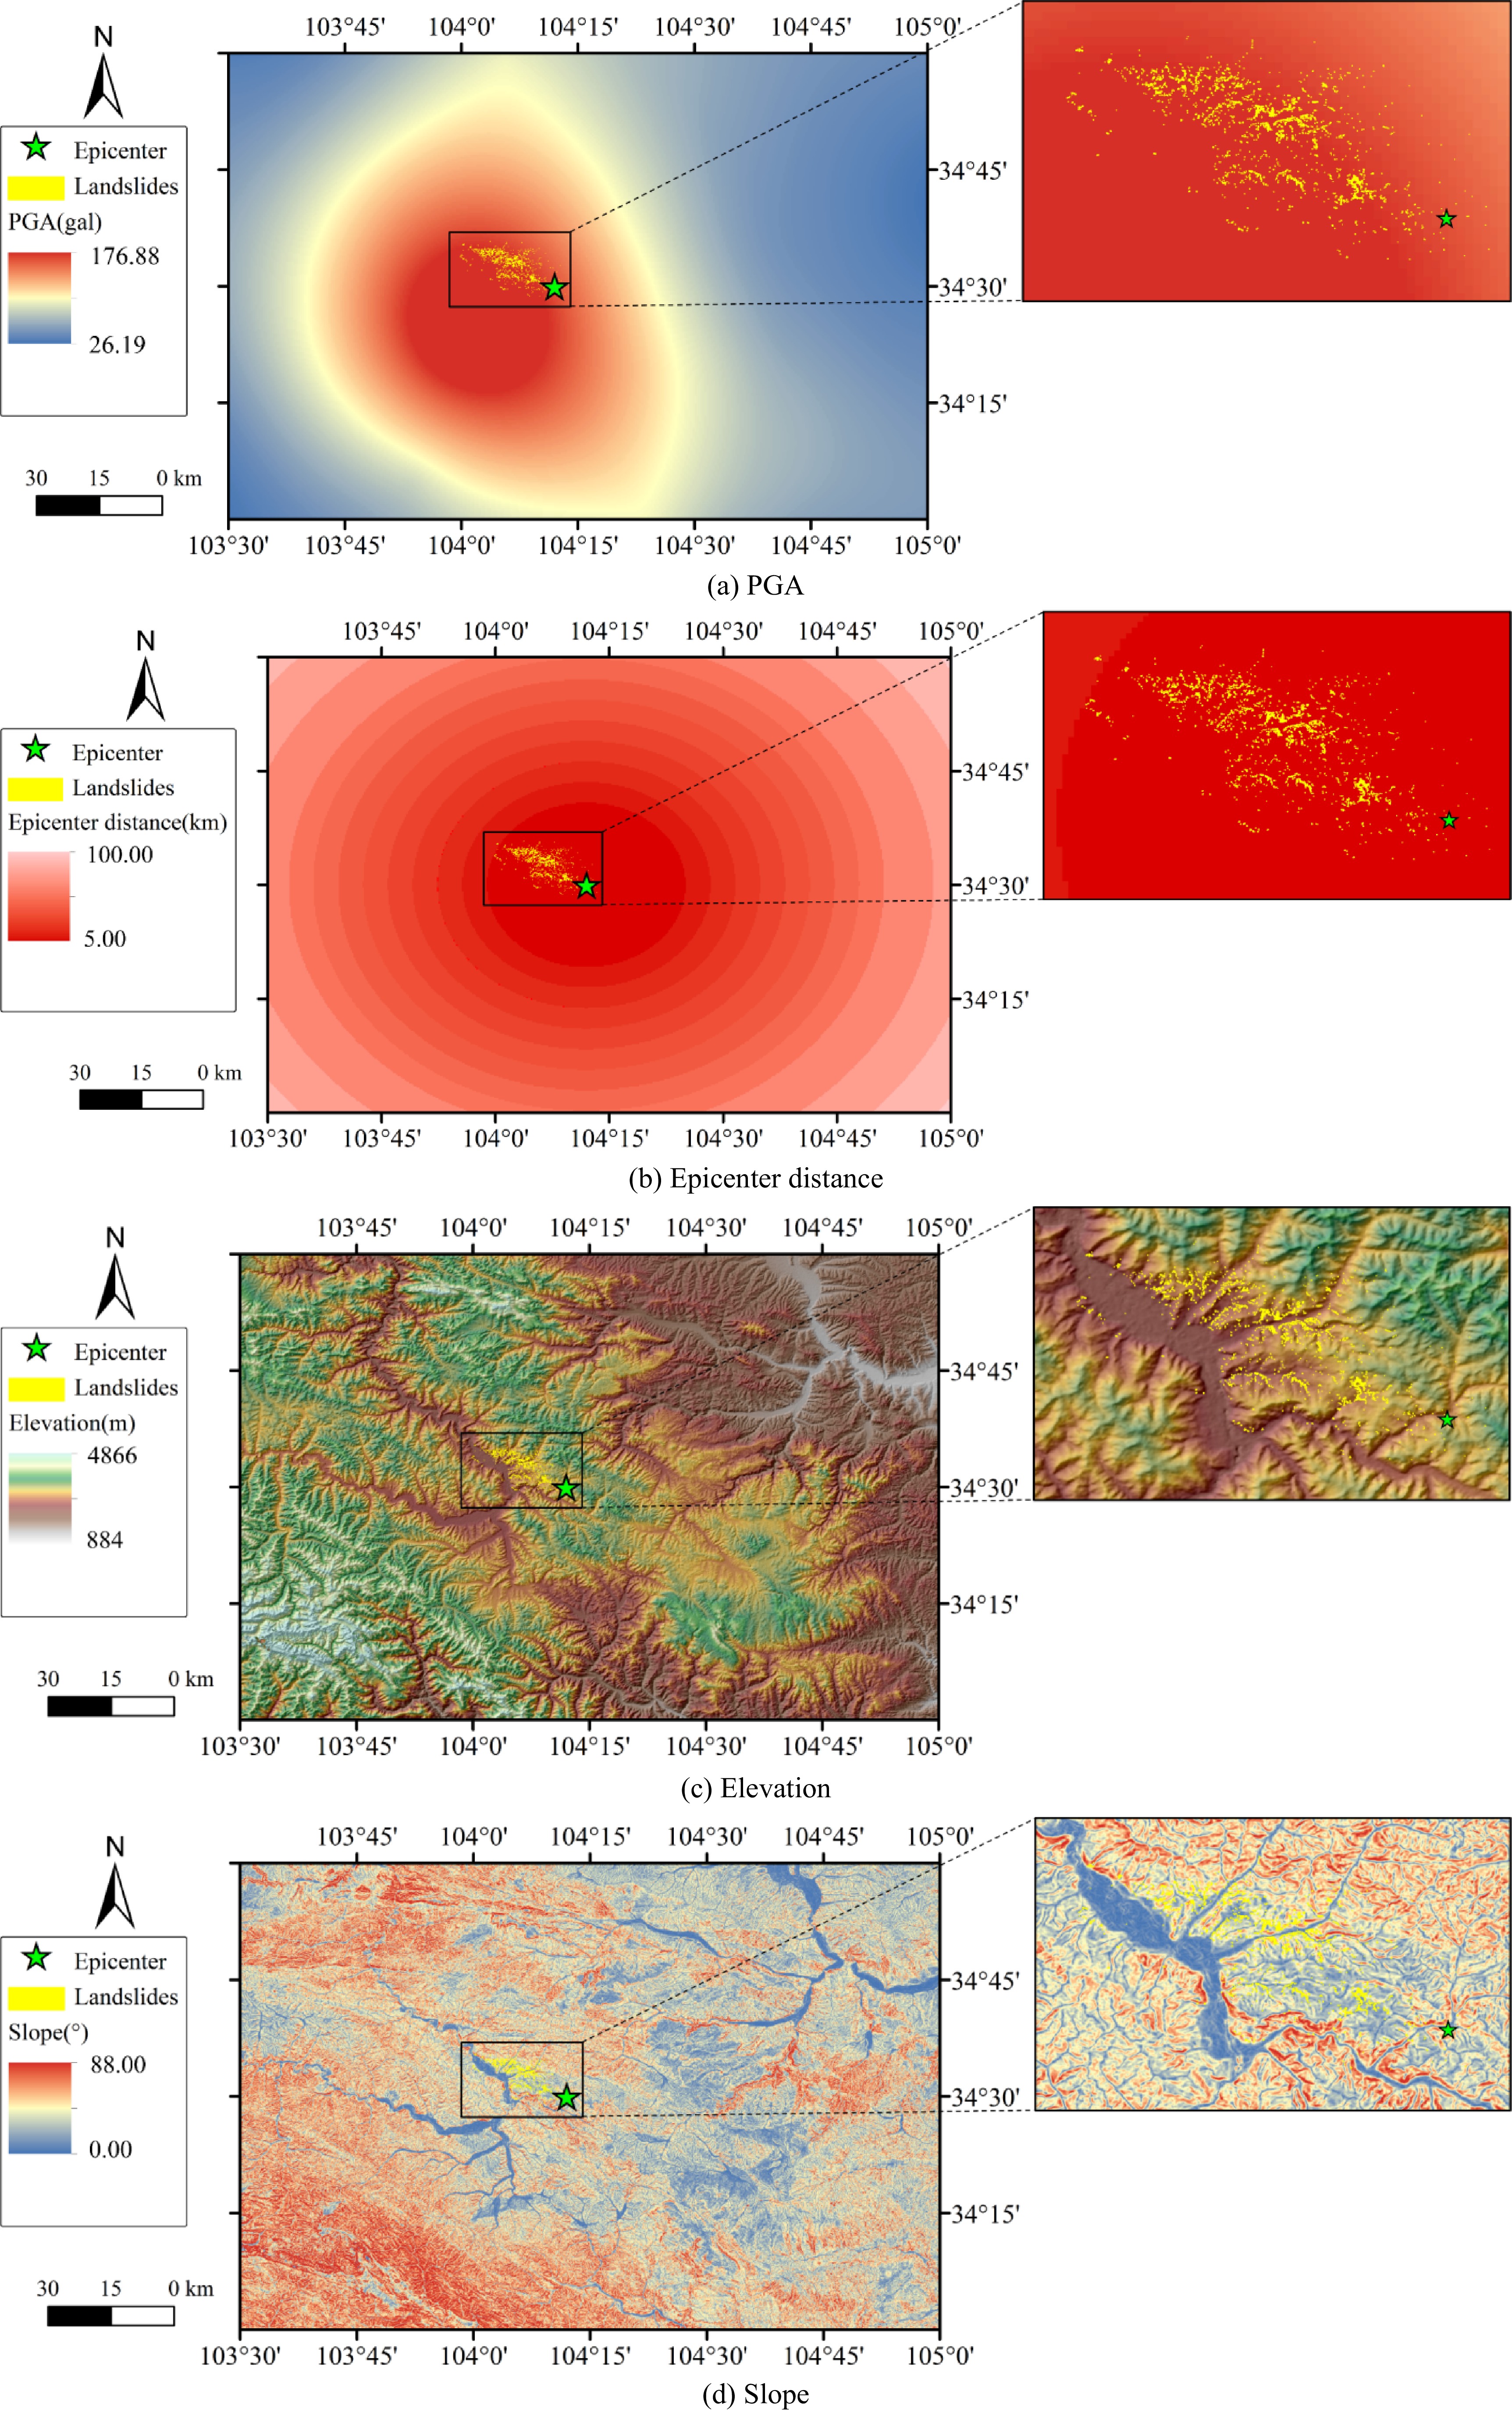
Figure 4.
Influencing factors used in landslide susceptibility mapping. (to be continued)
-
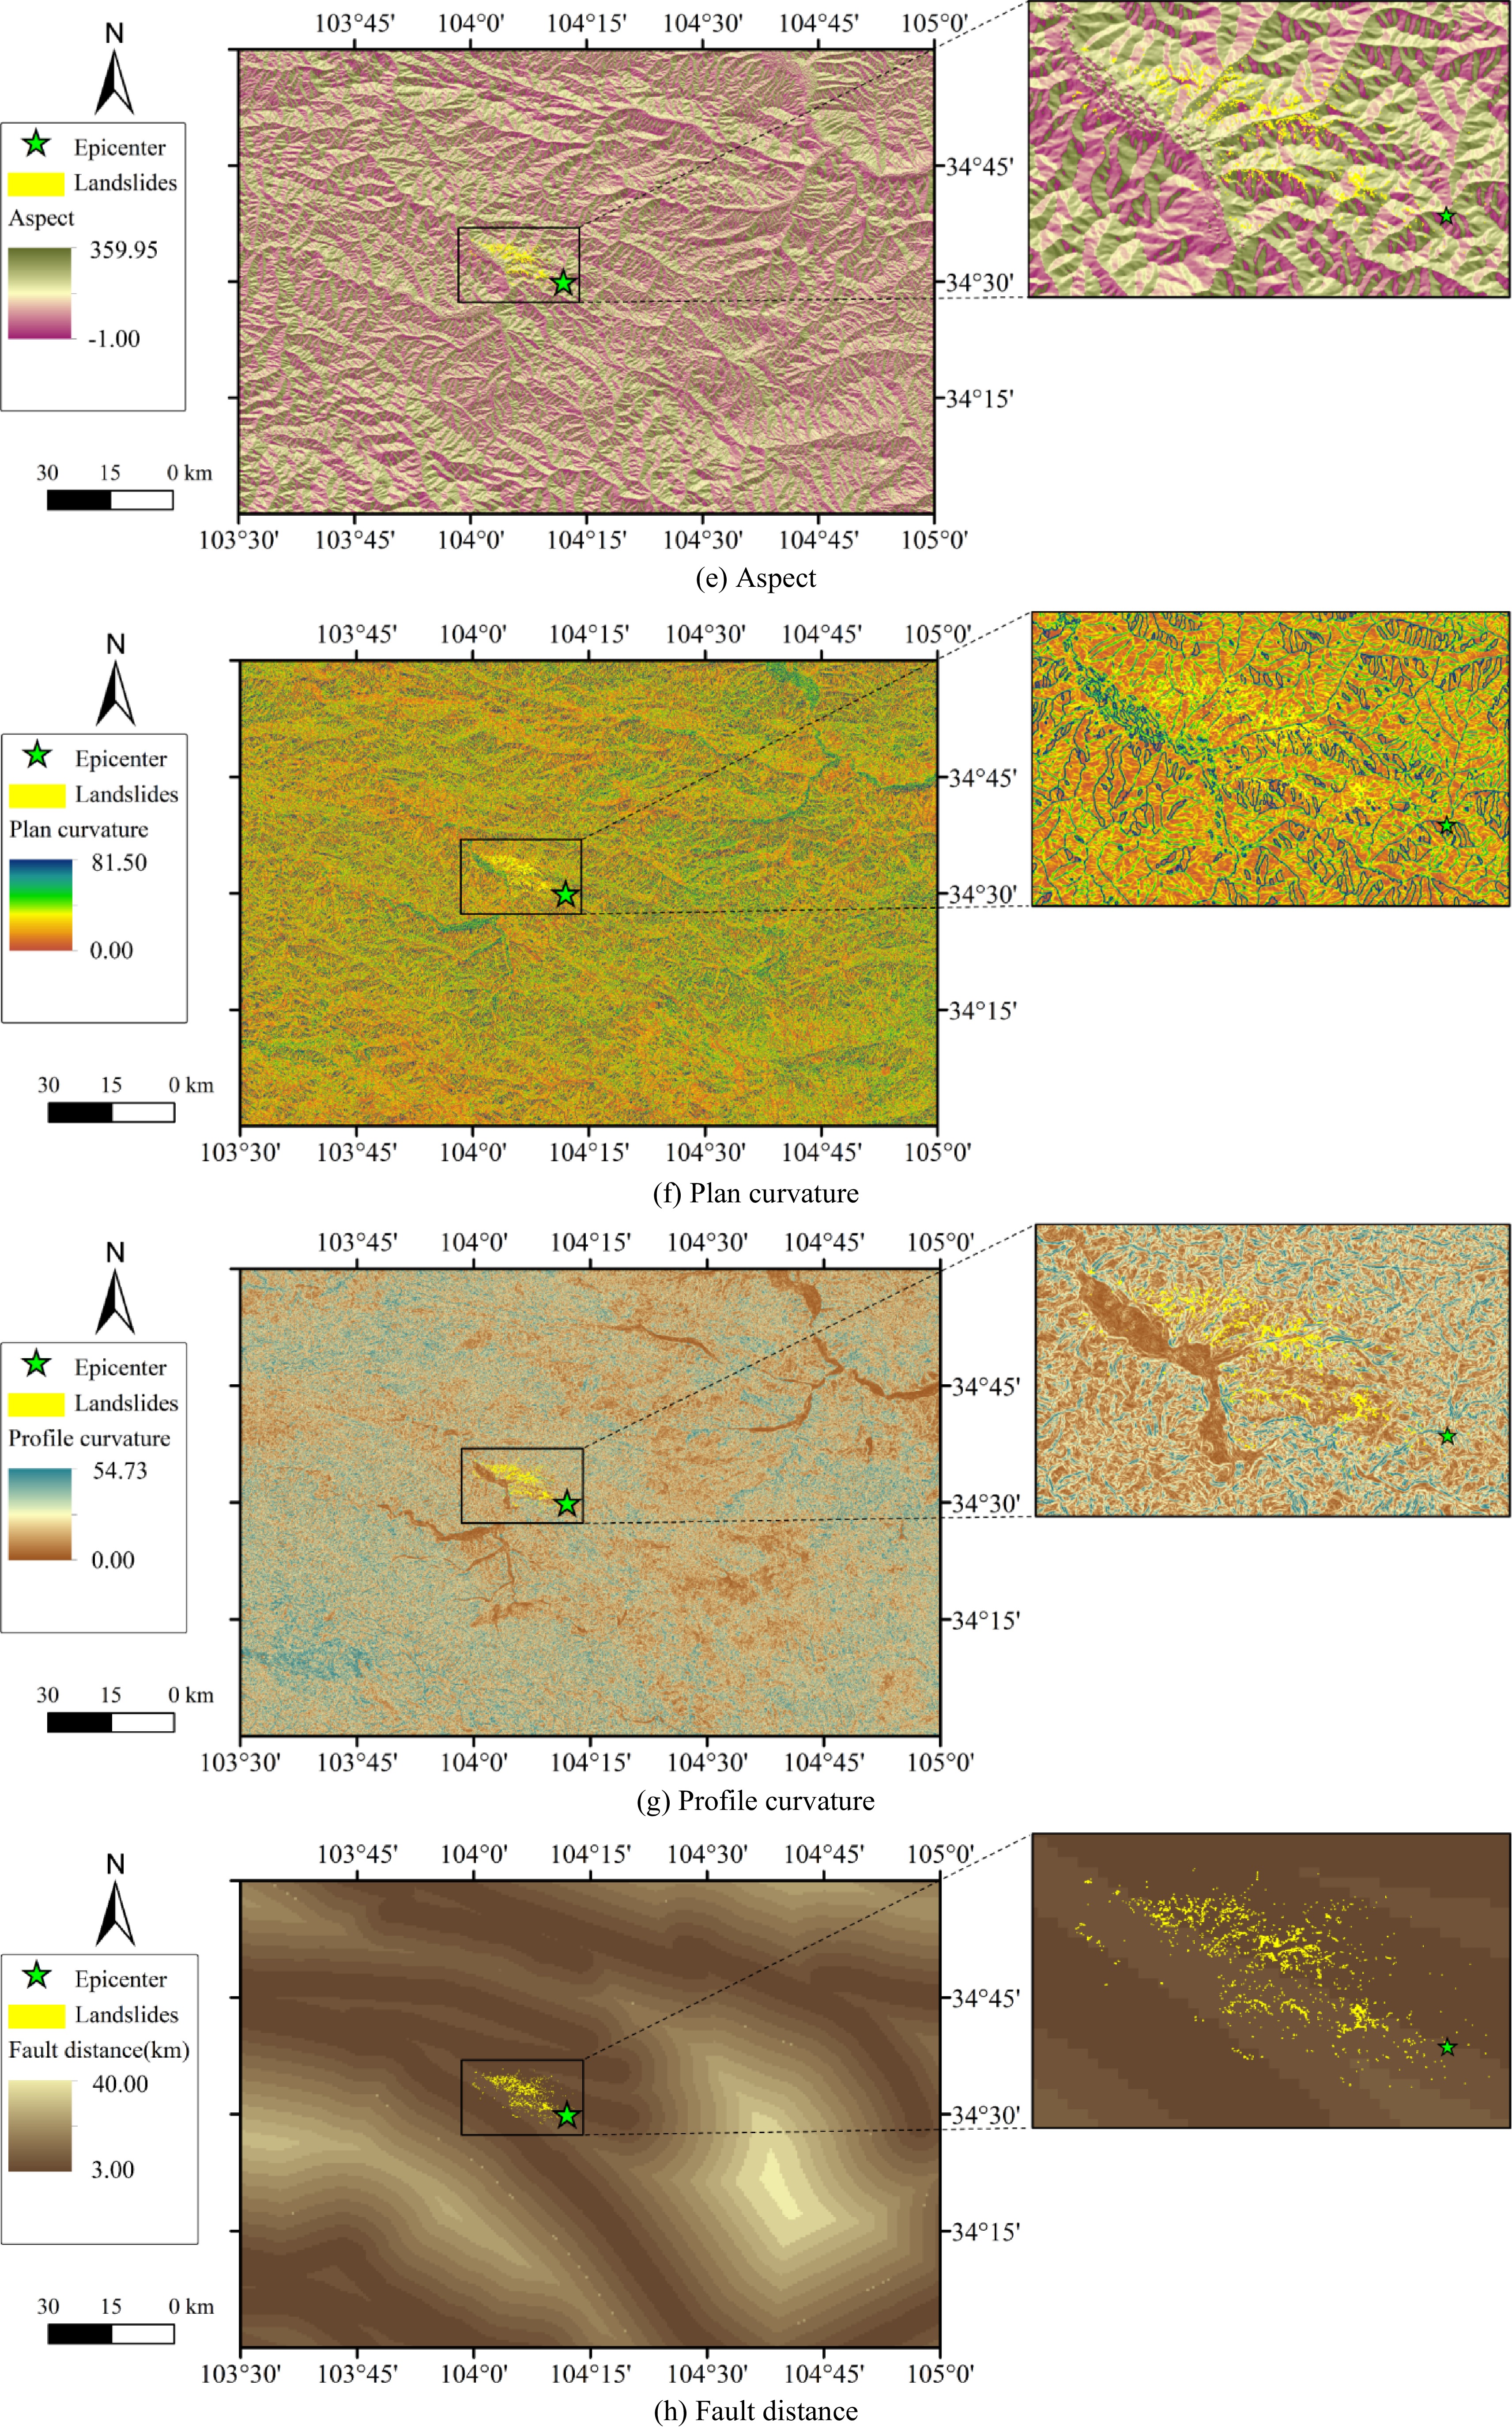
Figure 4.
(continued).
-
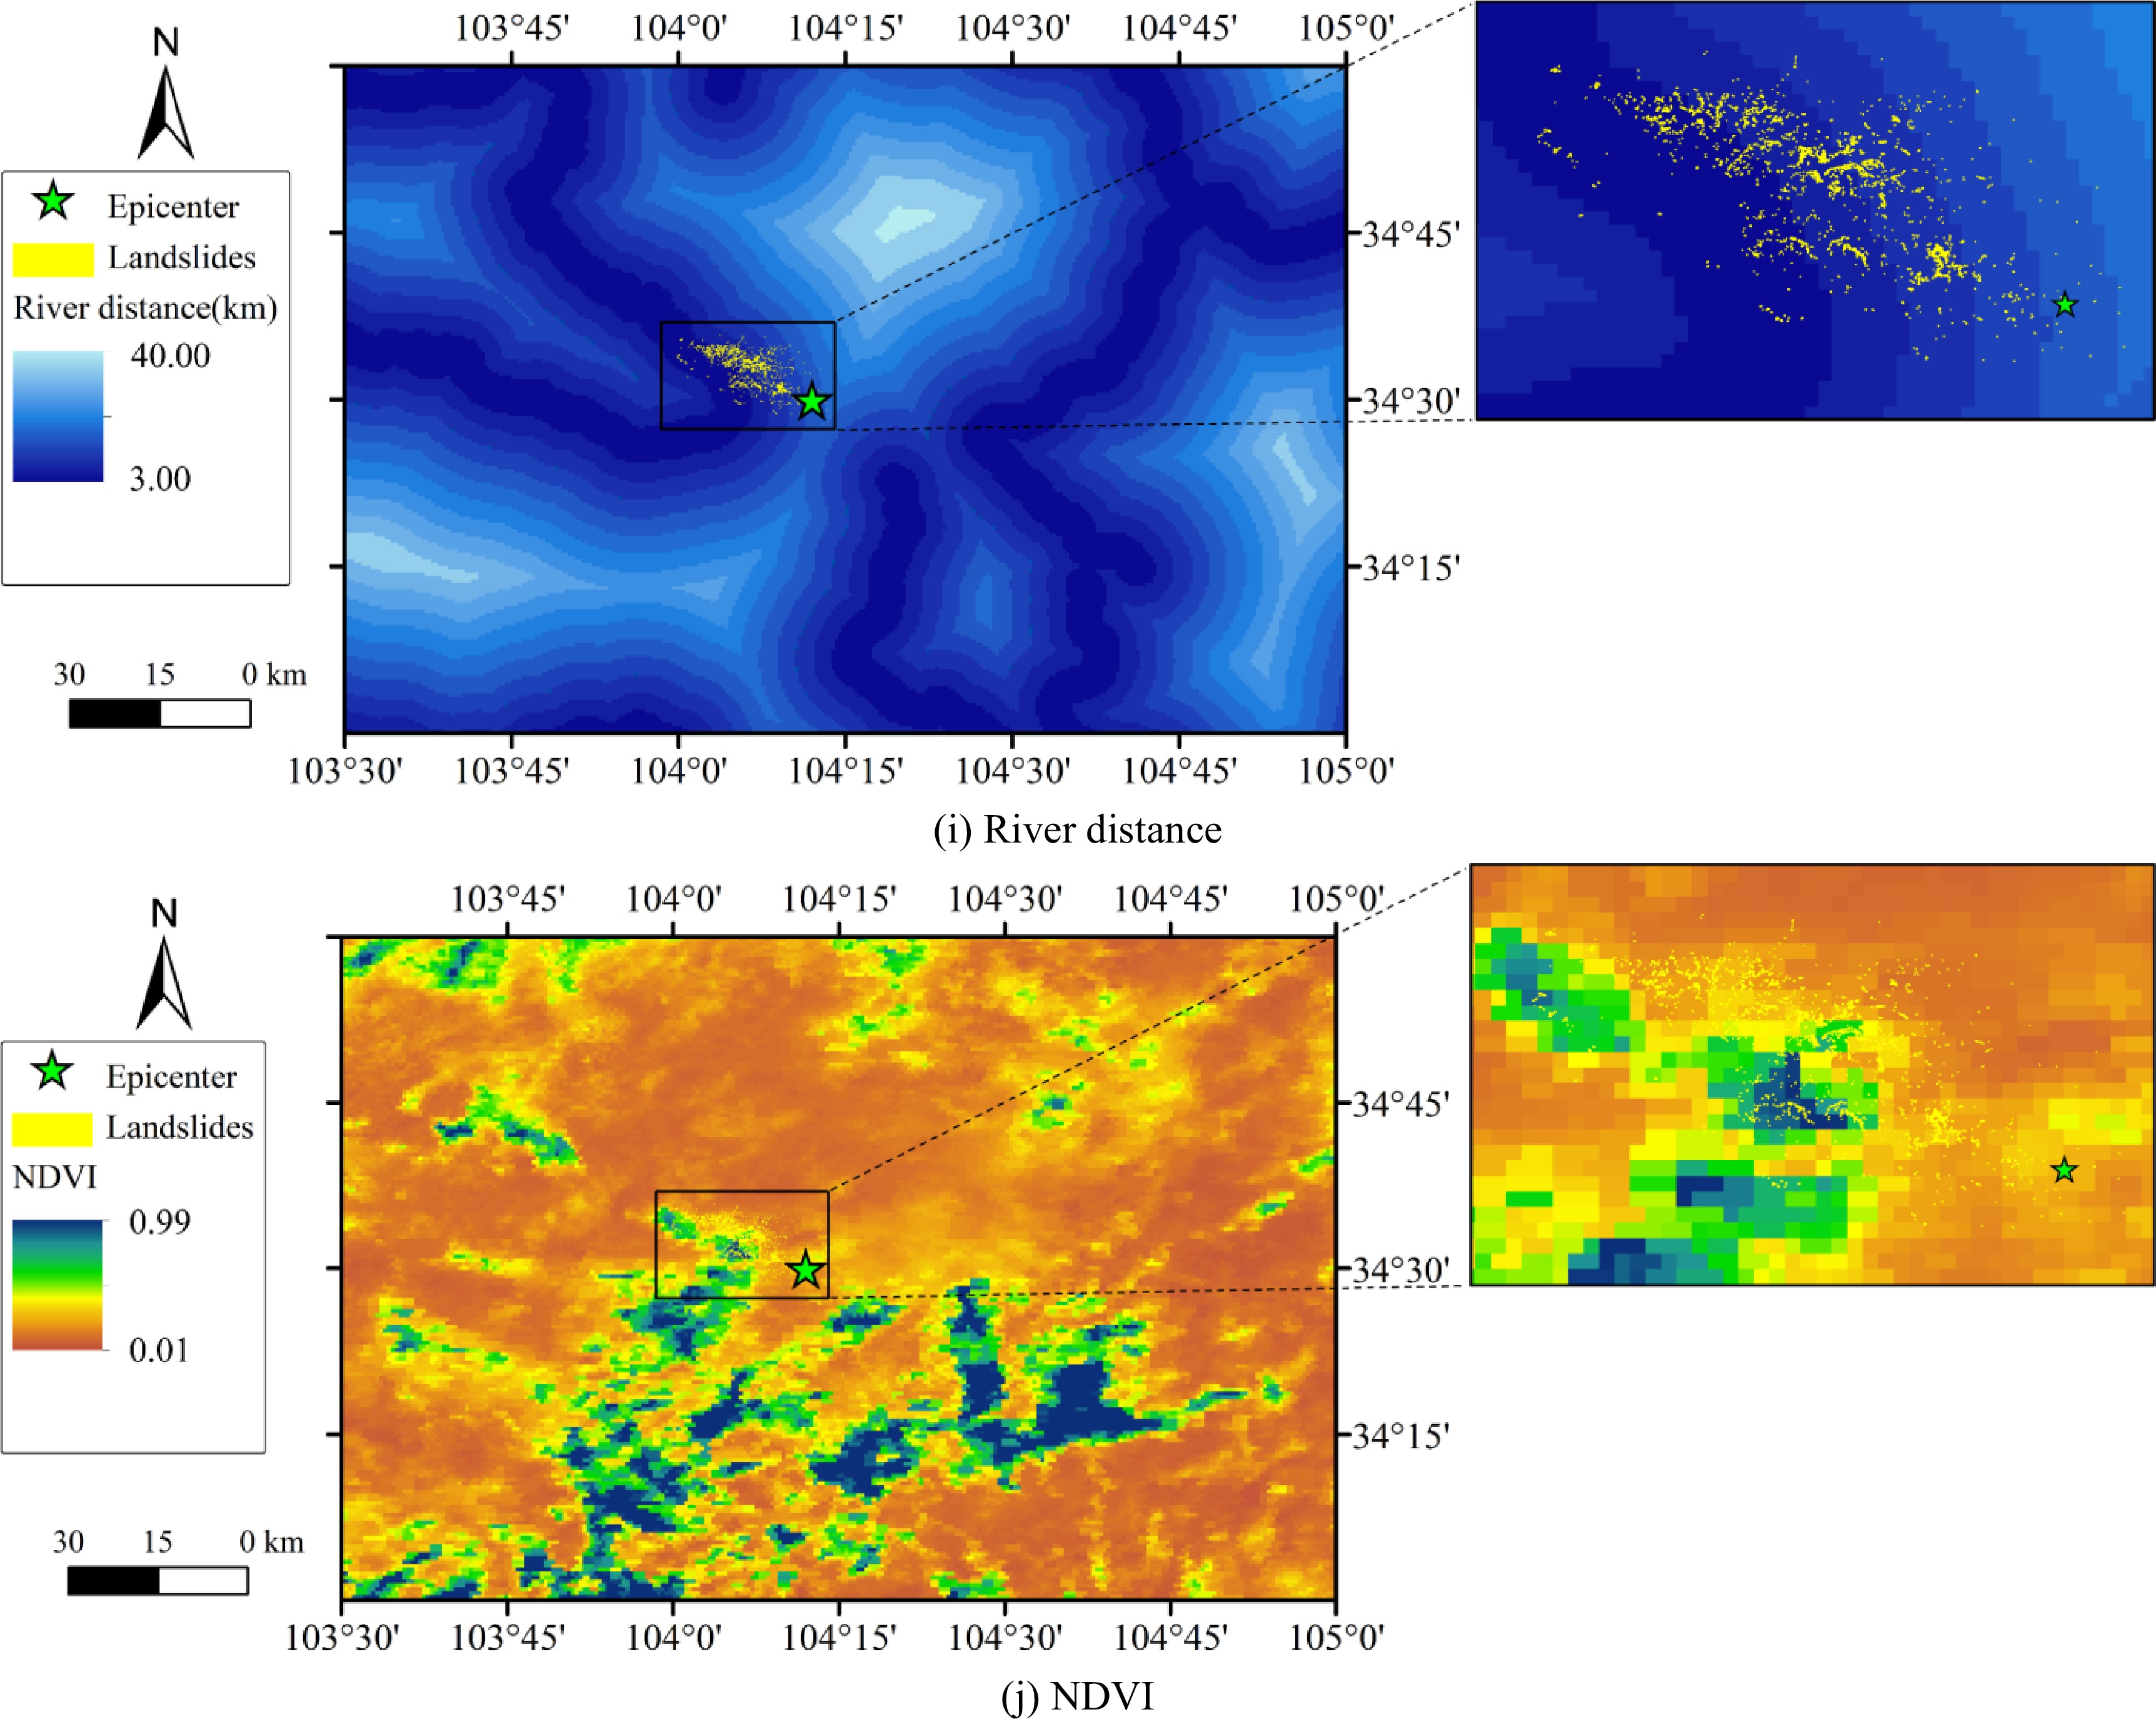
Figure 4.
(continued).
-
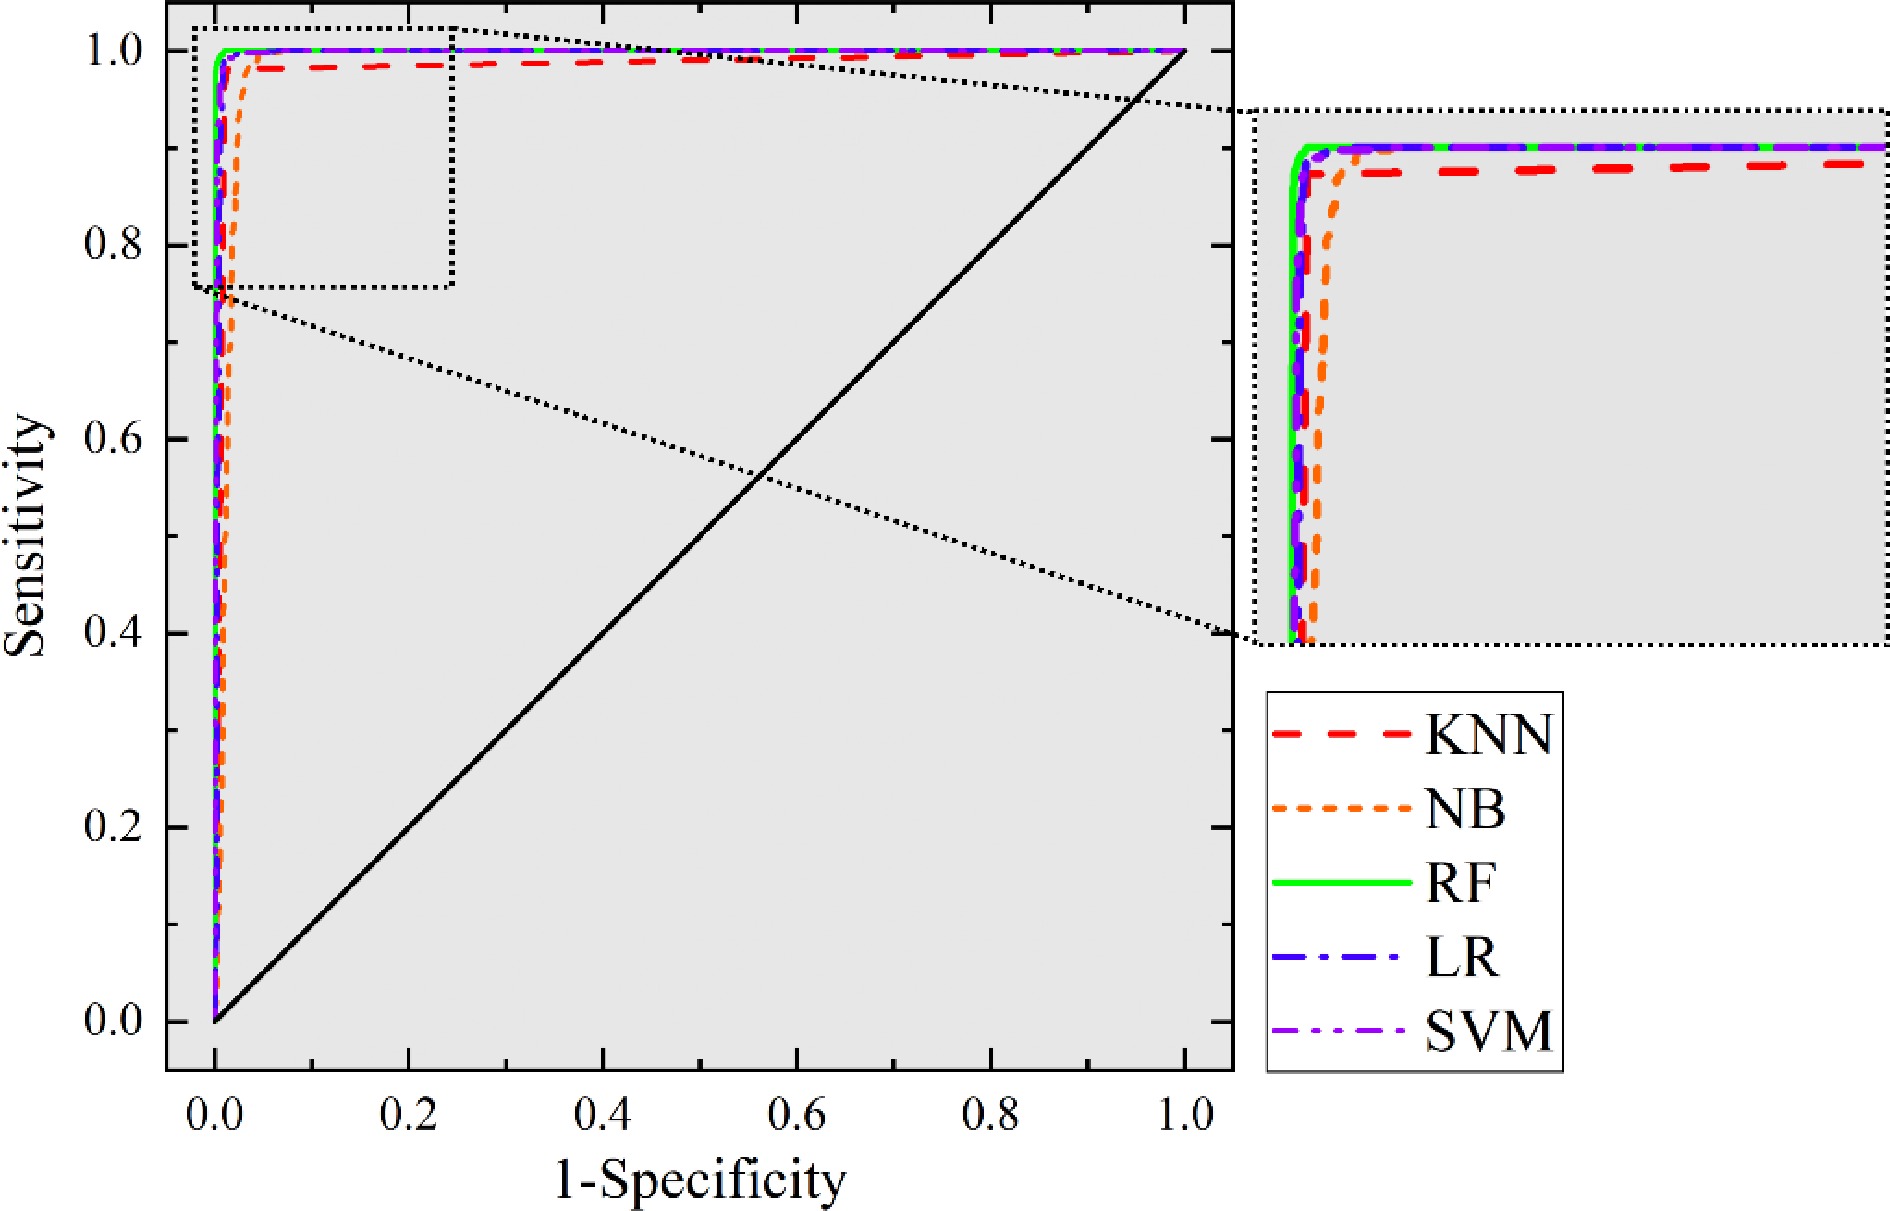
Figure 5.
ROC curve for model testing.
-
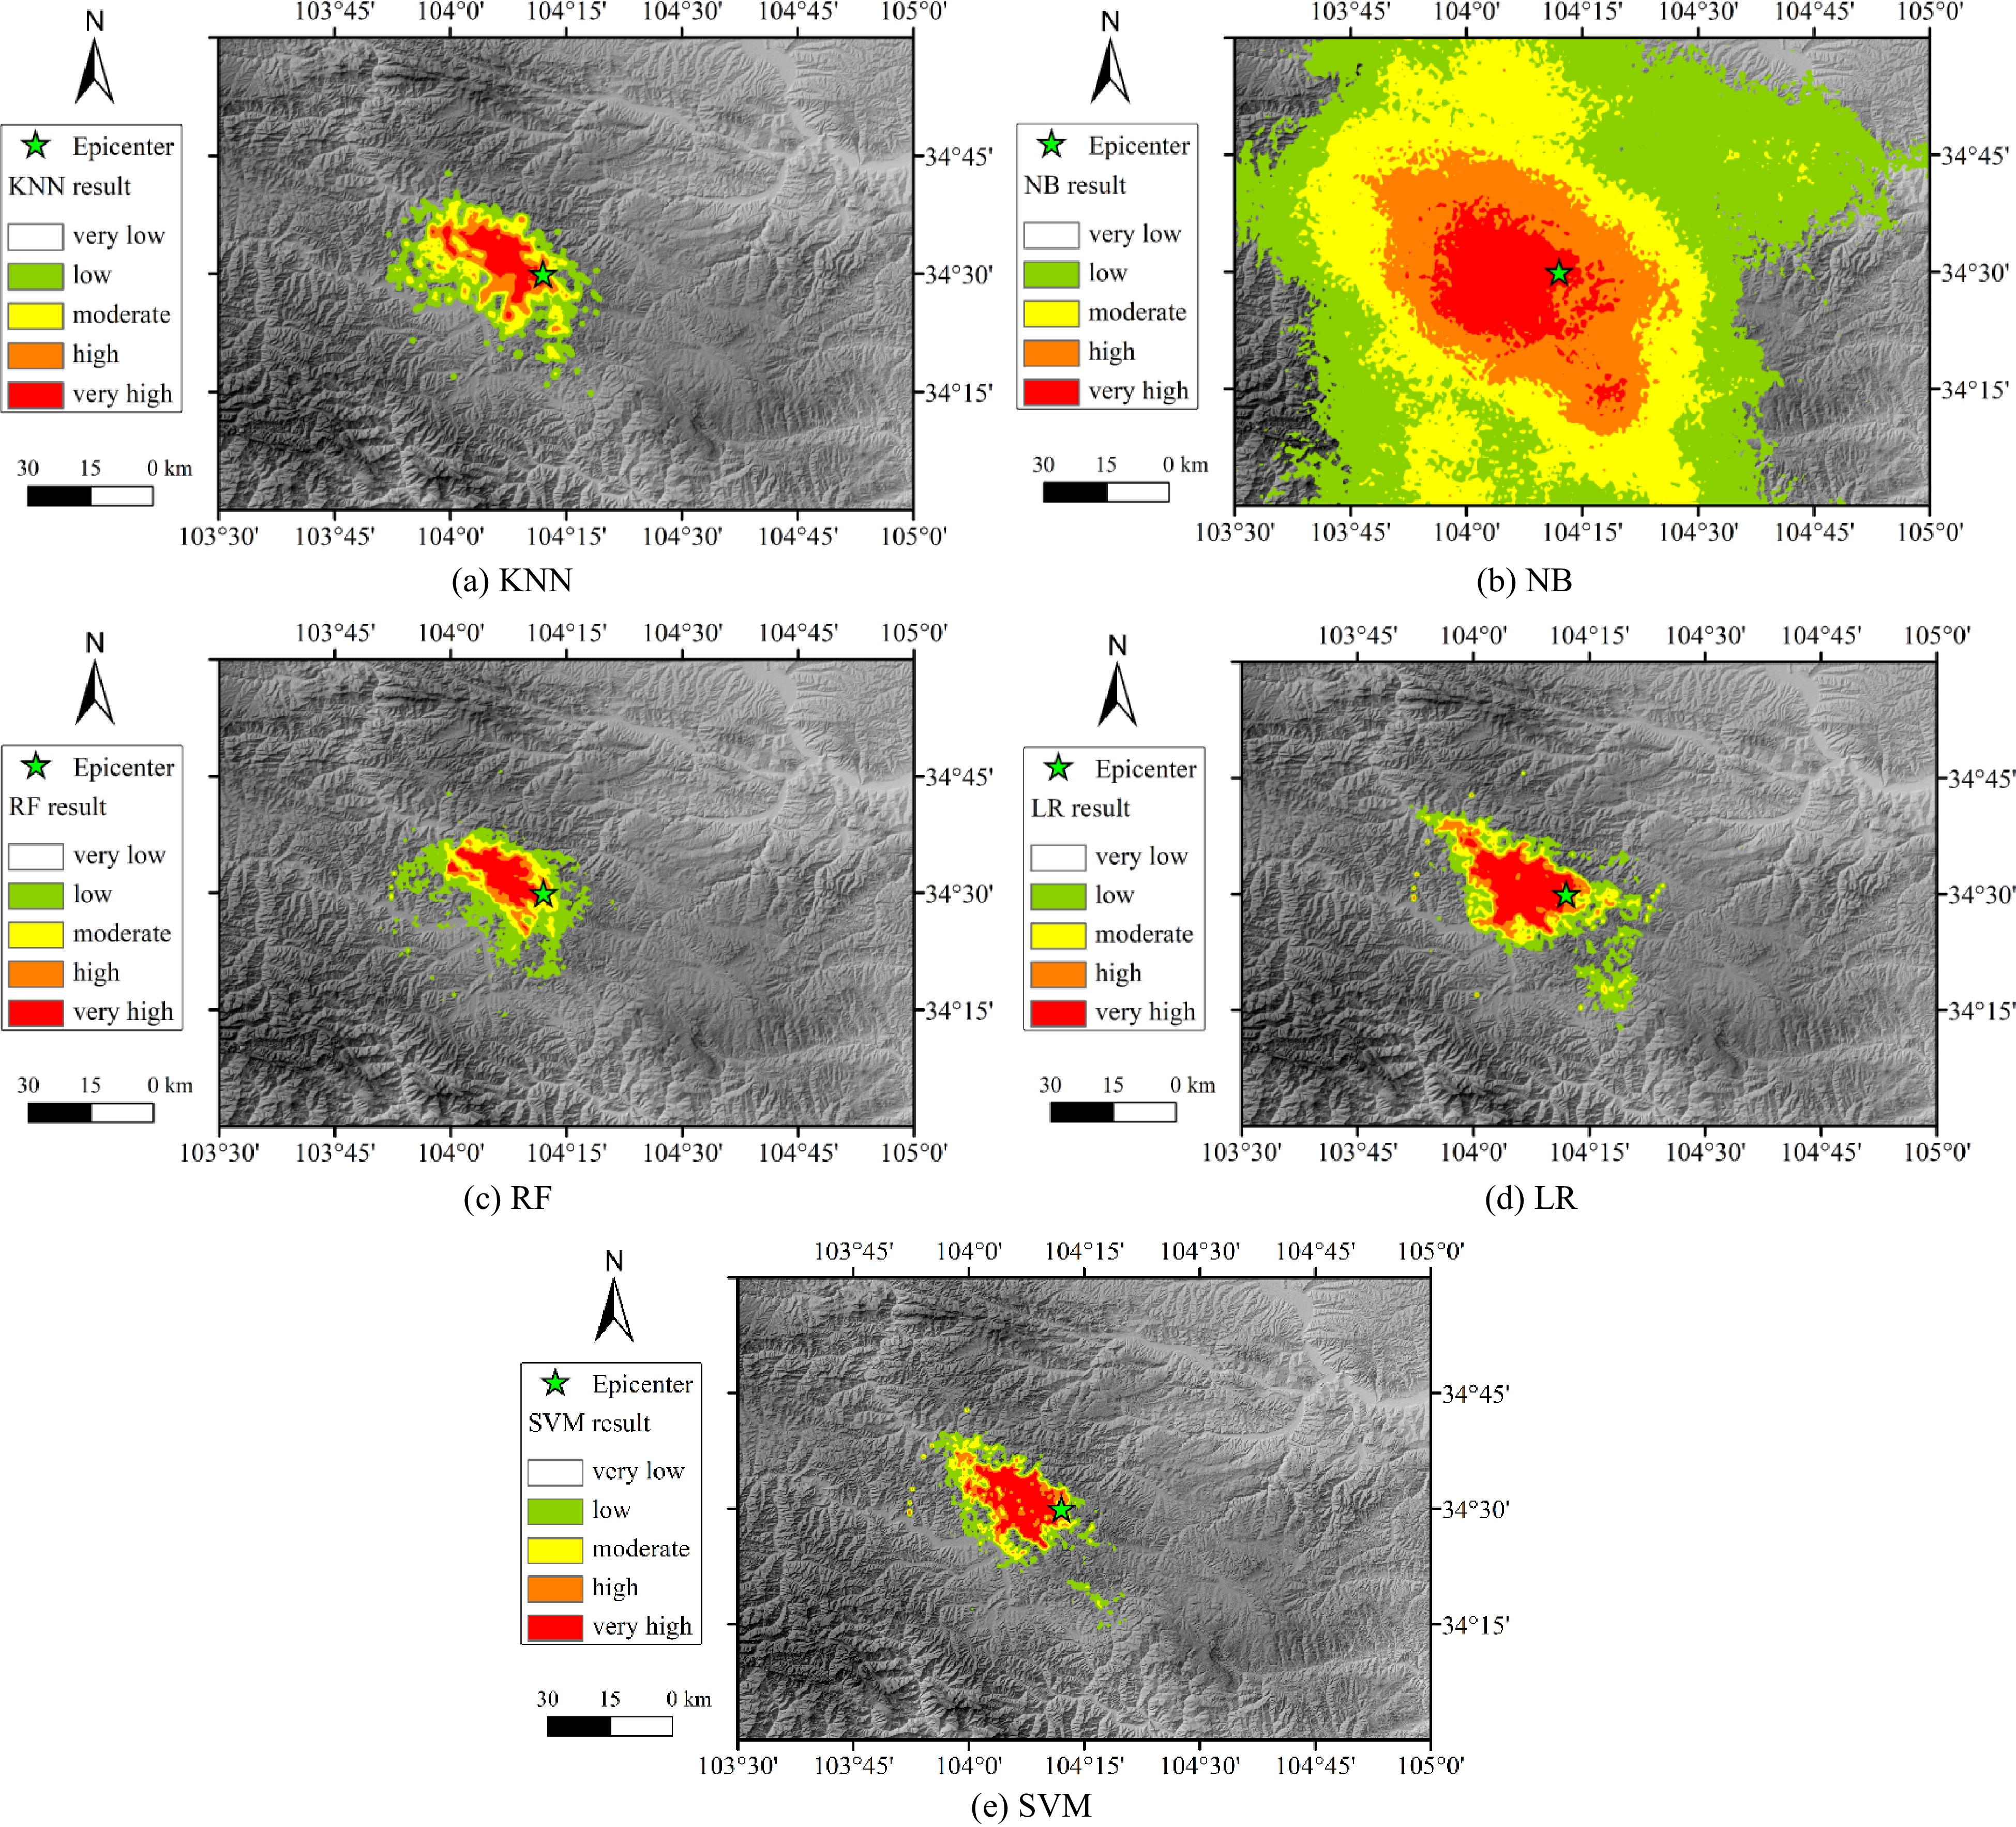
Figure 6.
Results of the predicted landslide susceptibility.
-
Reference Year Influencing factors Methodology Gigovic et al.[13] 2019 Elevation, slope, aspect, distance to road network, distance to river, distance to fault, lithology, NDVI, terrain wetness index (TWI), stream power index (SPI), sediment transport index (STI), annual rainfall, distance to urban area, and land use rate Multi-criteria decision analysis best–worst methodology Xu et al.[14] 2012 Slope, aspect, slope curvature, elevation, surface catchment, drainage distance, road distance, lithology, fault distance, and NDVI Weight of evidence modeling Xu et al.[19] 2012 Elevation, slope angle, slope direction, fault distance, river distance, and lithology Support vector machine Yao et al.[20] 2008 Lithology, slope angle, slope aspect, elevation and vegetation Support vector machine Ma & Xu[21] 2019 Permanent displacement, critical acceleration, terrain, peak ground acceleration, river distance, and road distance Newmark model, support vector machine, logic regression Table 1.
Overview of selection of influencing factors and methodology.
-
Influencing factor Type Resolution Data source Year updated PGA Raster 30 m × 30 m Institute of Engineering Mechanics, China Earthquake Administration 2013 Epicenter distance Raster 30 m × 30 m Internet 2013 Elevation Raster 30 m × 30 m Geospatial Data Cloud site, Computer Network Information Center, Chinese Academy of Sciences 2009 Slope Raster 30 m × 30 m Extracted from DEM 2009 Aspect Raster 30 m × 30 m Extracted from DEM 2009 Plan curvature Raster 30 m × 30 m Extracted from DEM 2009 Profile curvature Raster 30 m × 30 m Extracted from DEM 2009 Fault distance Raster 1:100000 China Earthquake Network Center 2011 River distance Raster 1:100000 China Earthquake Network Center 2011 NDVI Raster 90 m × 90 m Geospatial Data Cloud site, Computer Network Information Center, Chinese Academy of Sciences 2012 Table 2.
Data details of influencing factors.
-
Model R2 AUC KNN 0.988 0.986 NB 0.811 0.988 RF 0.995 0.999 LR 0.989 0.997 SVM 0.990 0.998 Table 3.
Prediction performance for KNN, NB, RF, LR, and SVM.
Figures
(8)
Tables
(3)