-

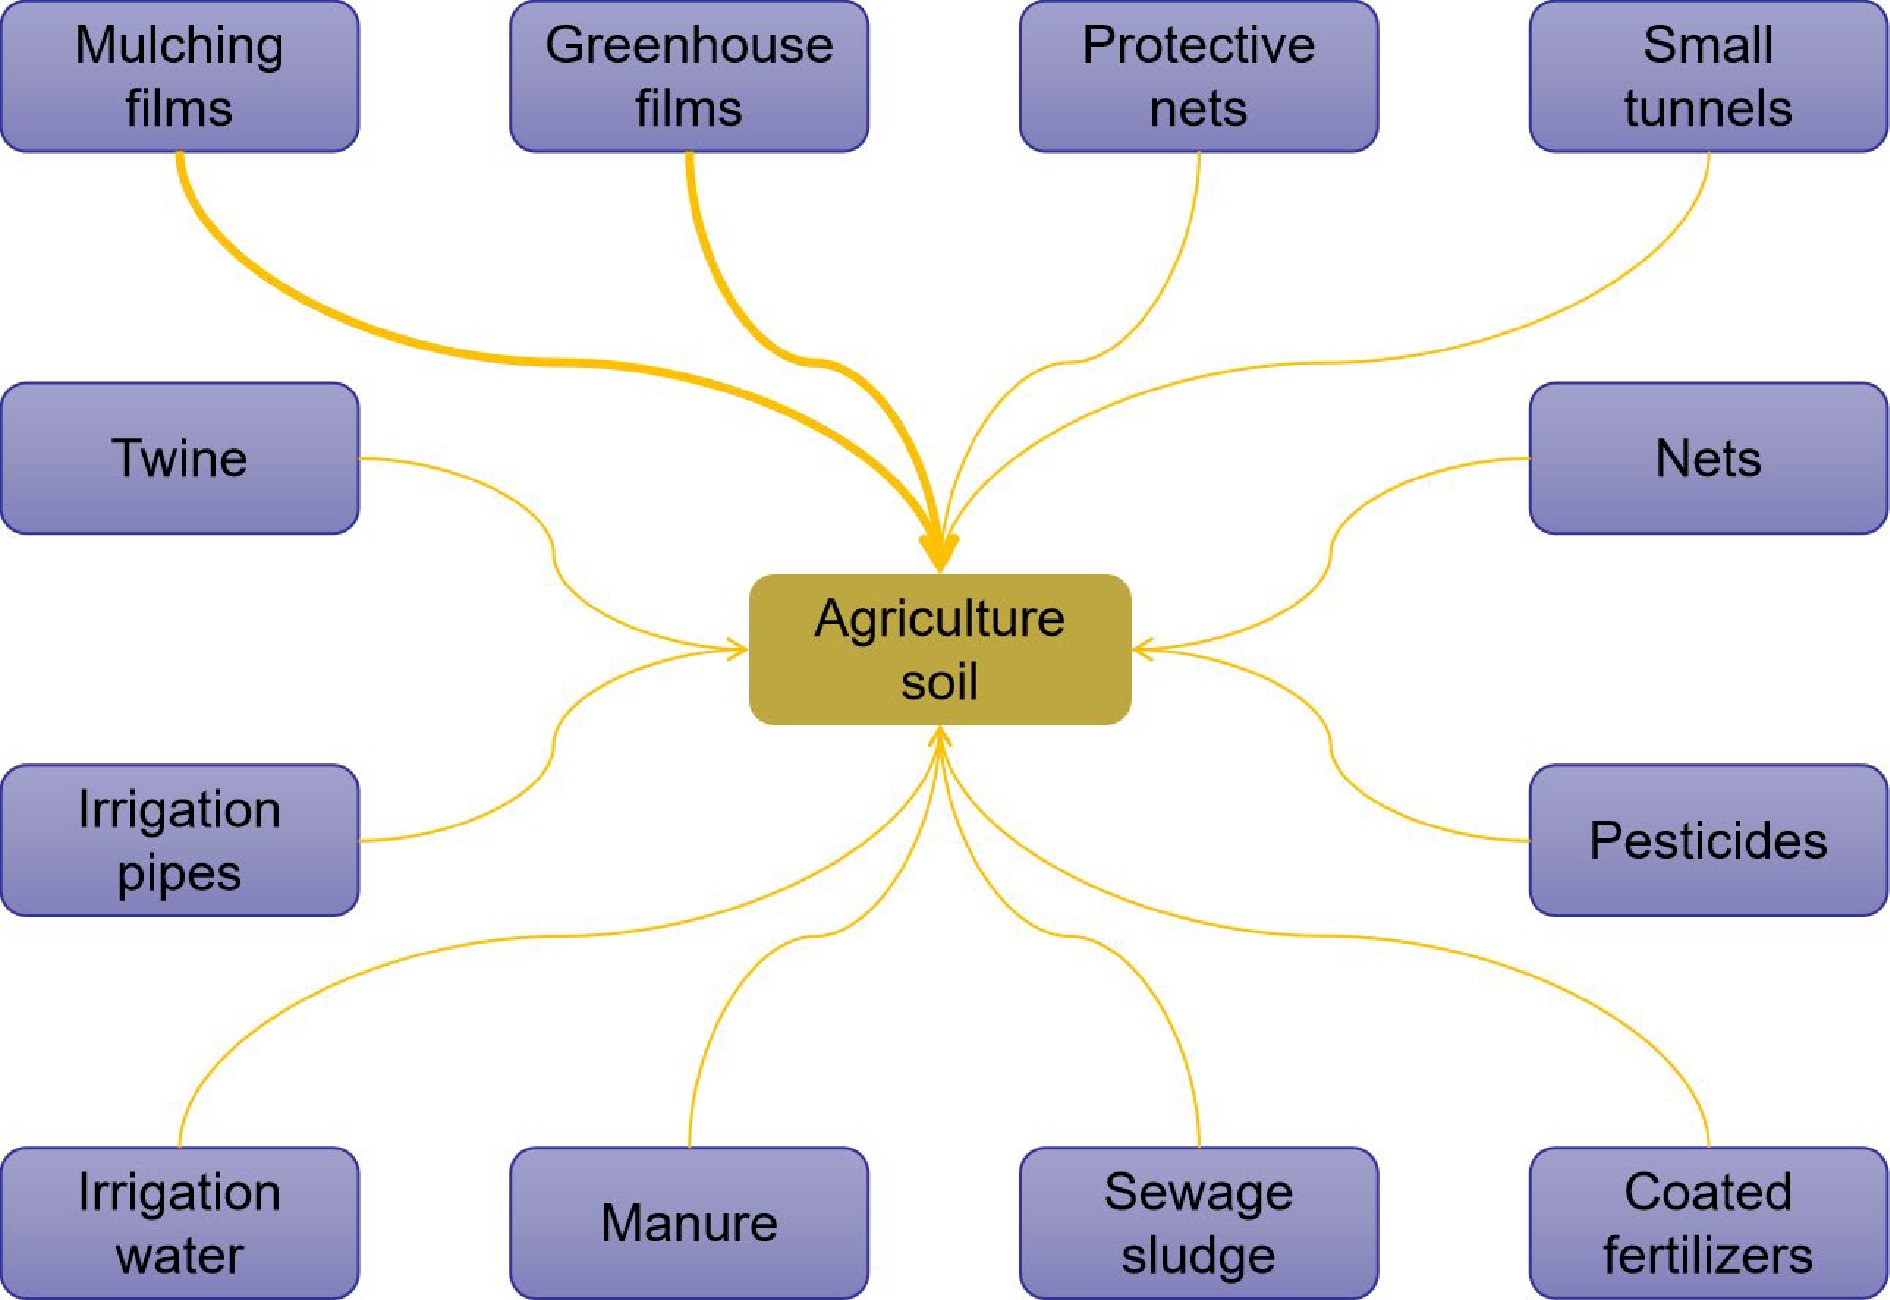
Figure 1.
Micro/nanoplastic sources in soils. The bold lines represent greater contributions of micro/nanoplastics.
-

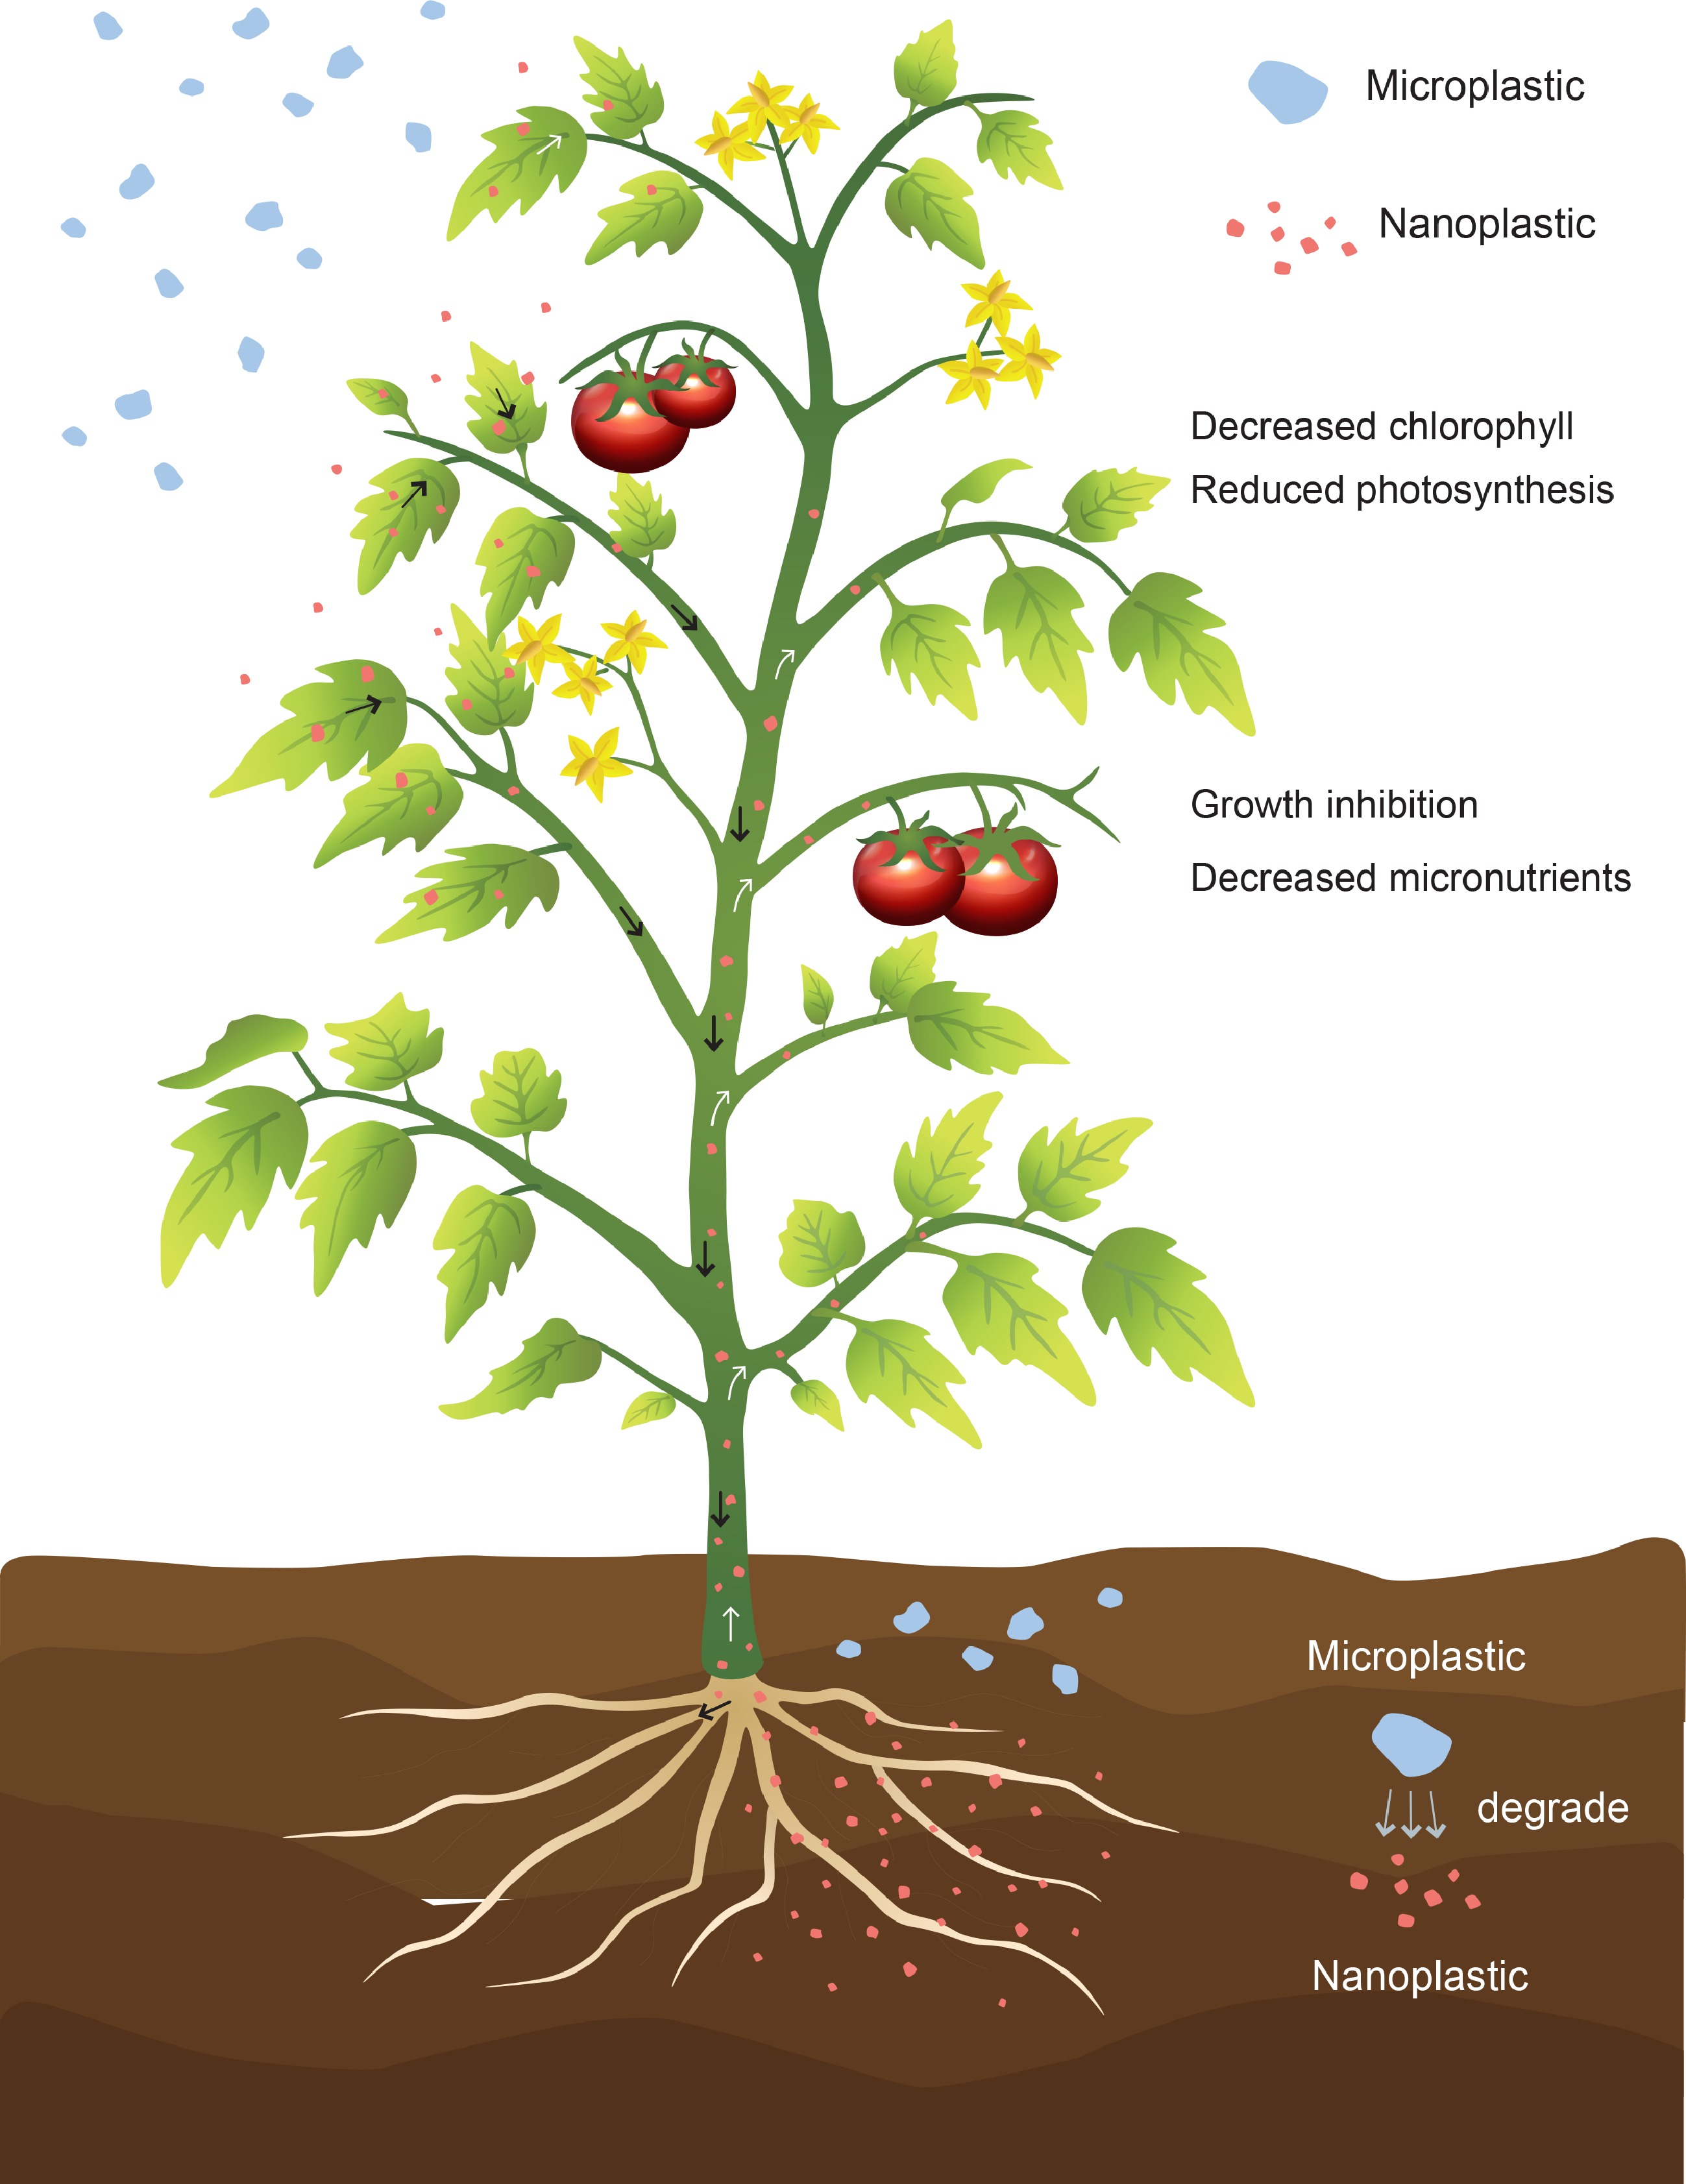
Figure 2.
Nanoplastic (pink particles) transport from roots to shoots in plants. Microplastics (blue gray particles) in soil are gradually degraded into nanoplastics by biotic and abiotic actions. Nanoplastics are absorbed by plant roots, enter vascular tissues and are transported to the shoot by transpiration (shown by white arrow). Plant leaves adsorb microplastics and absorb nanoplastics from the atmosphere (shown by black arrow). Airborne nanoplastics enter the plant through the stomata.
-

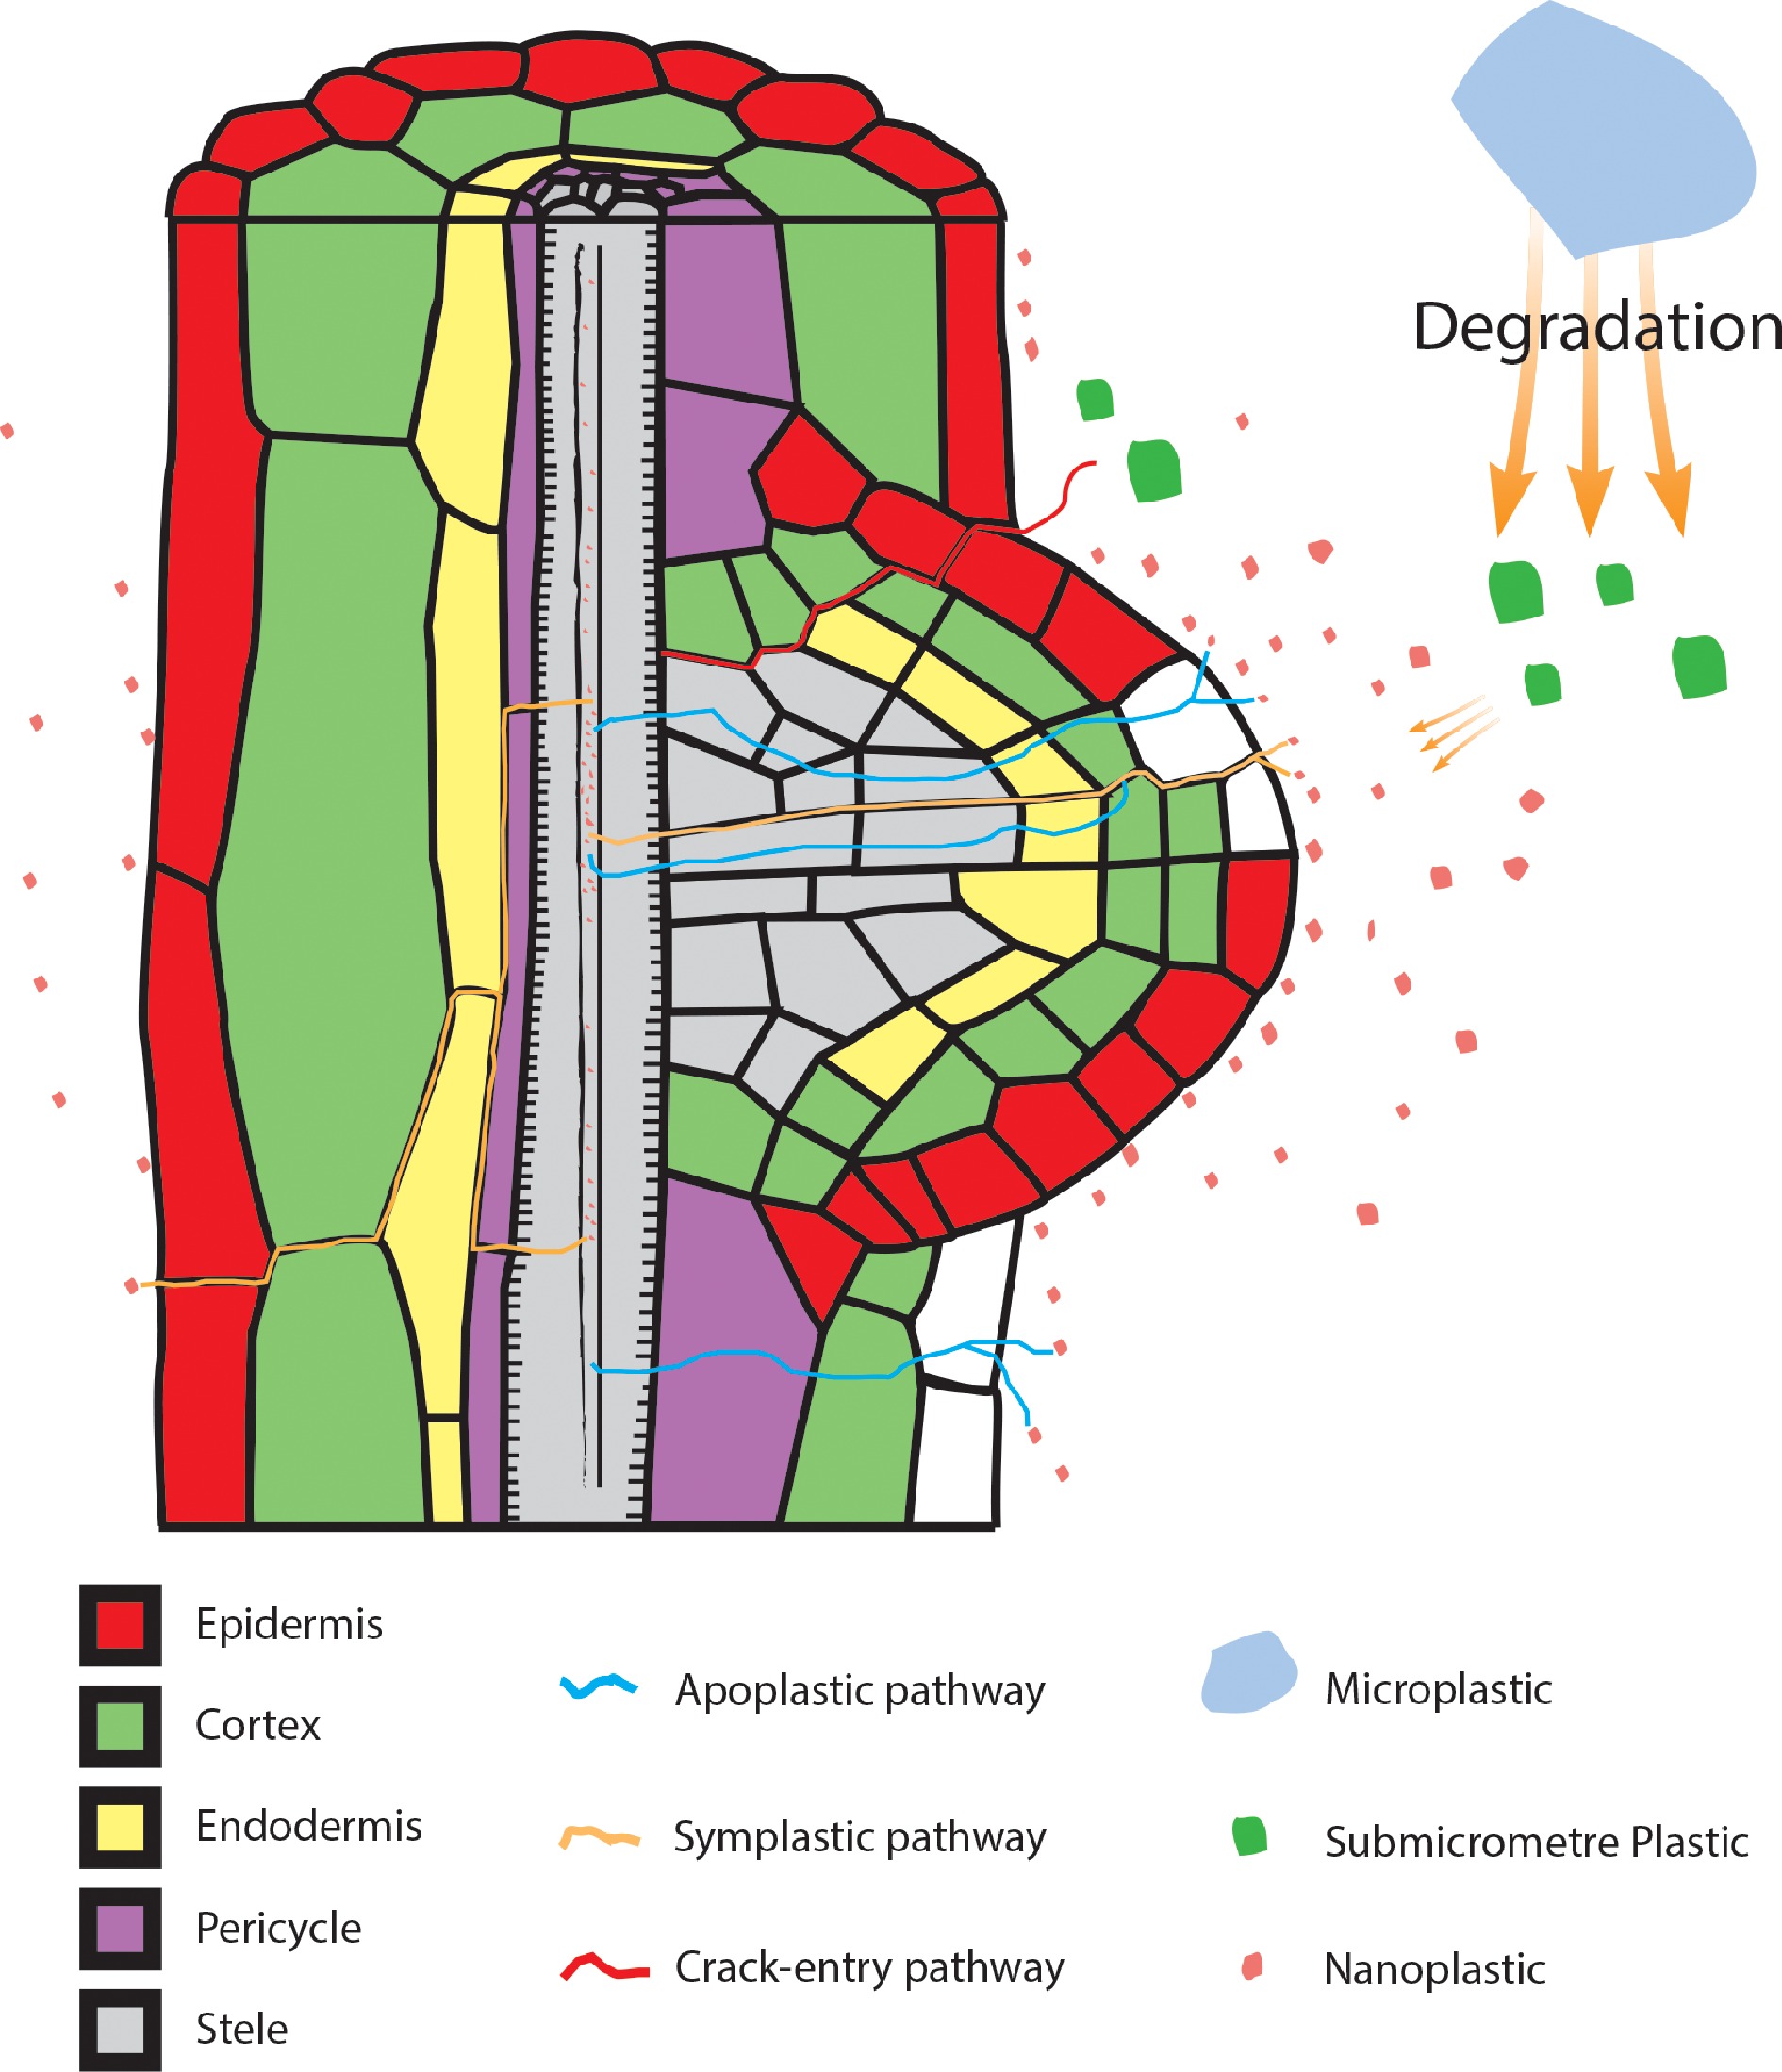
Figure 3.
Nanoplastic pathways in plant roots. Nanoplastics have been reported to enter plant root systems through two pathways, namely, the symplastic pathway and apoplastic pathway. Symplastic pathway: plants absorb nanoplastics around the root system through endocytosis or channels (e.g., aquaporins) in the cell membrane. This pathway is represented by the blue line. Apoplastic pathway: nanoplastics enter the root system and move through the intercellular space. This pathway is indicated by the orange line. Submicrometer plastics (green particles) are taken up by crop plants via a crack-entry mode that is indicated by the red line.
-

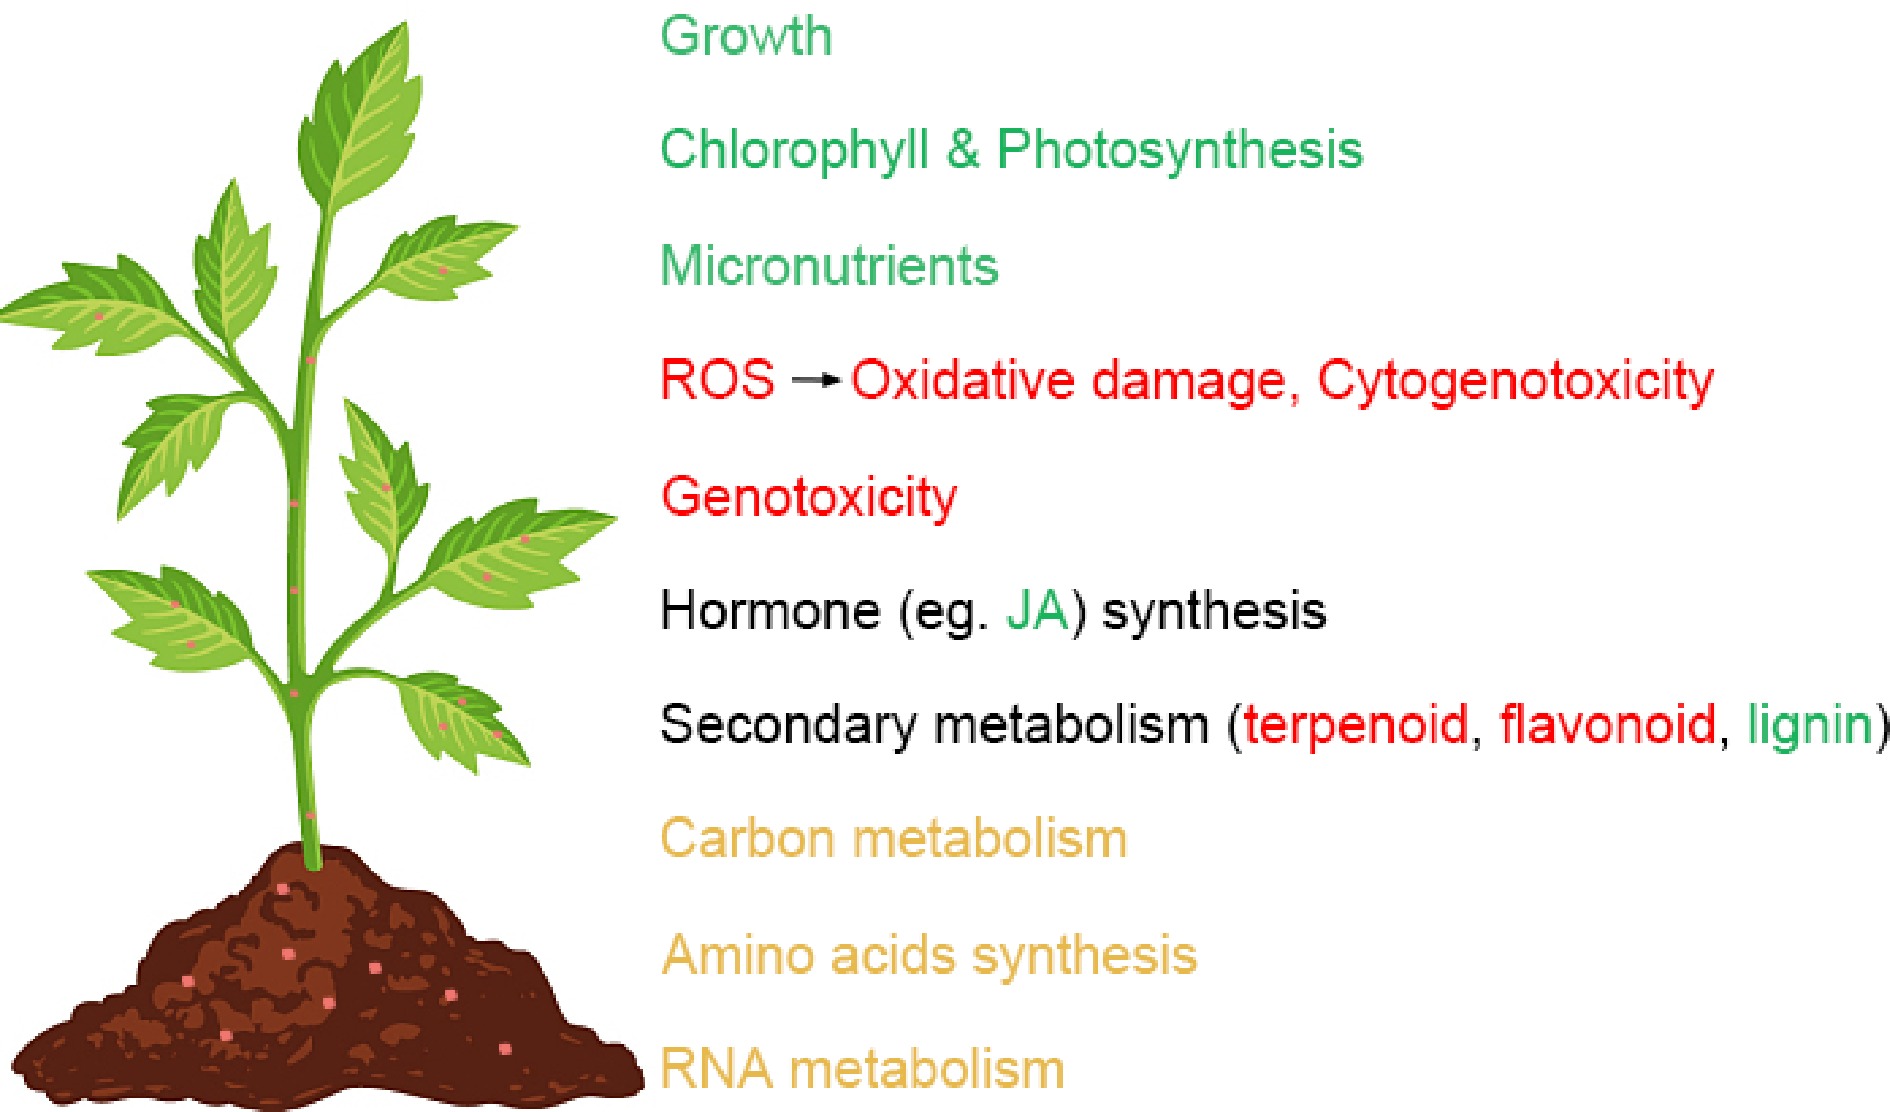
Figure 4.
Main effects of micro/nanoplastics on plants. Green indicates a decrease, red indicates an increase, and yellow indicates that the effect is not yet clear.
-
Technology Microplastic scale Advantage(s) Disadvantage(s) Quantitative
(yes or no?)Used in crops Visual inspection 1 − 5 mm easy and quick only suitable for large-scale microplastics no Optical microscope observation 100 μm − 1 mm easy and quick large error no CLSM > 5 μm visual analysis limited applicability no wheat[54], Arabidopsis[55], lettuce[56], wheat[57], rice[58,59] SEM > 0.1 μm intuitive and clear images strong background interference and expensive equipment no lettuce[56,60], wheat[57] TEM < 100 nm intuitive and clear images Technical difficulty No Arabidopsis[61] Thermal analysis no limit quick destruction of microplastic structures yes RS > 10 μm wide range of applications, unaffected by water easily interfered with by fluorescent substances yes SERS 5 − 100 nm high sensitivity narrow detection range yes FTIR 10 − 300 µm fast and accurate samples need to be dried yes Py-GC/MS no limit quick not suitable for analyzing samples with complex matrices yes cucumber[62] XPS no limit nondestructive testing expensive and inconvenient yes ICP‒MS < 1 μm trace detection and visualization PS-Eu particles need to be labeled yes wheat[60], lettuce[60] Table 1.
Several micro/nanoplastic detection technologies.
Figures
(4)
Tables
(1)