-
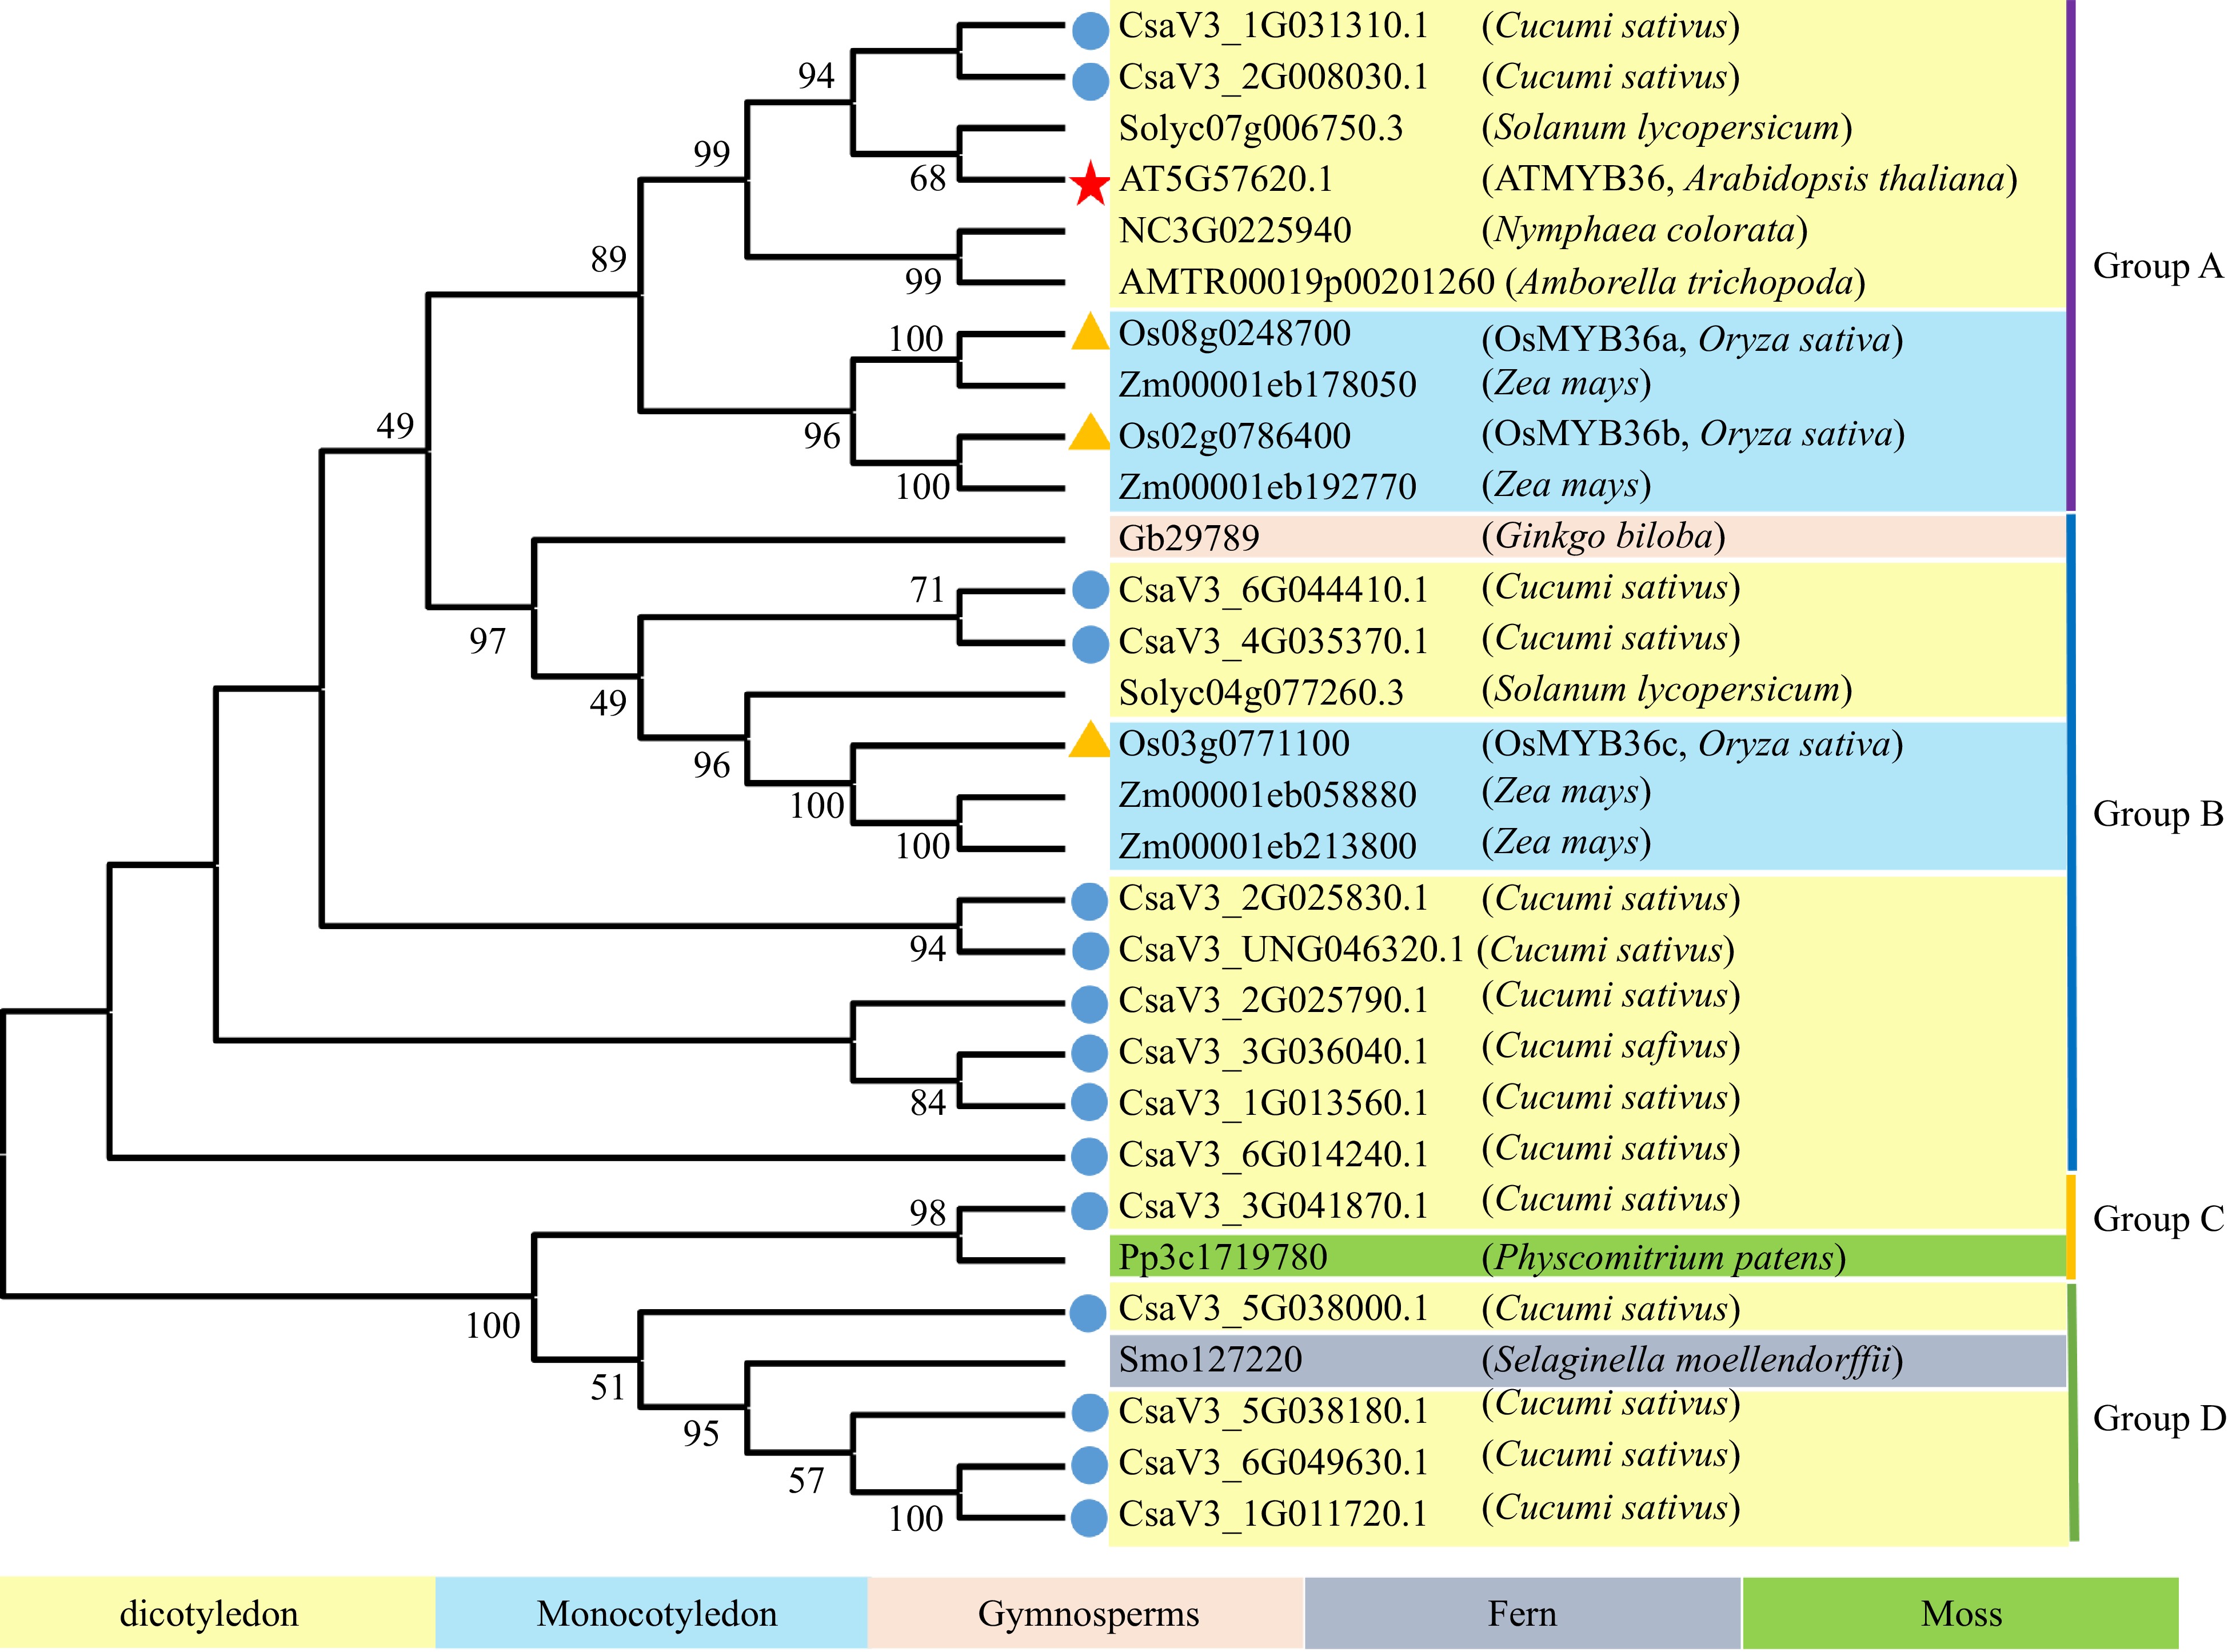
Figure 1.
Phylogenetic analysis of CsMYB36 homologues in Cucumis sativus and other plants. Blue dots highlight CsMYB36 homologues in Cucumis sativus. Yellow triangles highlight MYB36 homologues in Oryza sativa. The scale bar is the number of amino acid substitutions per site. See Supplemental Table S2 for the alignments of MYB36 homologues in different species.
-
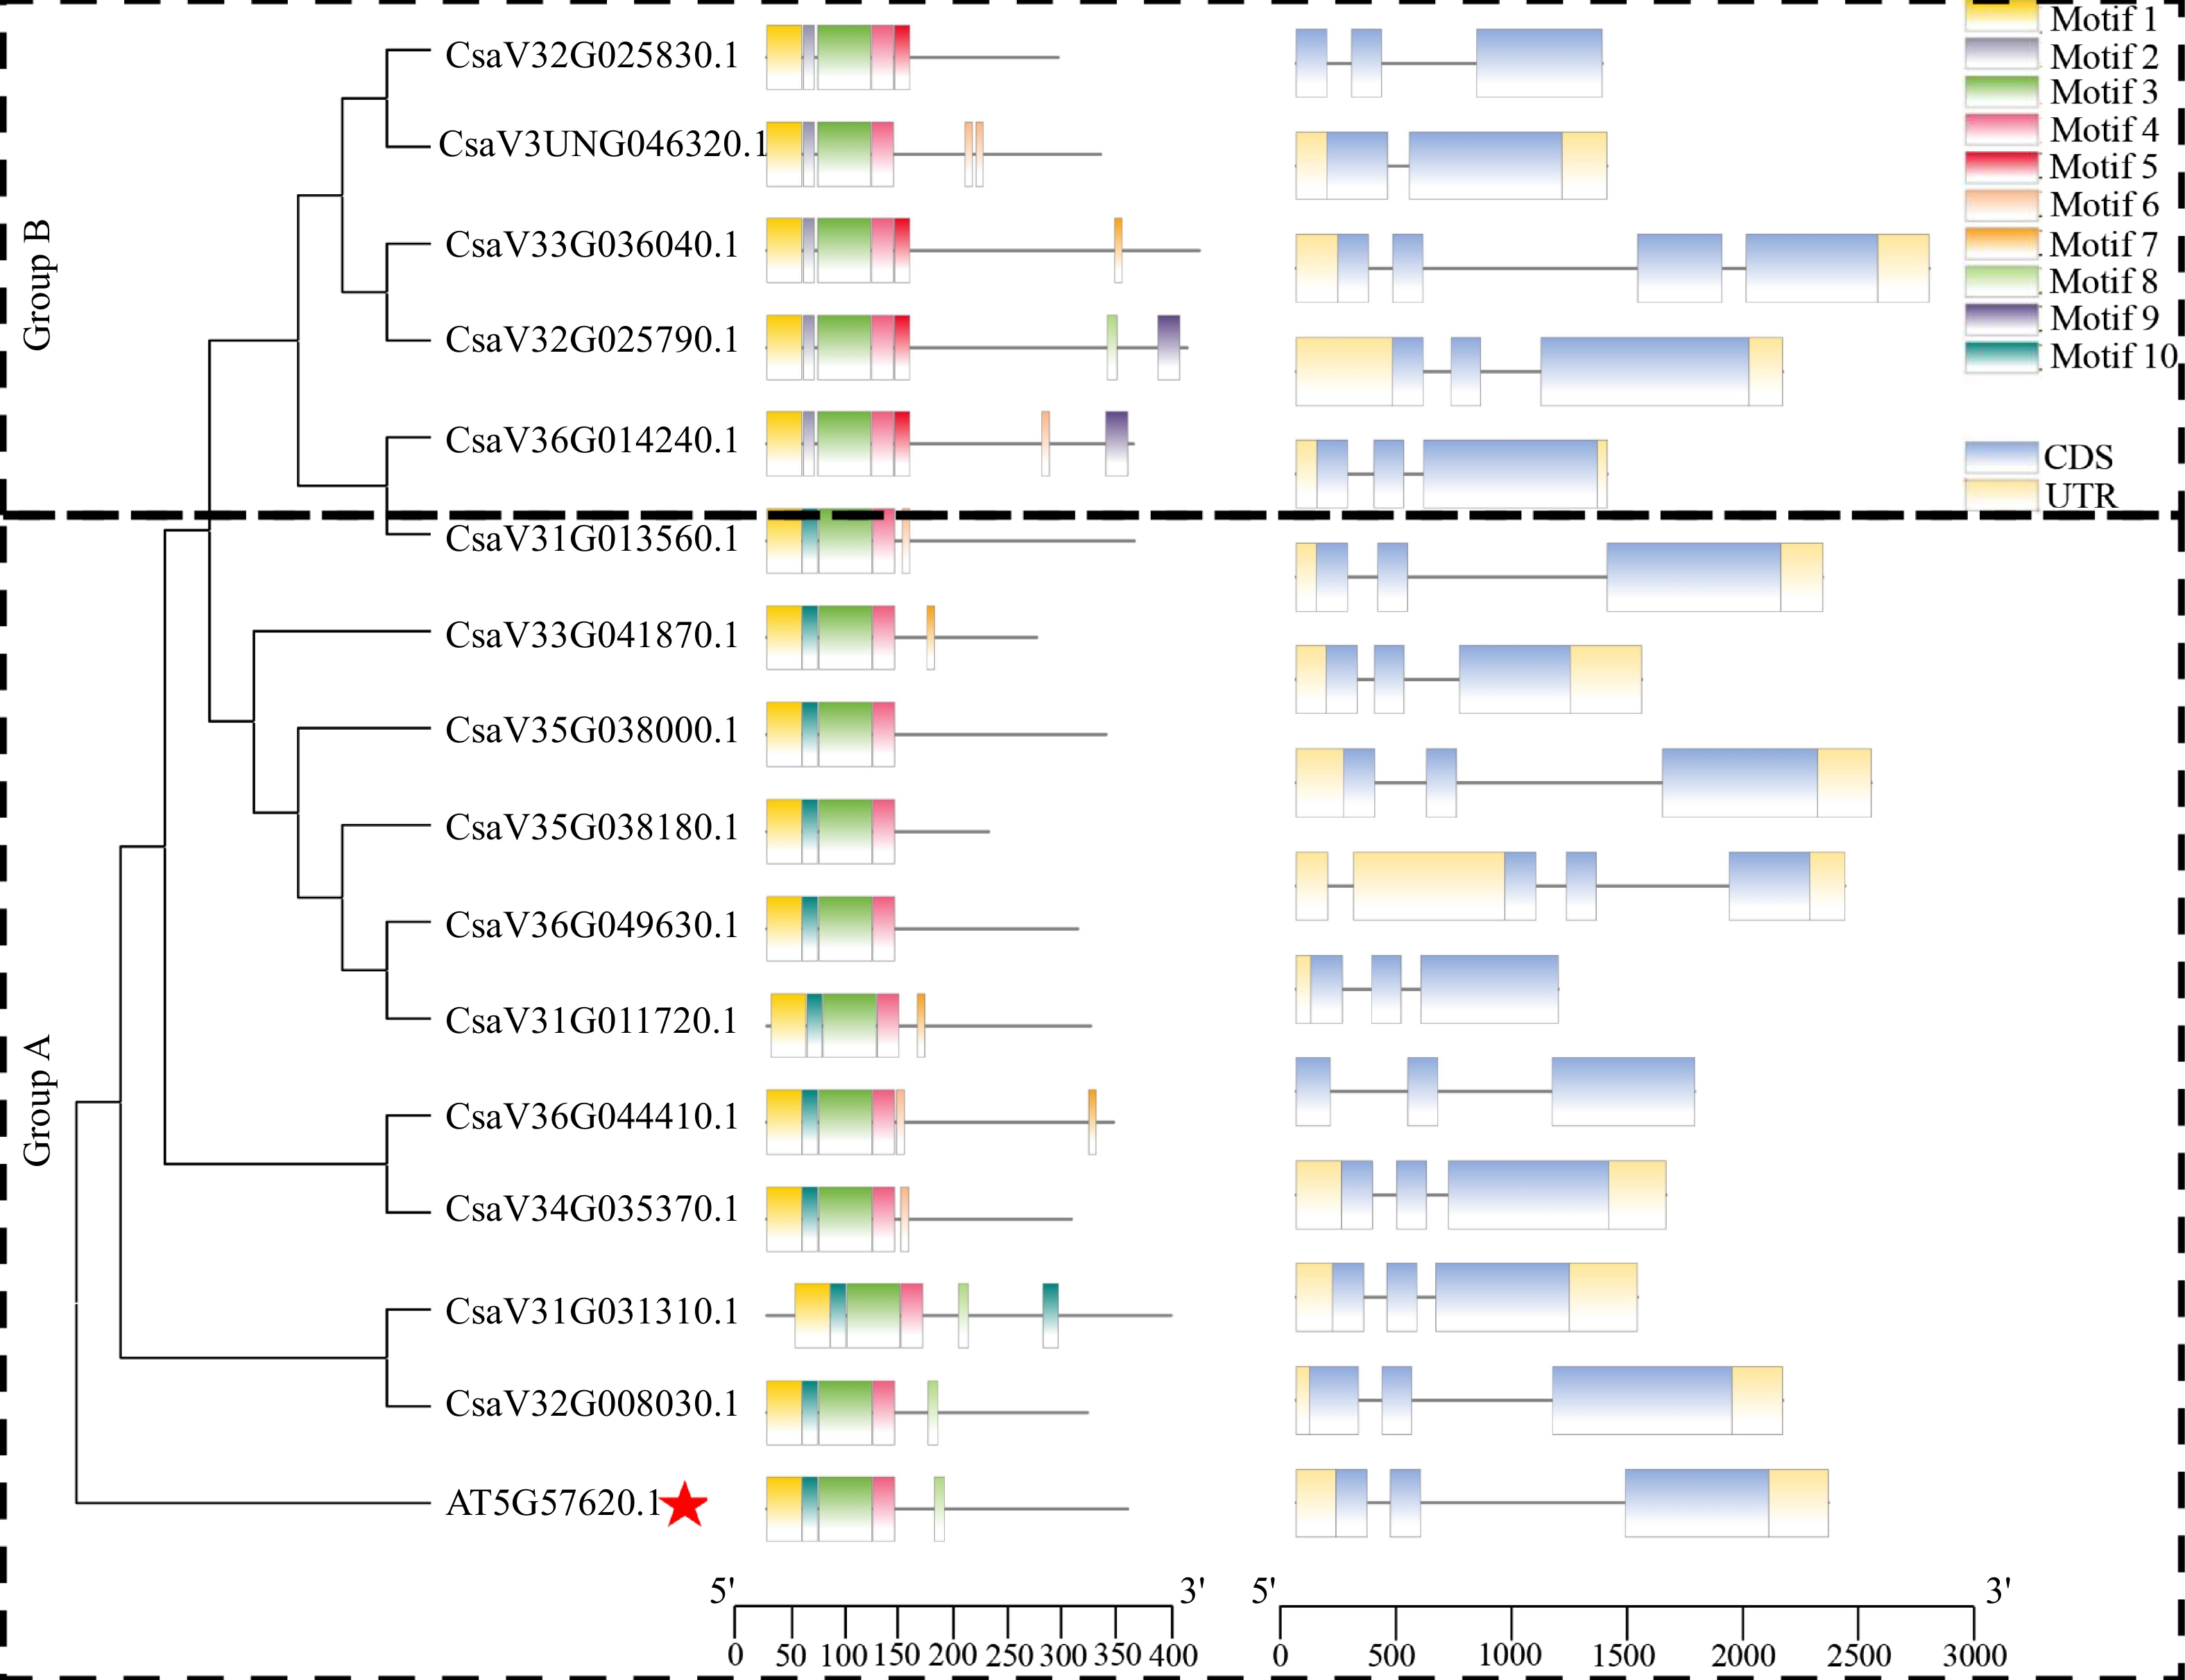
Figure 2.
Phylogenetic tree, conserved motifs and gene structure of CsMYB36 family genes in Arabidopsis thaliana and Cucumi sativus. The red star highlights the MYB36 homolog in Arabidopsis thaliana.
-
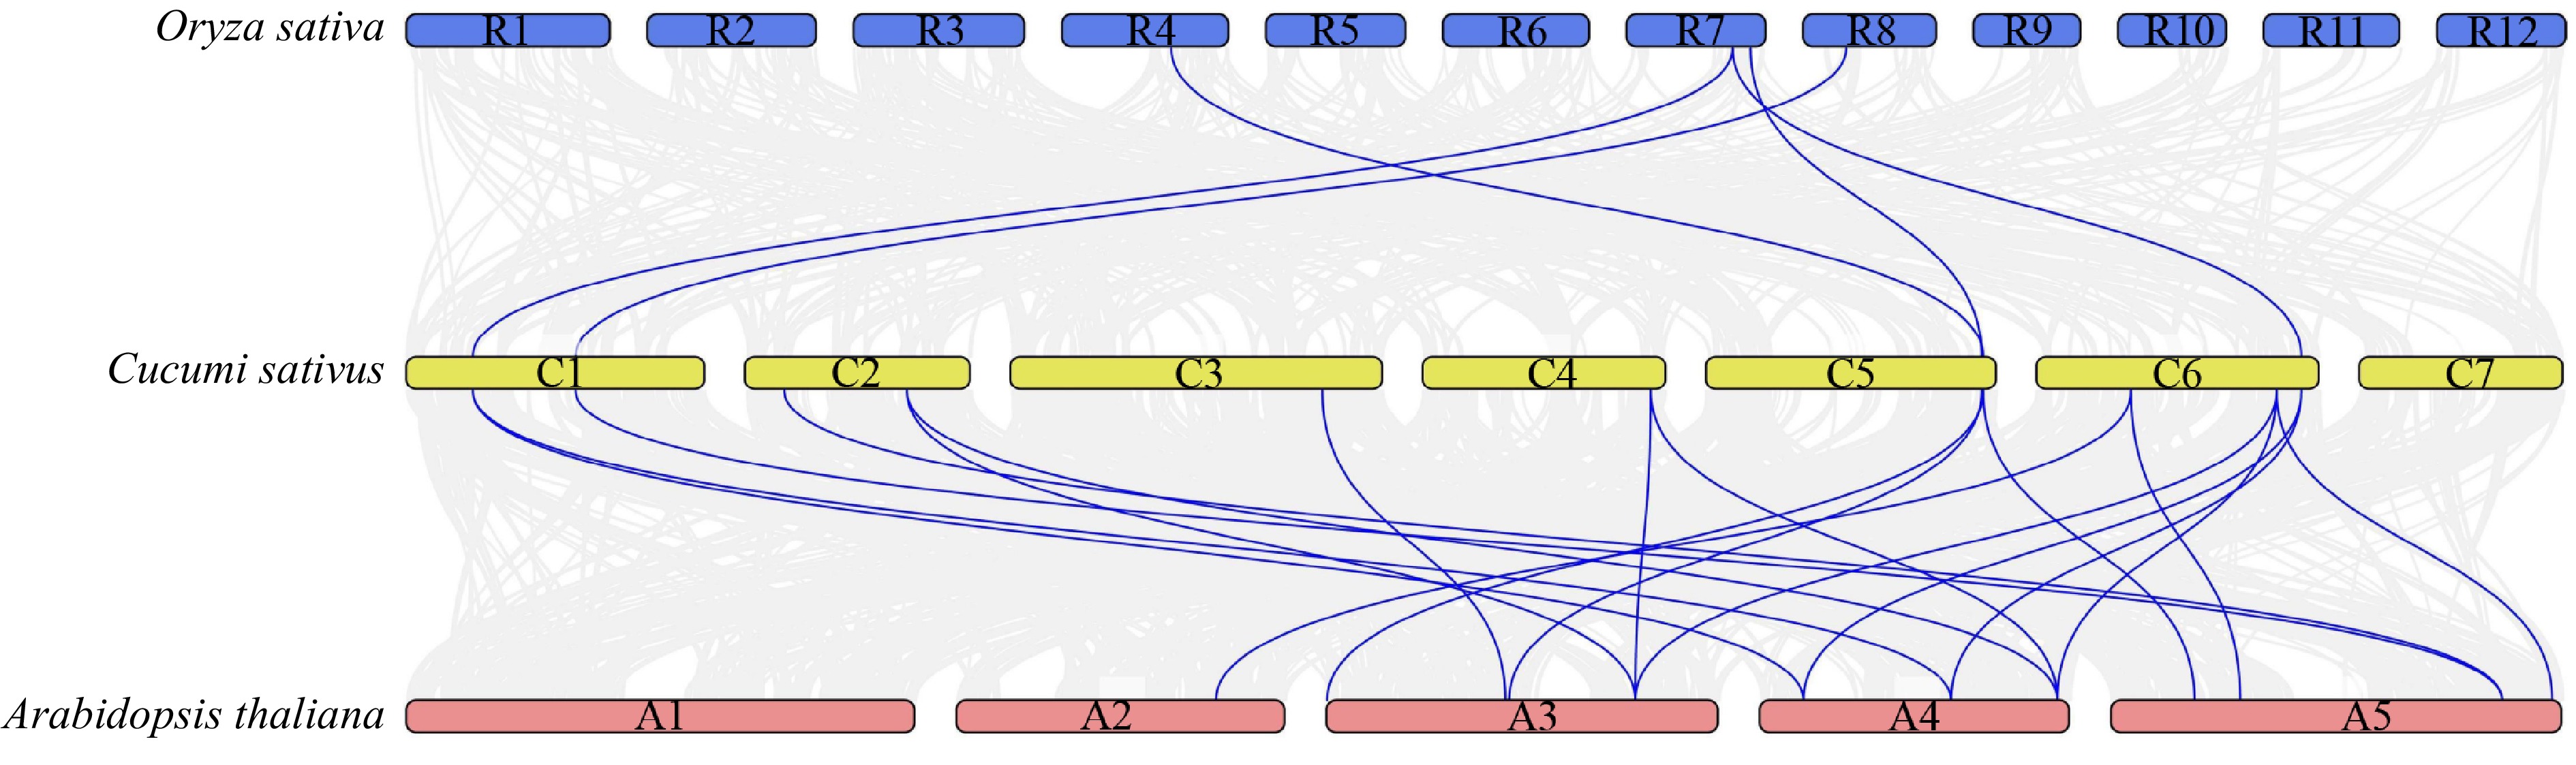
Figure 3.
Syntenic analysis of MYB36 family genes in Cucumis sativus, Arabidopsis thaliana and Oryza sativa. The blue line highlights the genes with syntenic relationships. See Supplemental Table S5 for these genes ID.
-
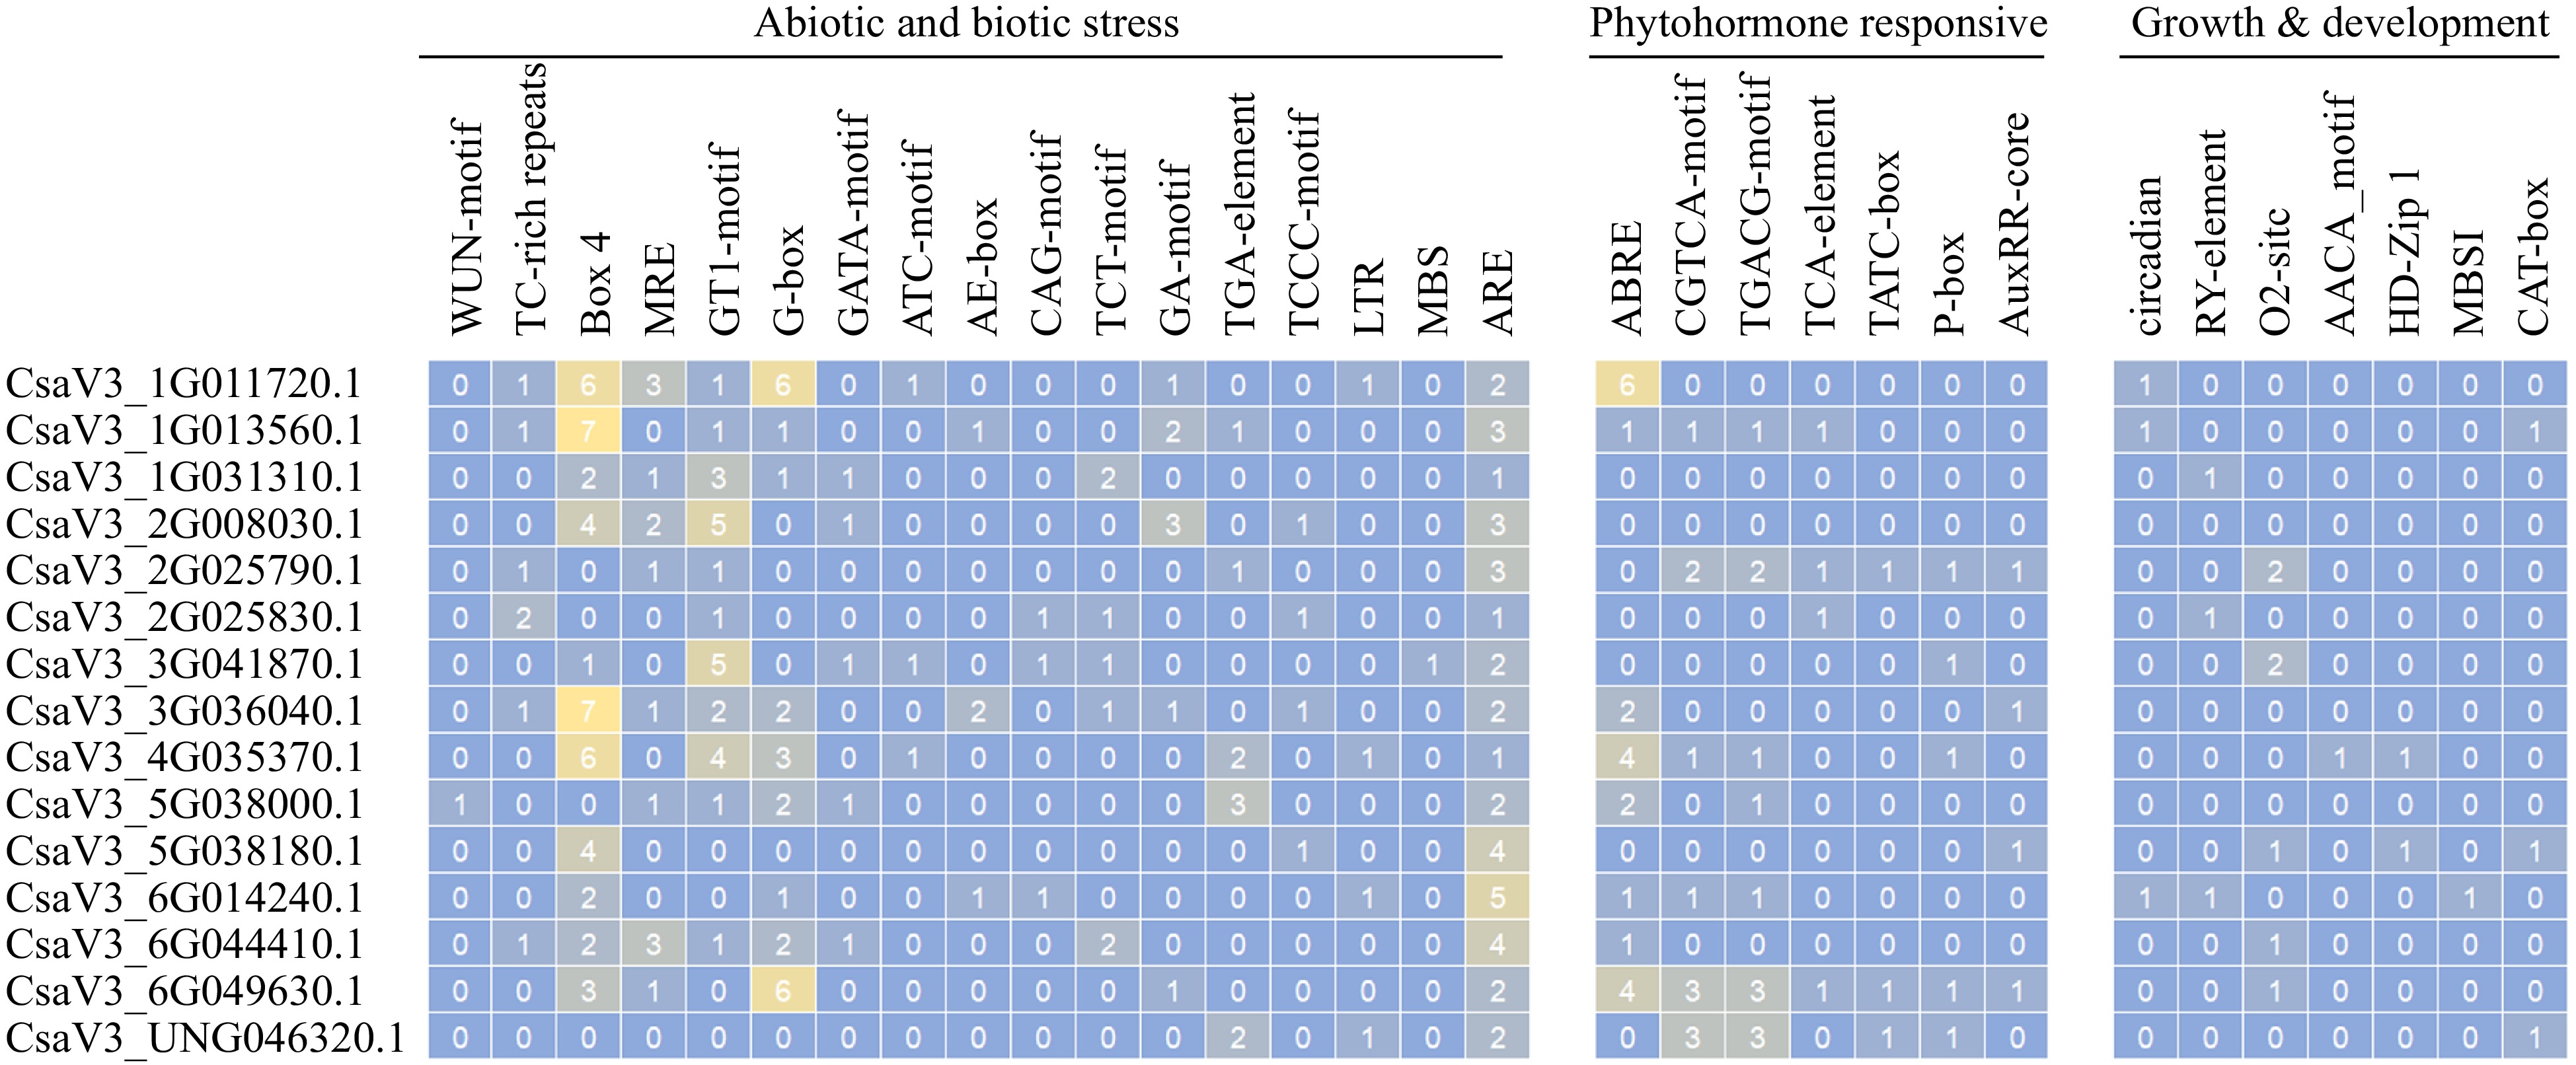
Figure 4.
Cis-acting elements on promotors of CsMYB36s.
-
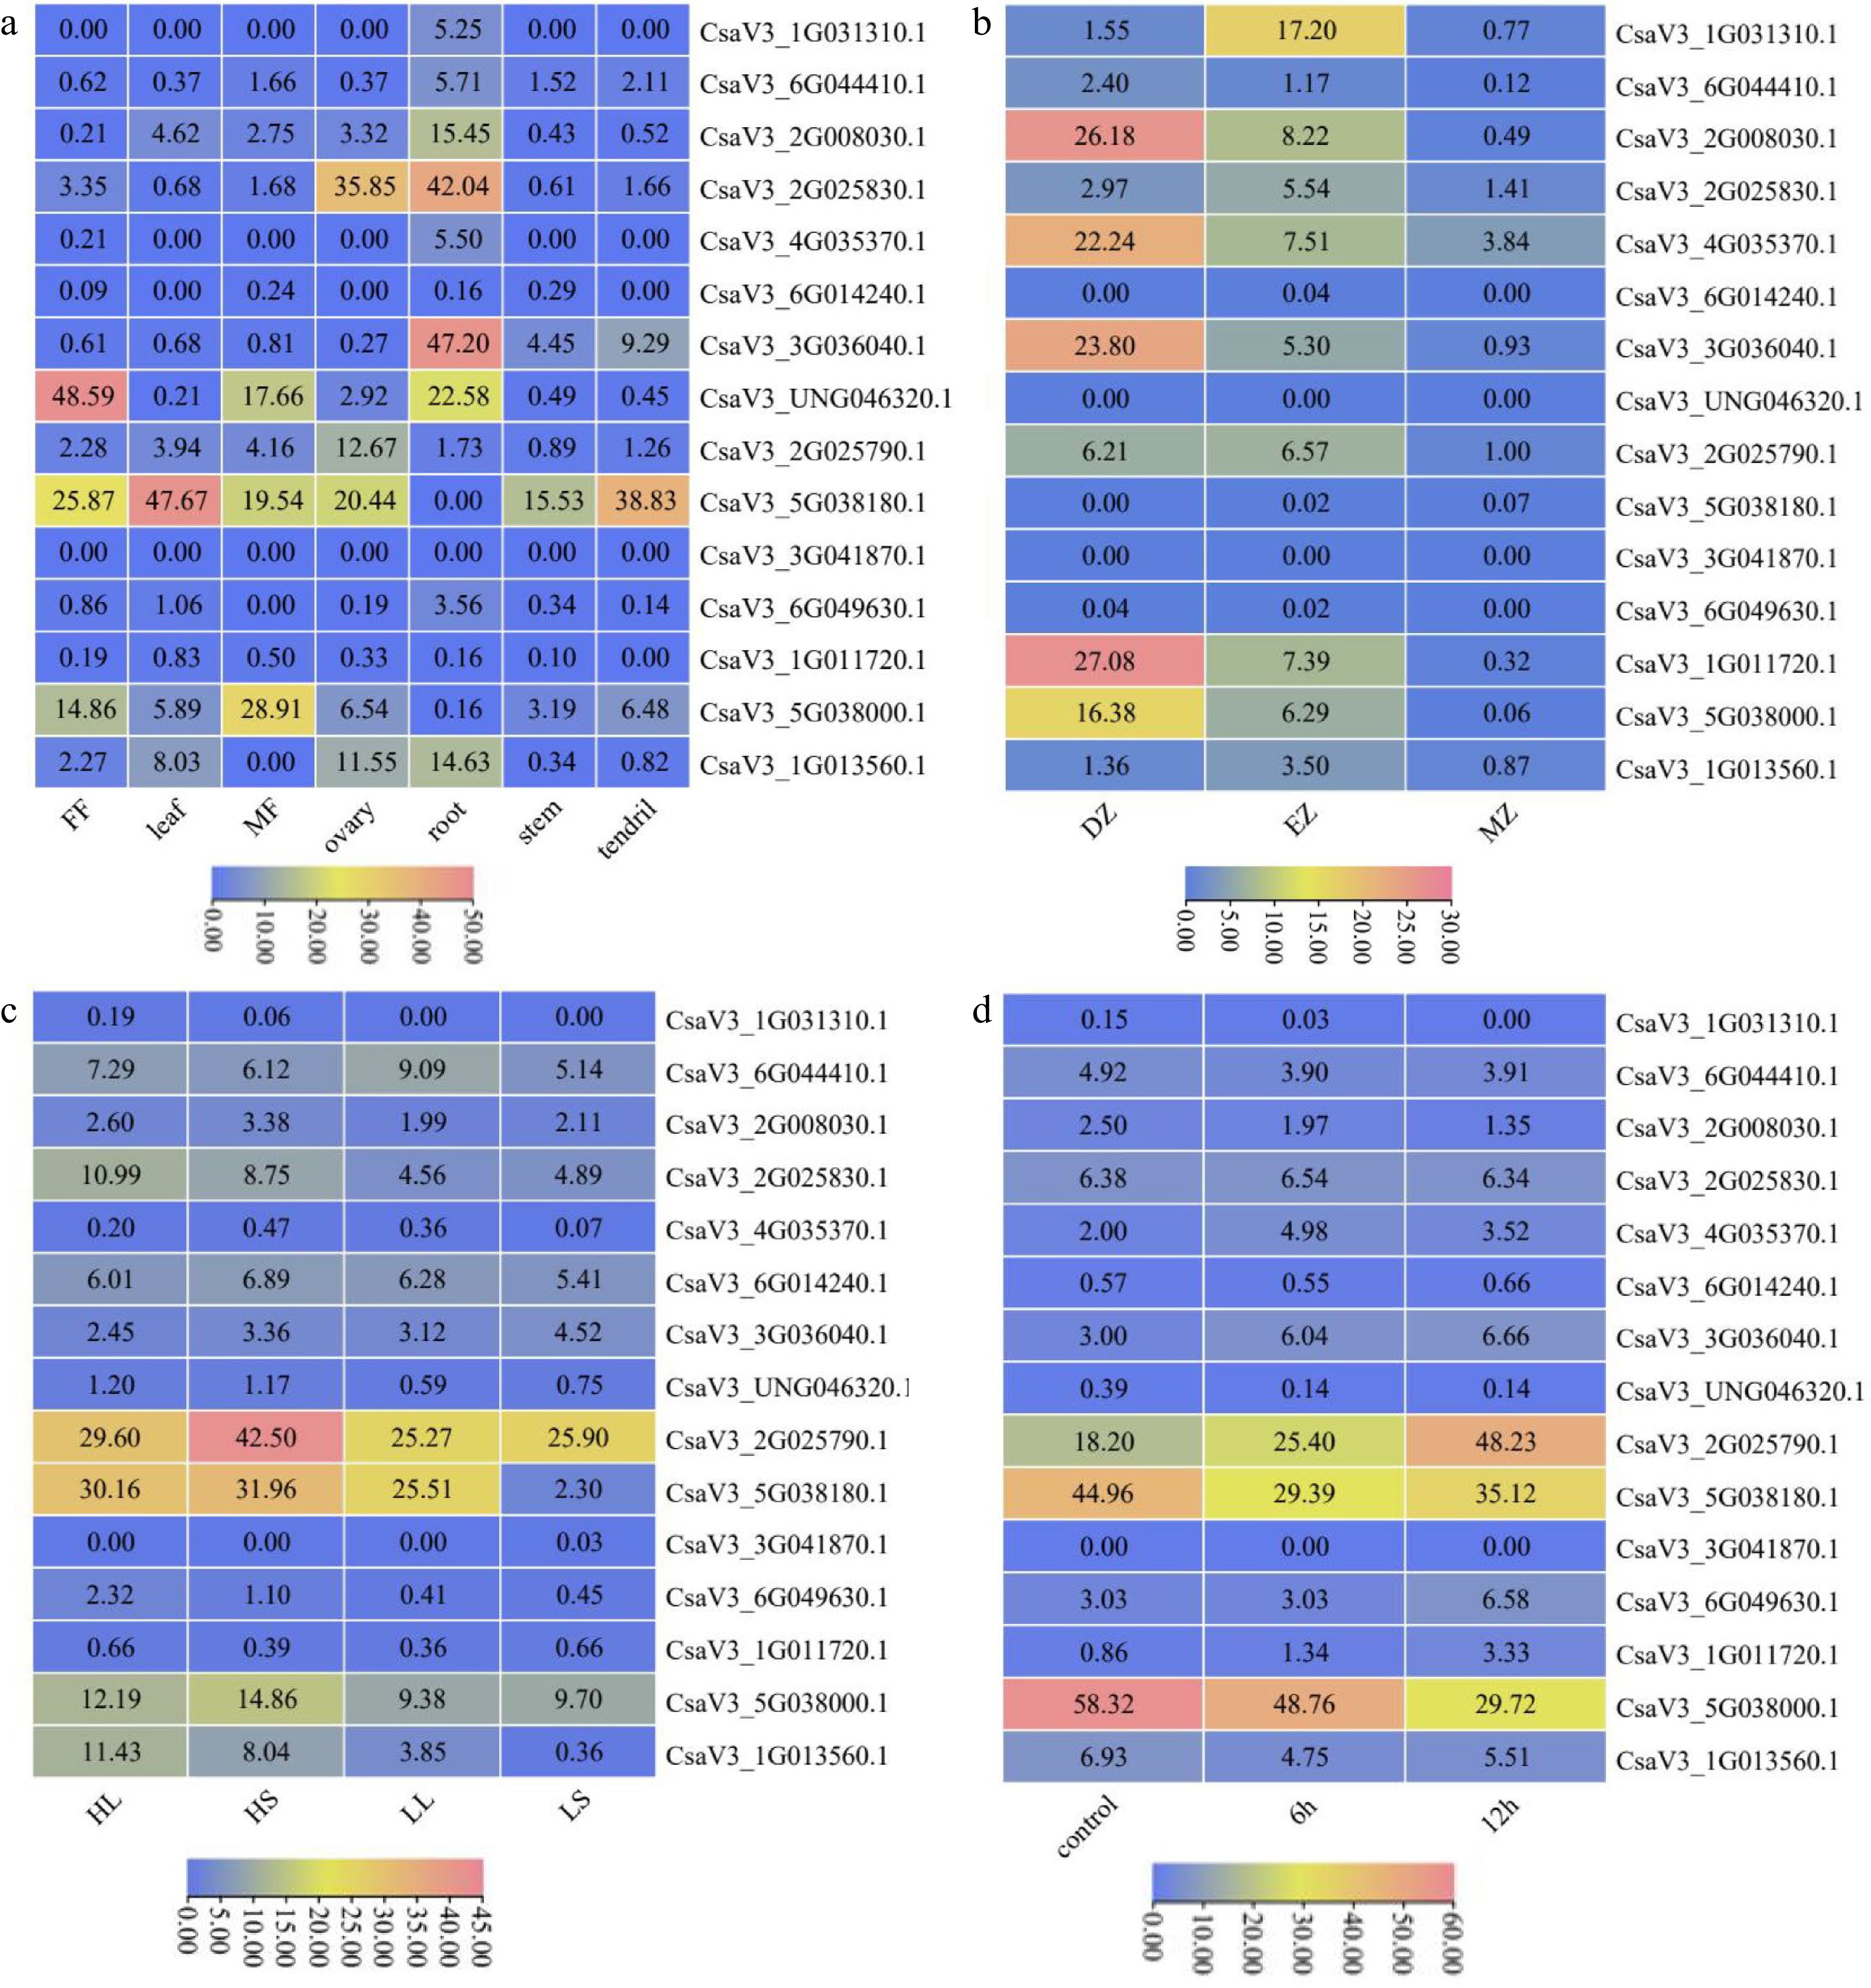
Figure 5.
Expression patterns of CsMYB36 genes. (a) Expression heatmap of CsMYB36s in different tissues of cucumber. (b) Expression heatmap of CsMYB36s under different temperature and photoperiod treatments. HighTemp, LongPhoto (HL); HighTemp, ShortPhoto (HS); LowTemp, LongPhoto (LL); LowTemp, ShortPhoto (LS). (c) Expression heatmap of CsMYB36s in different root zones. Root differentiation zone (DZ); root elongation zone (EZ); root meristematic zone (MZ). (d) Expression heatmap of CsMYB36s under different GA treatments. Cells were treated with GA at 6 h and 12 h.
-
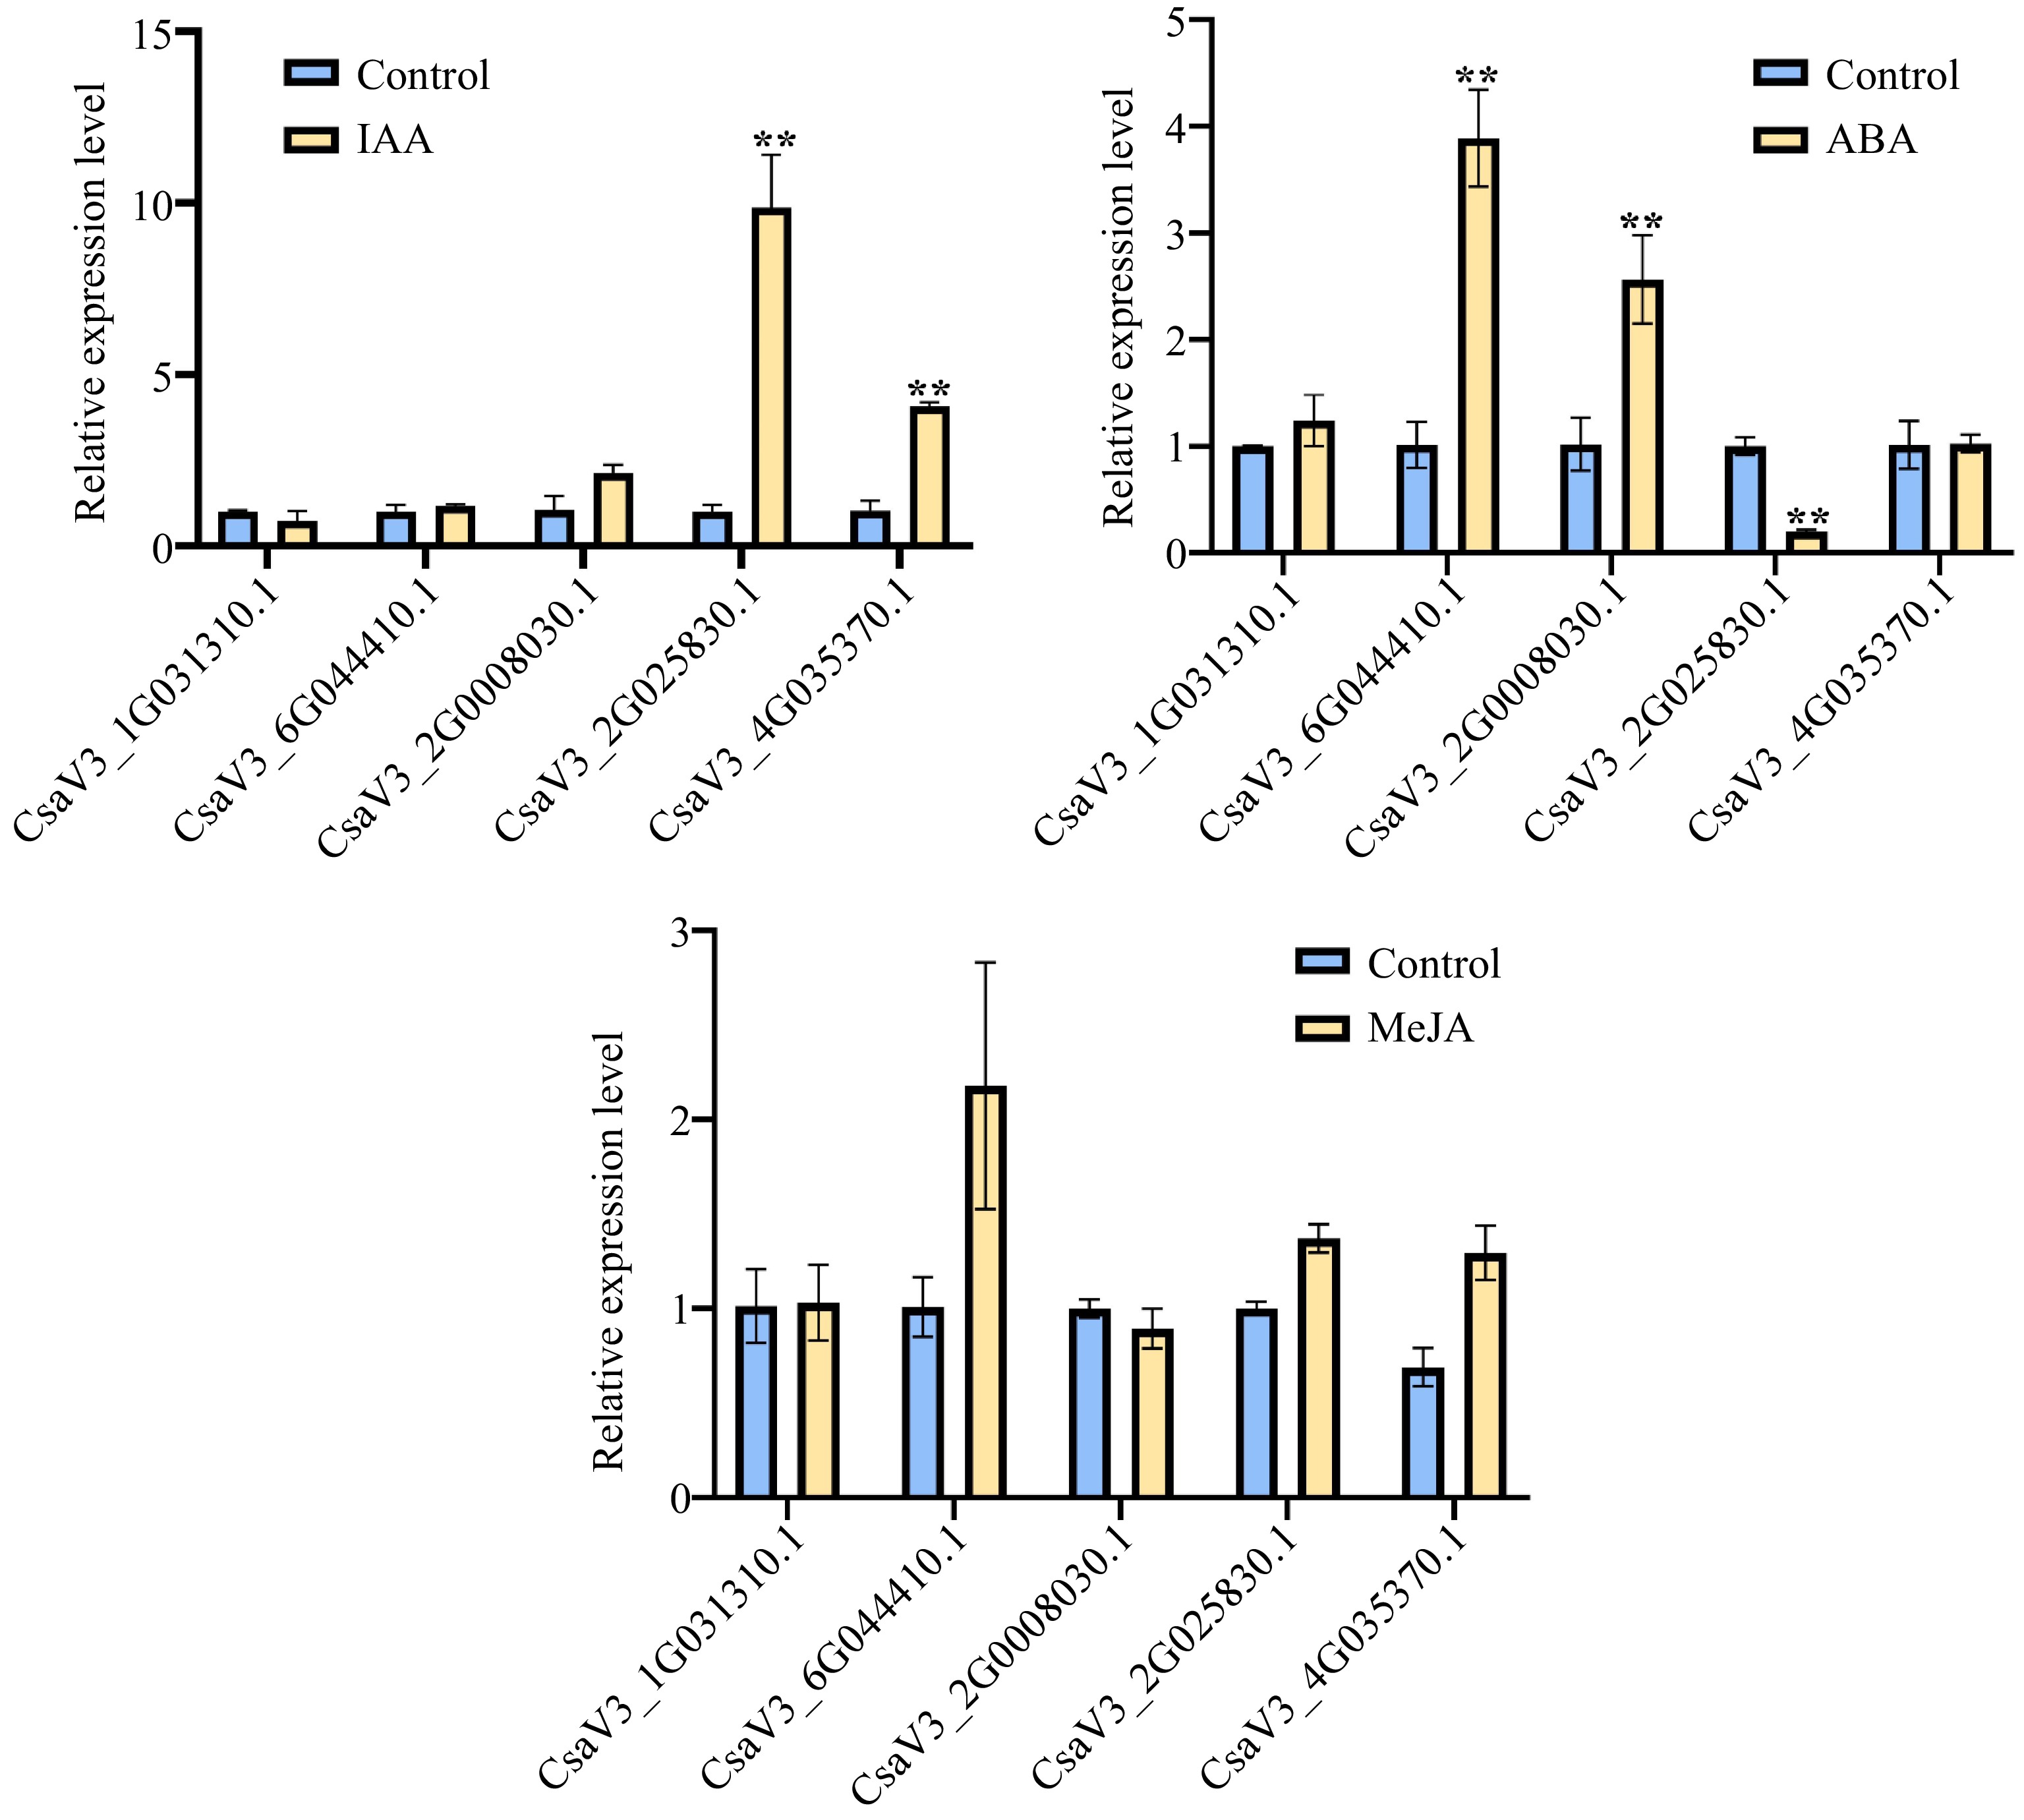
Figure 6.
Relative expression levels for CsMYB36s. (a) Relative expression levels of five cucumber CsMYB36s after 24 h 1 uM 3 Indoleacetic acid (IAA) treatment in cucumber seedlings by qRT -PCR analysis. (b) Relative expression levels of five cucumber CsMYB36s after 24 h 20 uM Abscisic acid (ABA) treatment in cucumber seedlings by qRT -PCR analysis. (c) Relative expression levels of five cucumber CsMYB36s gene after 24 h 0.5 uM Methyljasmonate (MeJA) treatment in cucumber seedlings by qRT-PCR analysis. Data are displayed using the CsActin as an internal control with three biological and three technical replicates. Values are the mean ± SD. Significant differences were observed between treatments (**P < 0.01; *P < 0.05, Student's t test).
-
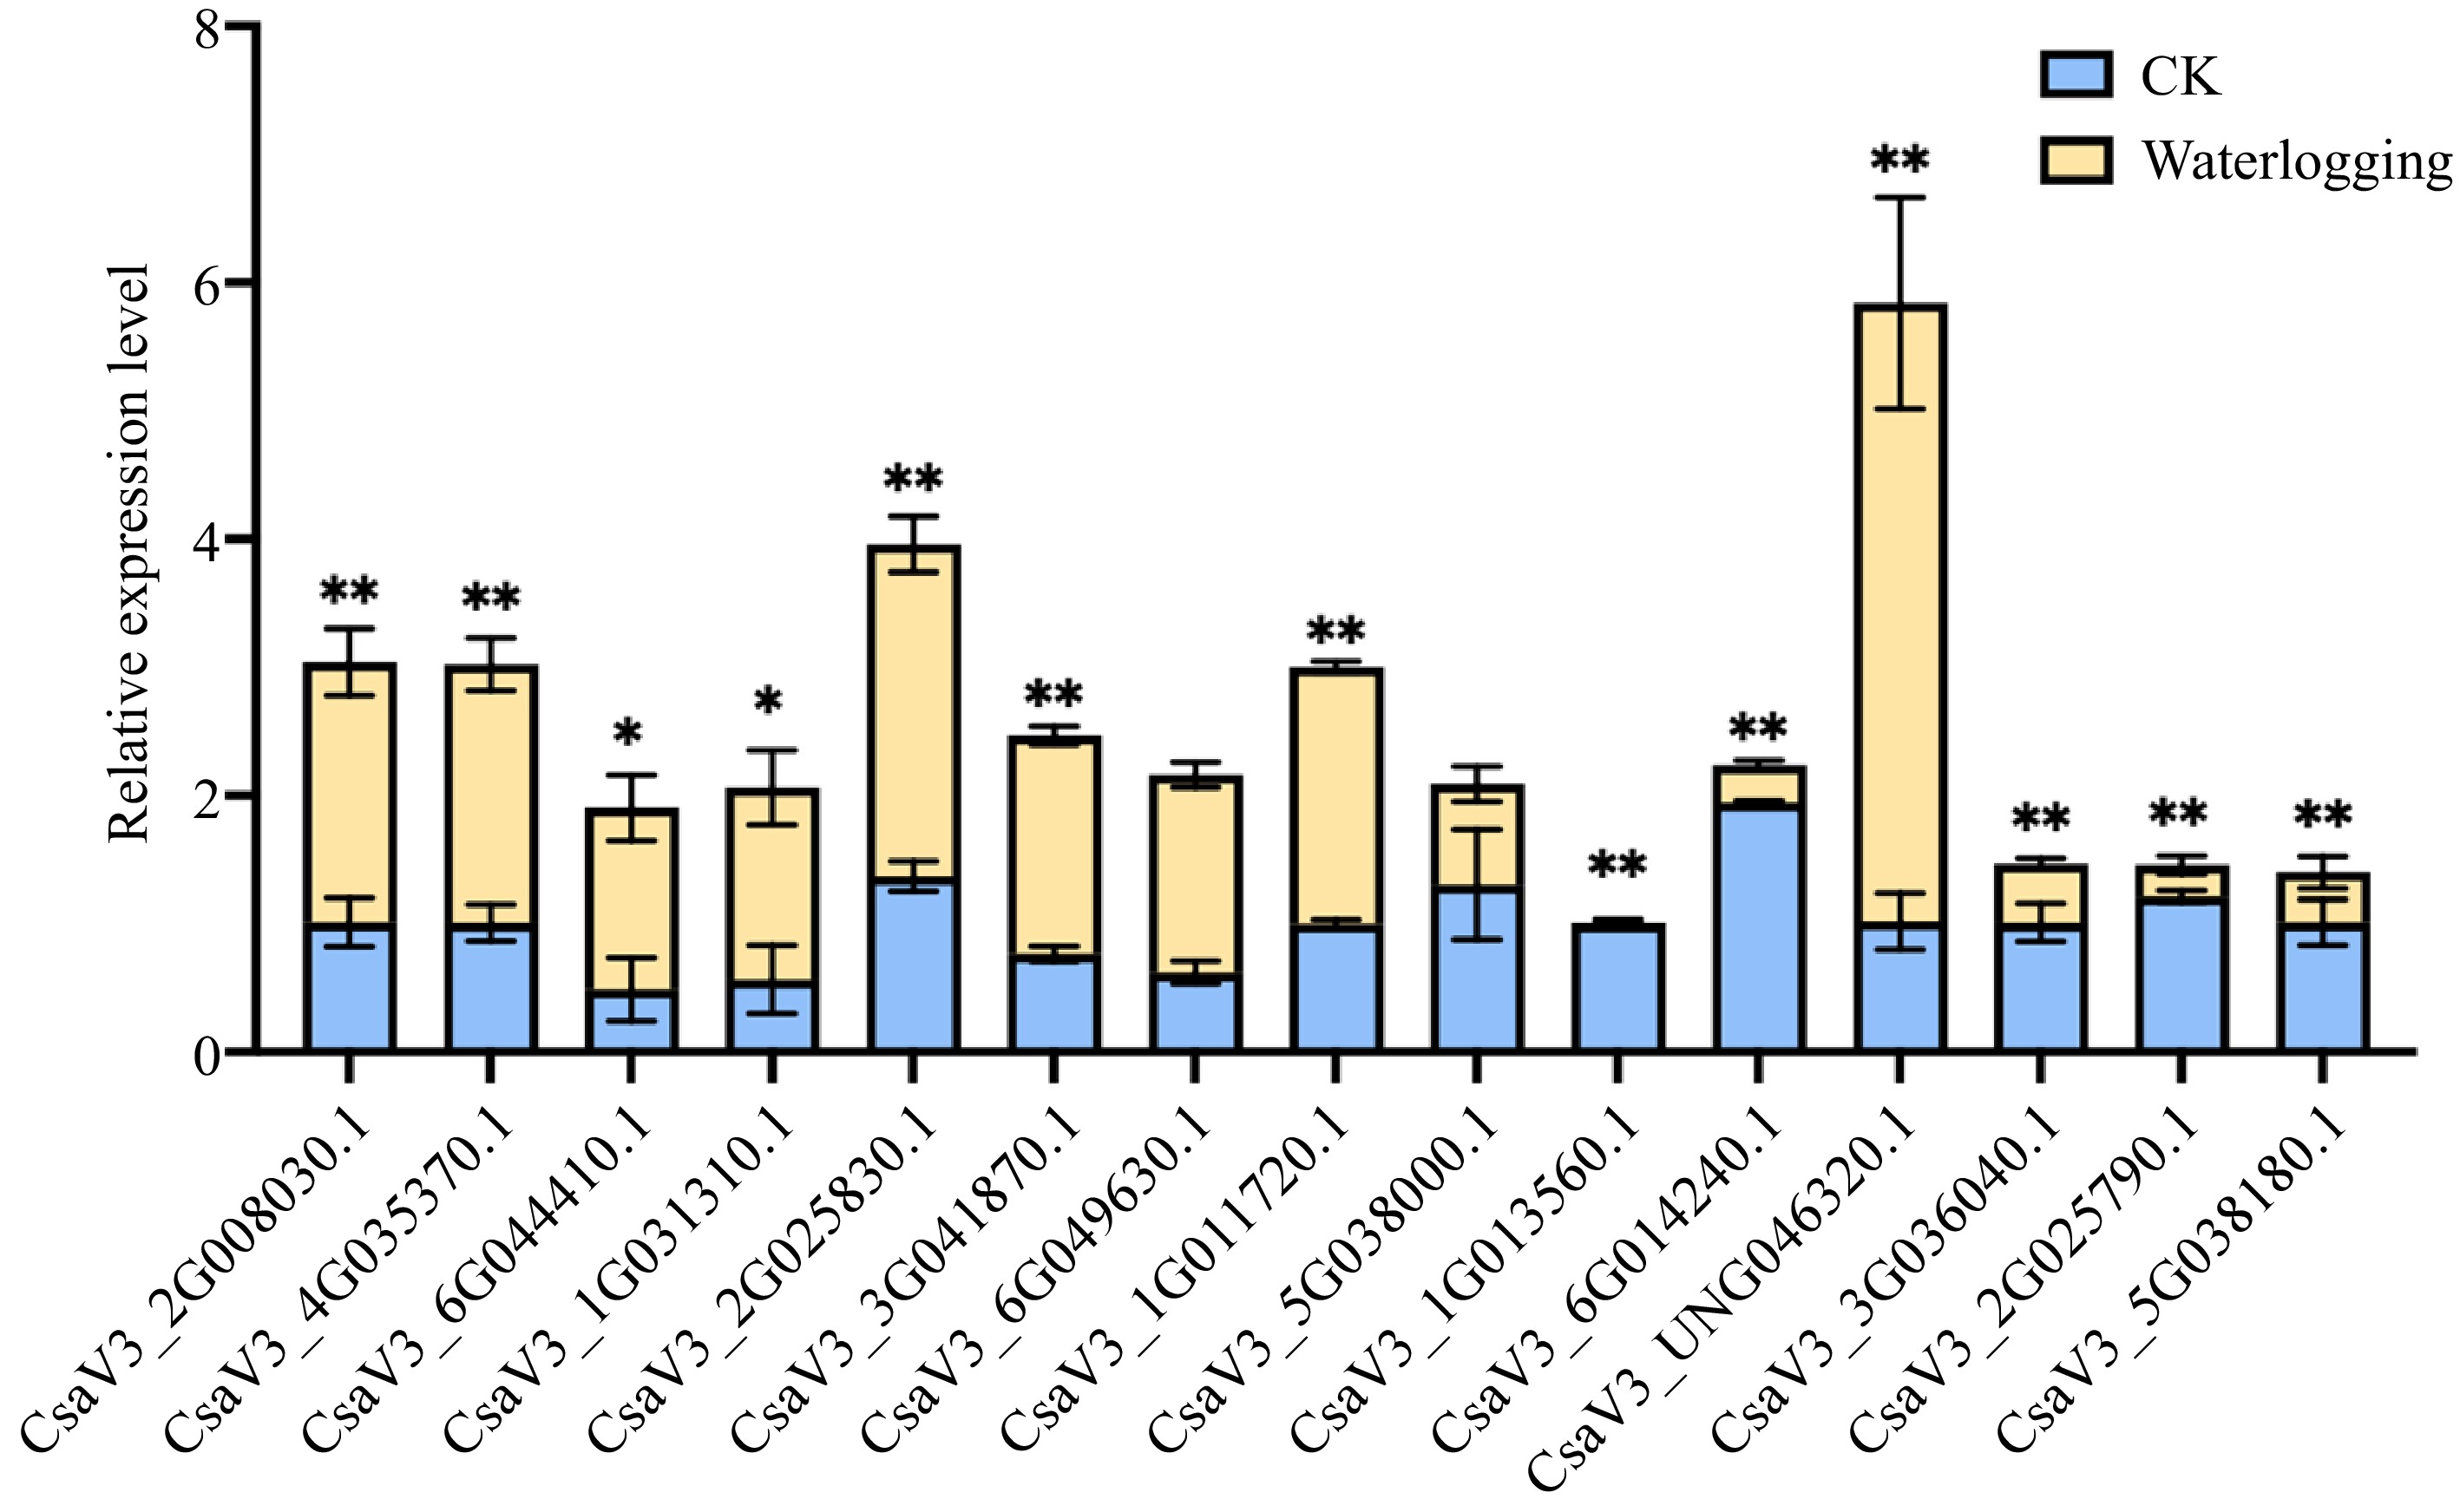
Figure 7.
Relative expression levels for CsMYB36s under waterlogging stress. Relative expression levels of CsMYB36s after 7 d waterlogging treatment in cucumber seedlings by qRT-PCR analysis. Data are displayed using CsActin as an internal control with three biological and three technical replicates. Values are mean ± SD. Significant differences were observed between treatments (**P < 0.01; *P < 0.05, Student's t test).
Figures
(7)
Tables
(0)