-
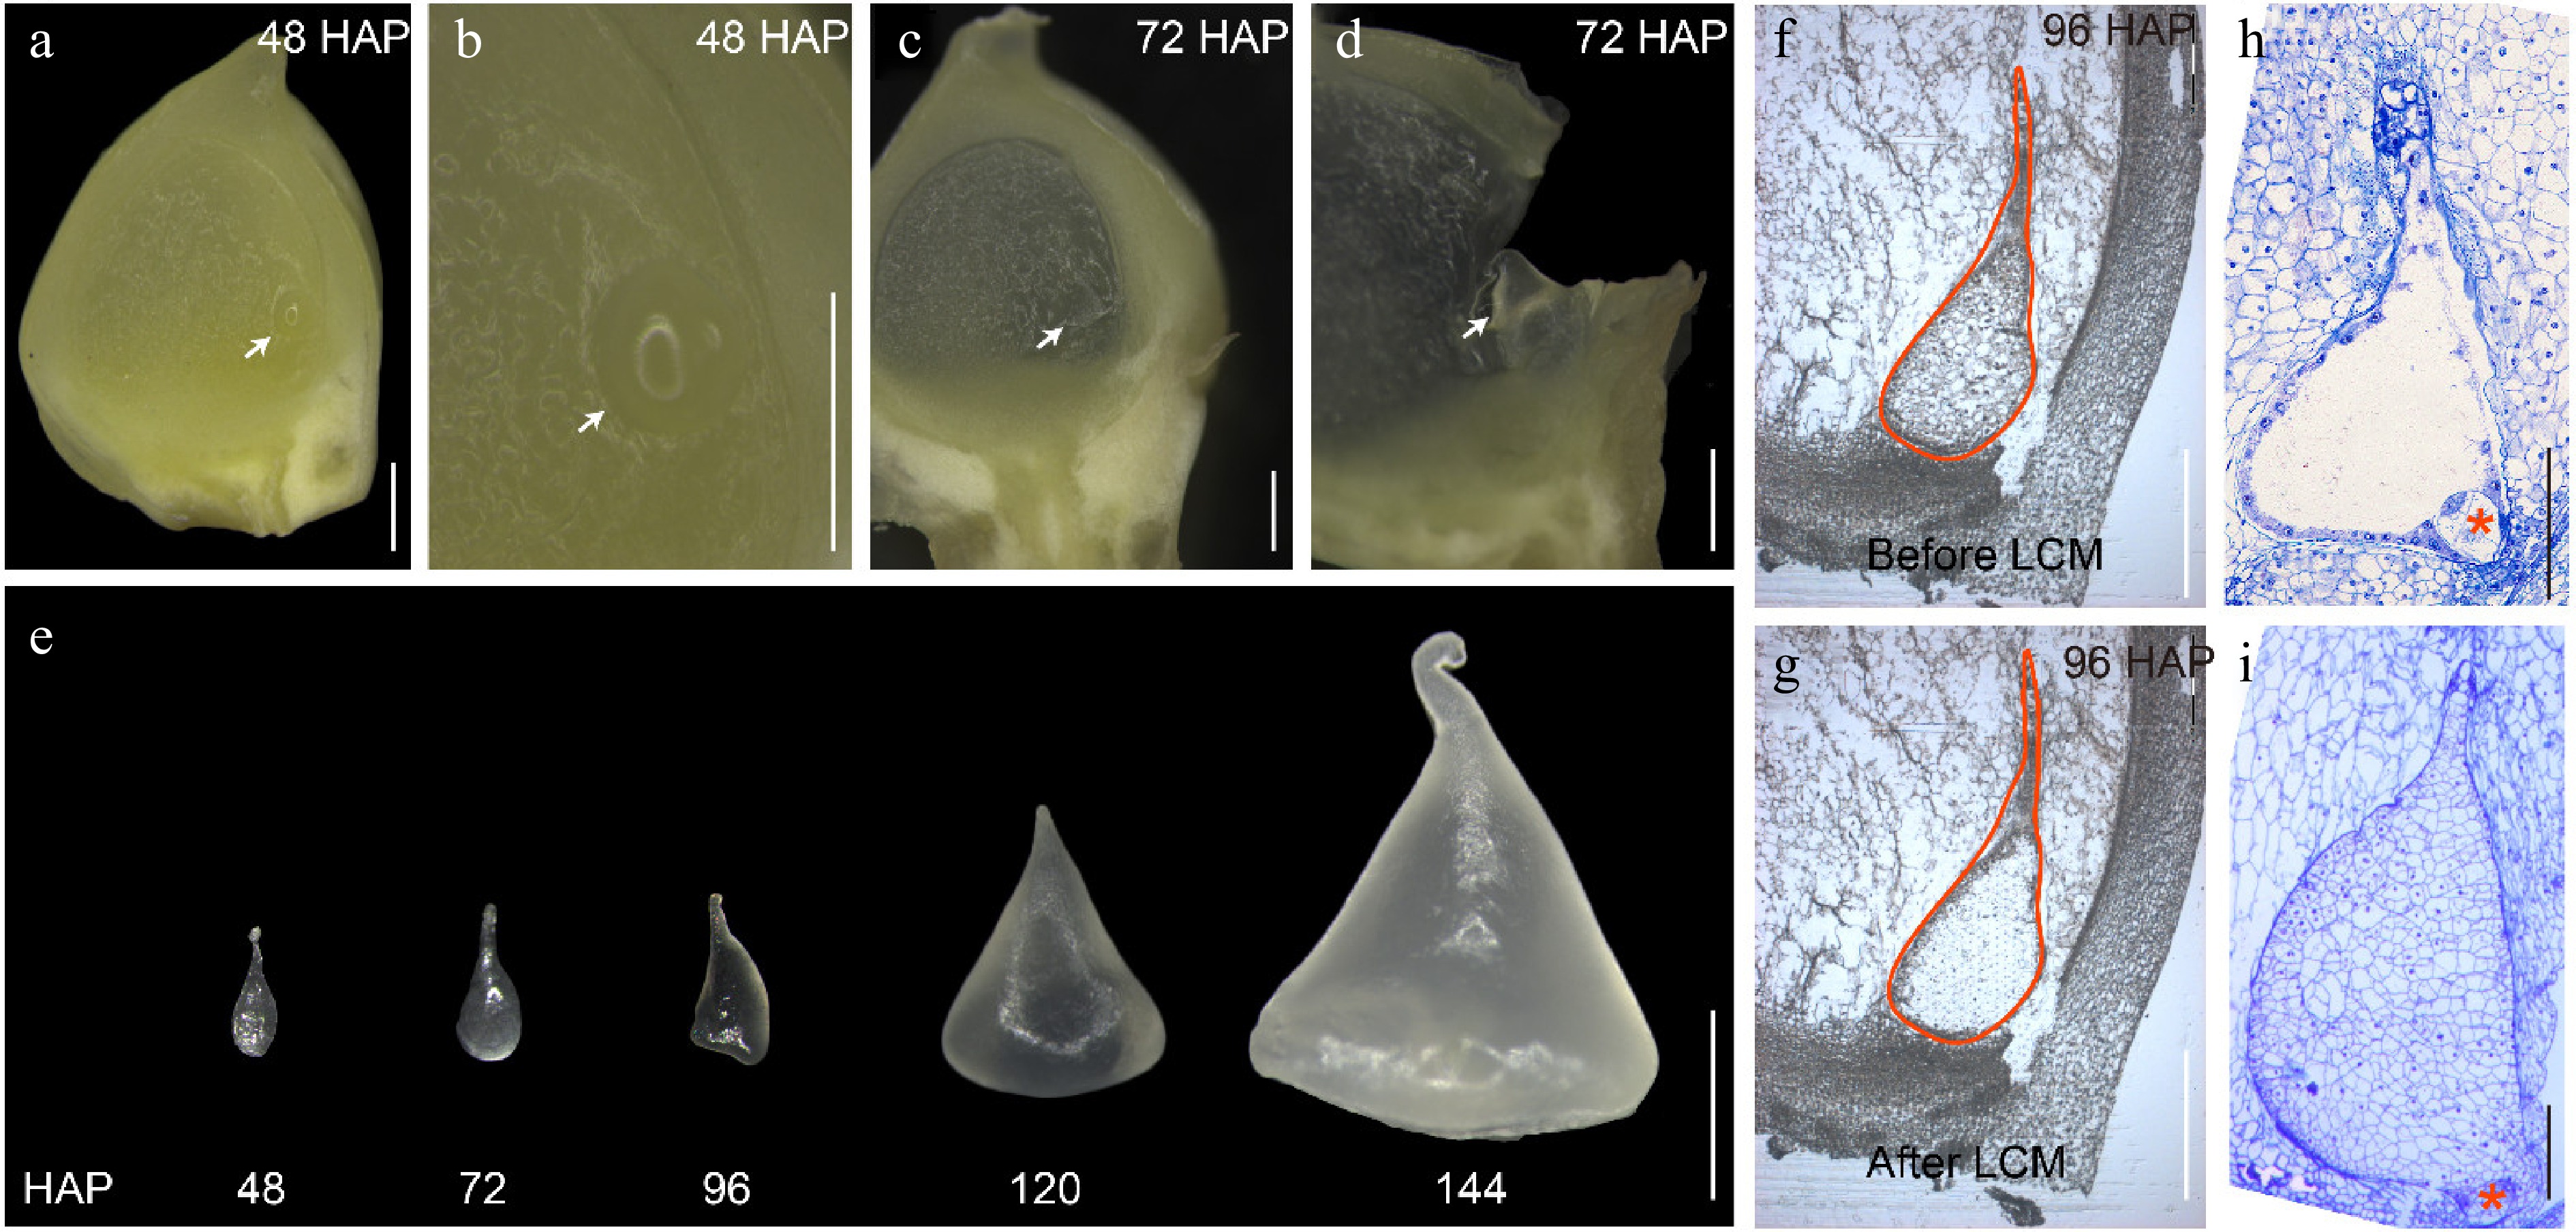
Figure 1.
Isolation of early endosperms from 48 to 144 HAP by free hand and LCM. (a) Longitudinal free-hand sectioning of a developing B73 kernel at 48 HAP. (b) The enlarged area containing the endosperm as shown in (a) by an arrow. (c) Longitudinal free-hand sectioning of a developing B73 kernel at 72 HAP. (d) The enlarged area containing the endosperm as shown in (c) by an arrow. (e) Isolated endosperms from 48 to 144 HAP by free hand. (f) The endosperm at 96 HAP before LCM. (g) The endosperm at 96 HAP after LCM. (h) Light microscopy of semi-thin sections of developing B73 endosperm at 48 HAP. (i) Light microscopy of semi-thin sections of developing B73 endosperm at 96 HAP. The endosperms are indicated by white arrows. The embryo is indicated by a red asterisk. Bars = 500 μm in (a)−(d), (f), and (g). Bar = 1 mm in (e). Bars = 200 μm in (h) - (i).
-
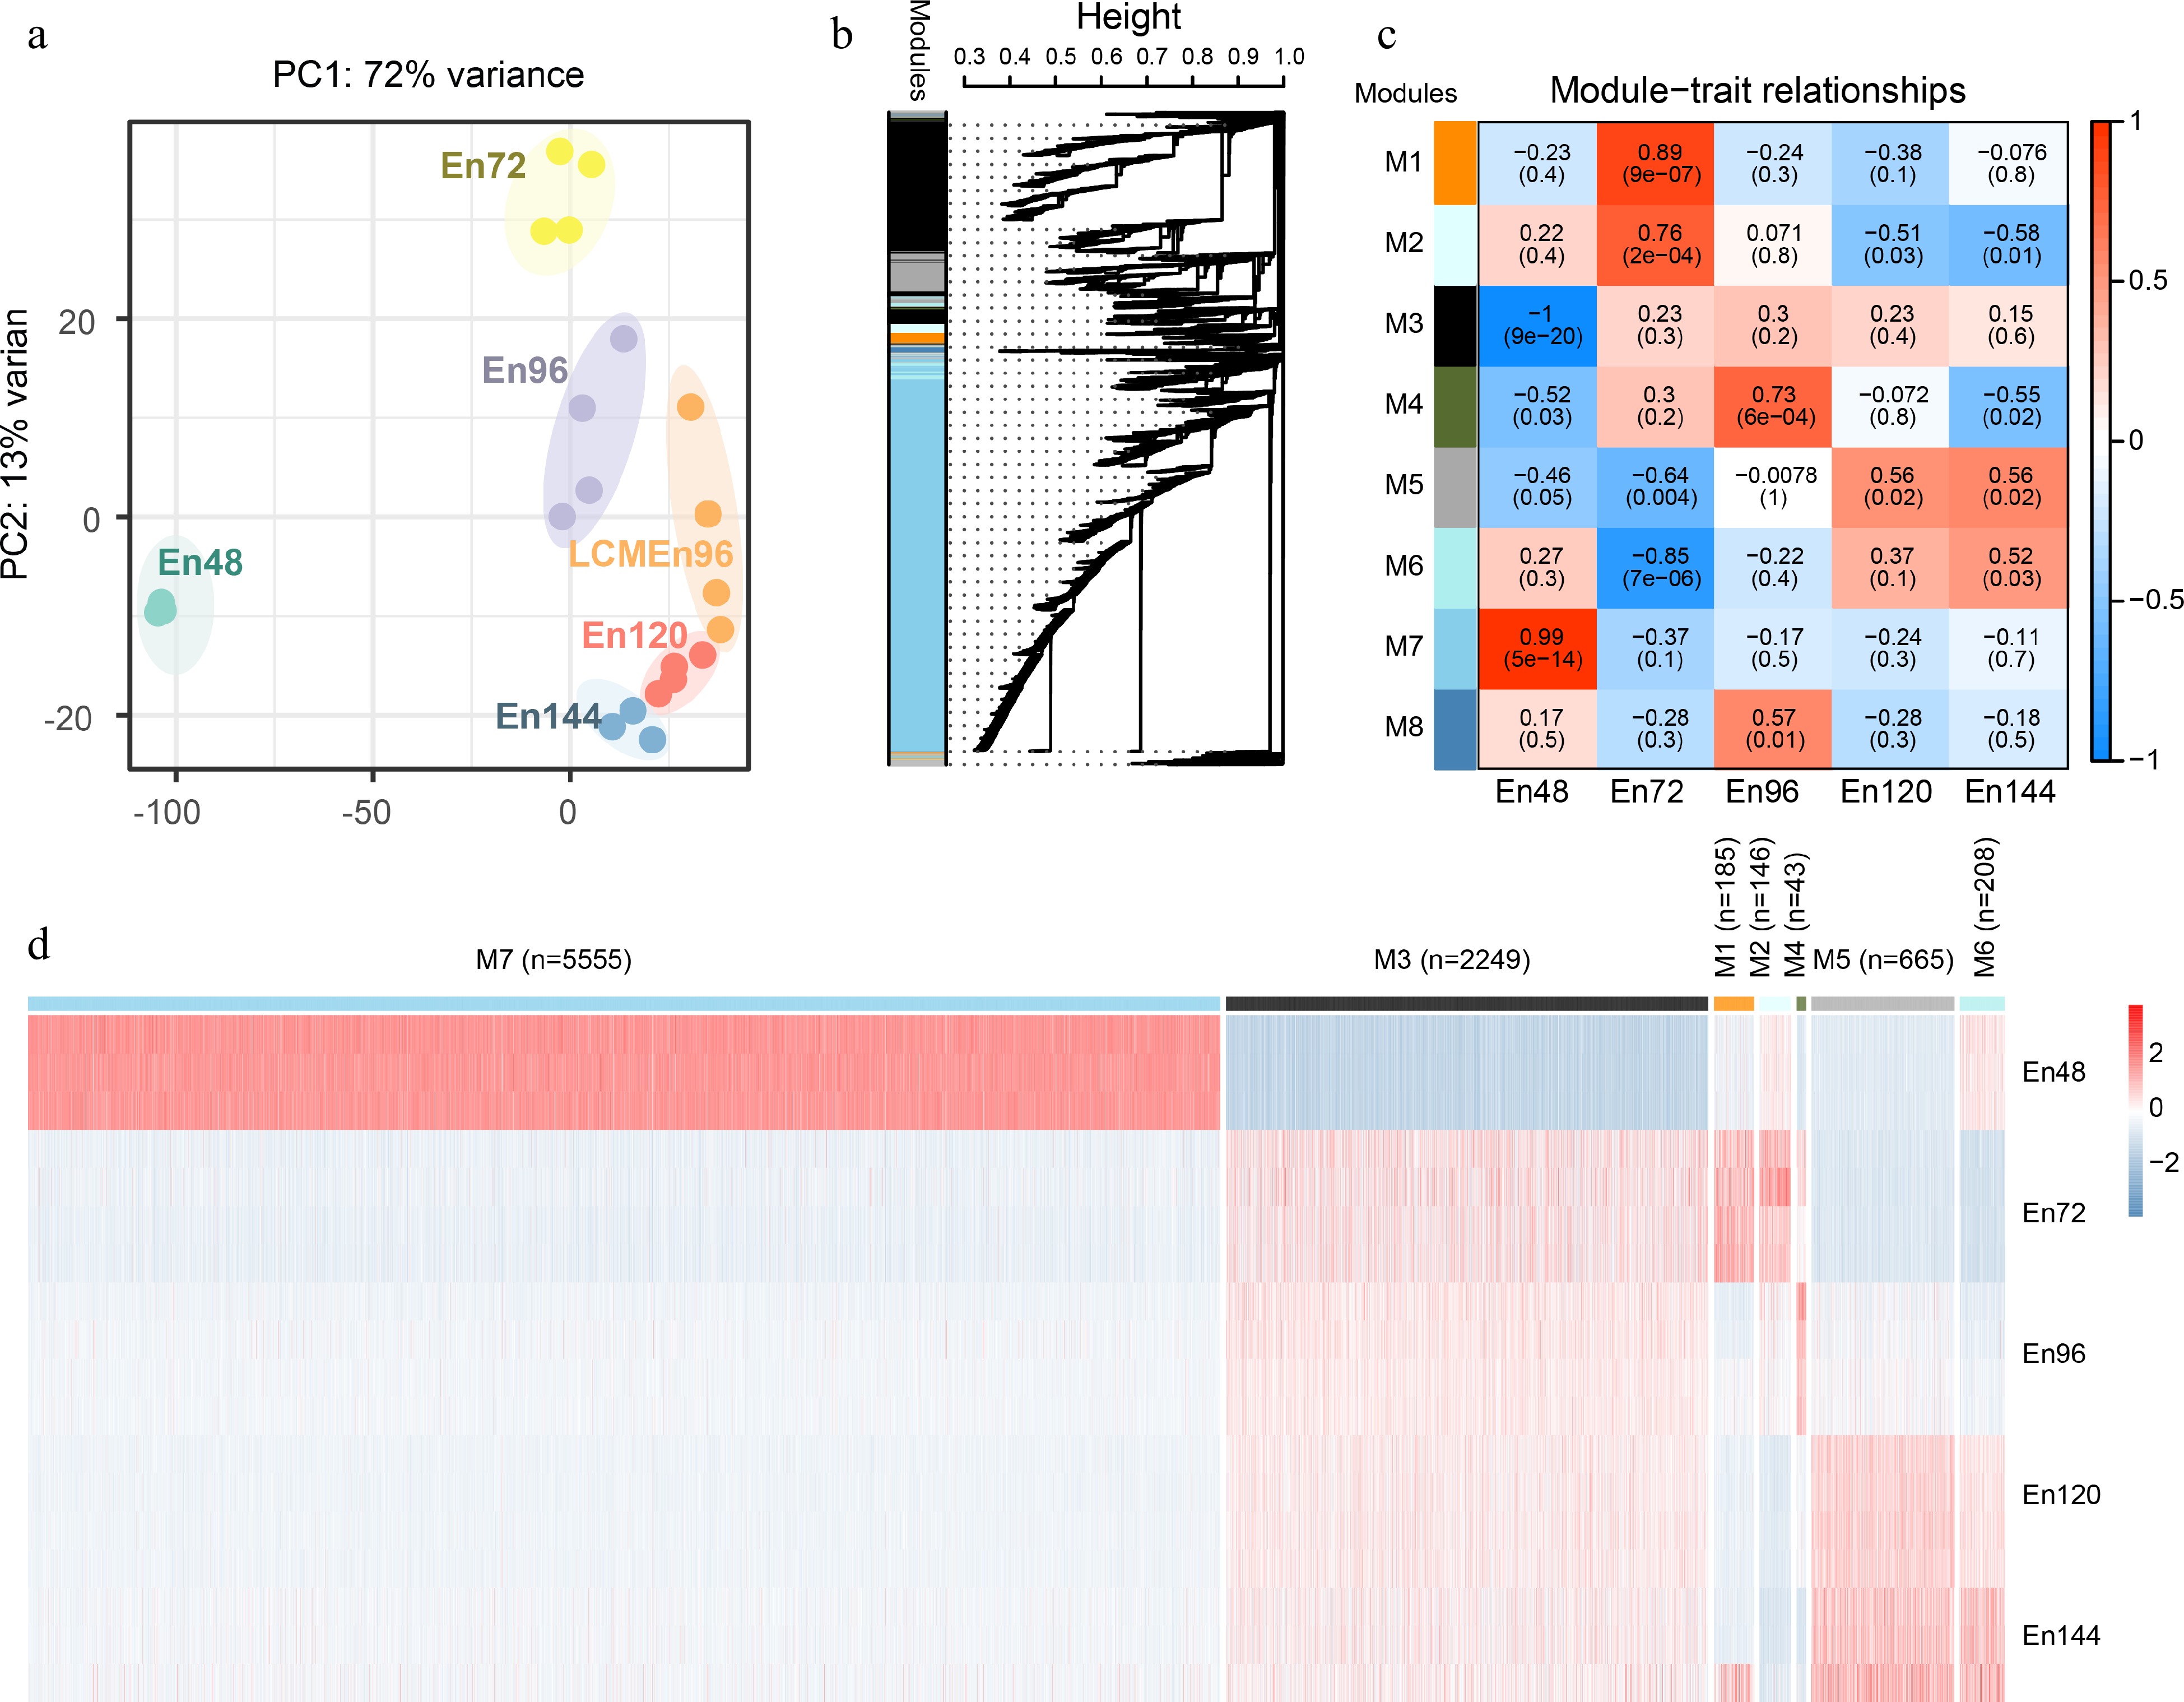
Figure 2.
Global analyses of the transcriptome of early endosperms. (a) Principal component analysis of the transcriptome of early endosperms. (b) WGCNA cluster dendrogram showing co-expression modules identified in 15 samples at five different stages. Modules corresponding to branches are assigned to distinct colors. (c) Correlations between modules and development stages. The correlation is estimated by the Pearson correlation coefficient method. (d) A heatmap showing the spatiotemporal expression pattern of seven stage-specific modules covering all tested stages.
-

Figure 3.
The specific expression gene cluster at coenocytic stage. (a) Violin plots showing the dynamic expression of Module 7 gene groups in all tested stages. (b) Comparison of downregulated genes between En144/En48, En72/En48 and Module 7 gene groups. (c) Comparison of genes between Module 7 gene groups and the public RNA-seq data[10]. (d) GO term enrichment analysis of the CE Gene Set. (e) Network of six Hub TFs with regulating genes in CE Gene Set. Color codes indicate the degree of the nodes. plum, 6 Hub TFs; orange, degree ranked 1st; green, degree ranked 2nd; pink, degree ranked 6th.
-

Figure 4.
Expression patterns of genes representing the enrichment GO terms and functional transition over the time course. GO analysis of the specifically expressed genes in each module. The expression patterns of the genes belonging to representative enrichment GO terms were shown.
-
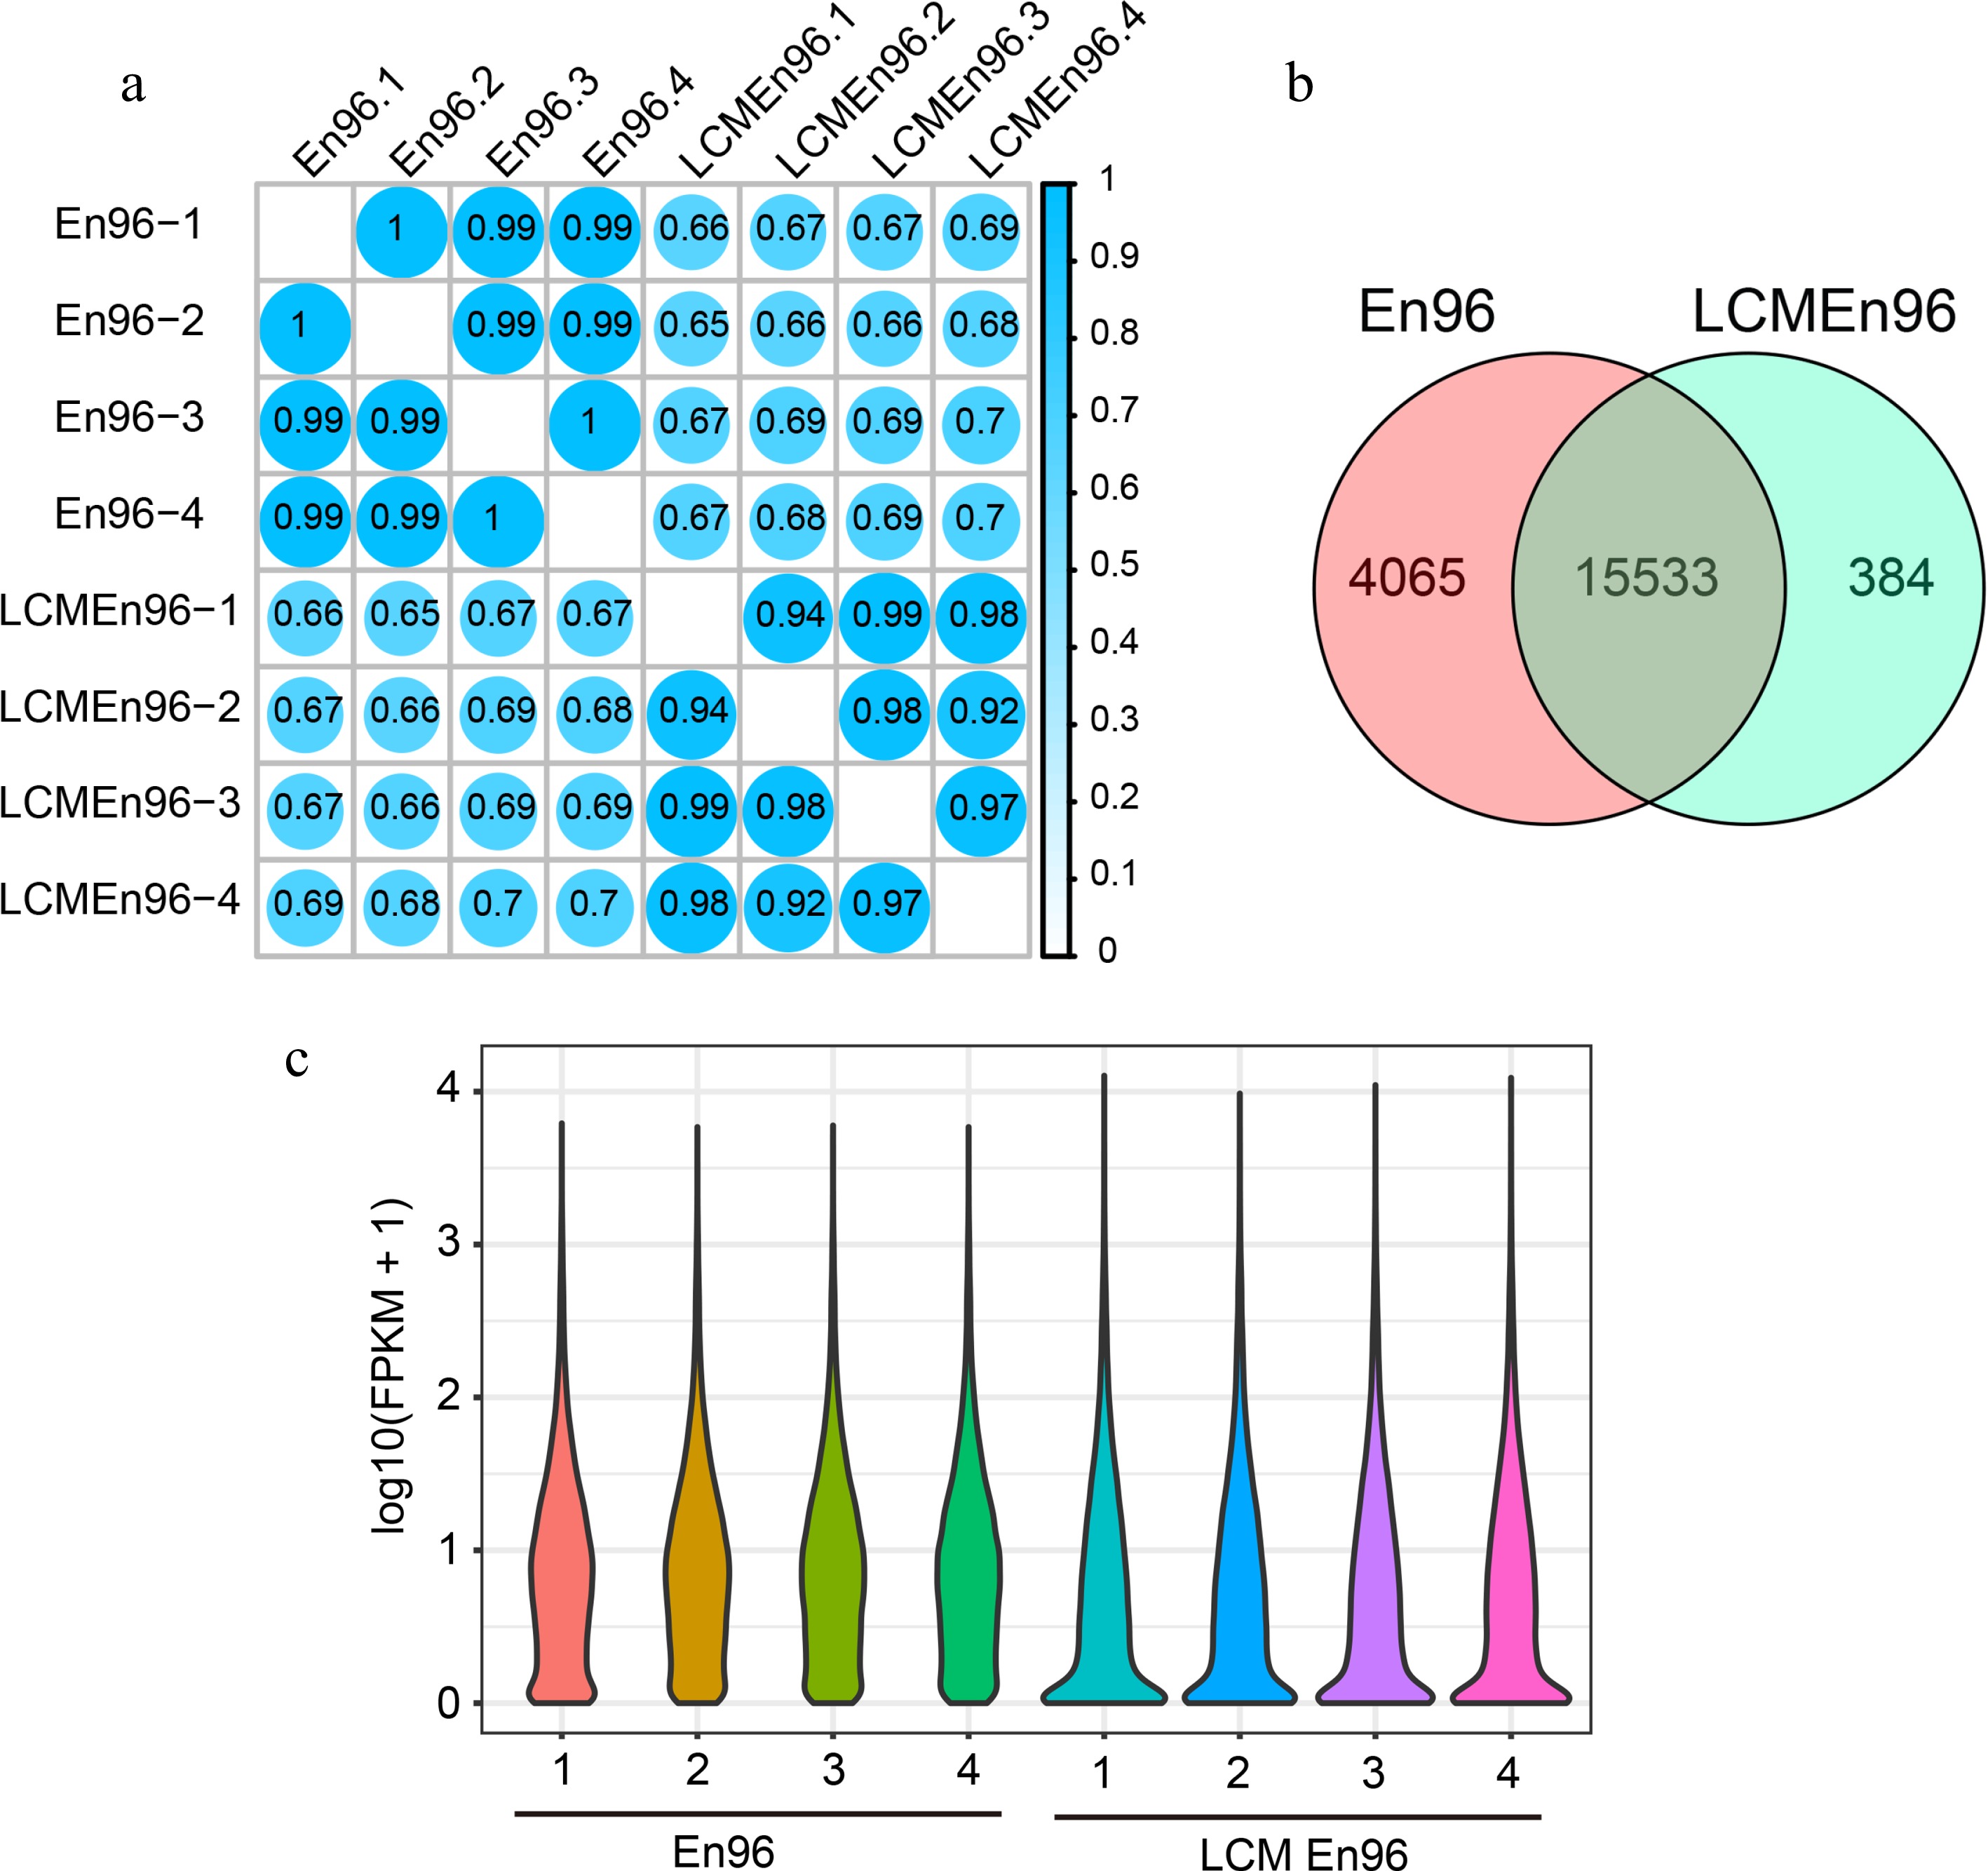
Figure 5.
Comparison of expressive gene sets between En96 and LCMEn96. (a) SCC analysis of the mRNA data for En96 and LCMEn96 using log2-transformed FPKM values. (b) Comparison of expressive genes between En96 and LCMEn96. (c) Violin plots showing the dynamic expression of genes in En96 and LCMEn96. The numbers at the horizontal axis represent the four replicates of each sample.
-
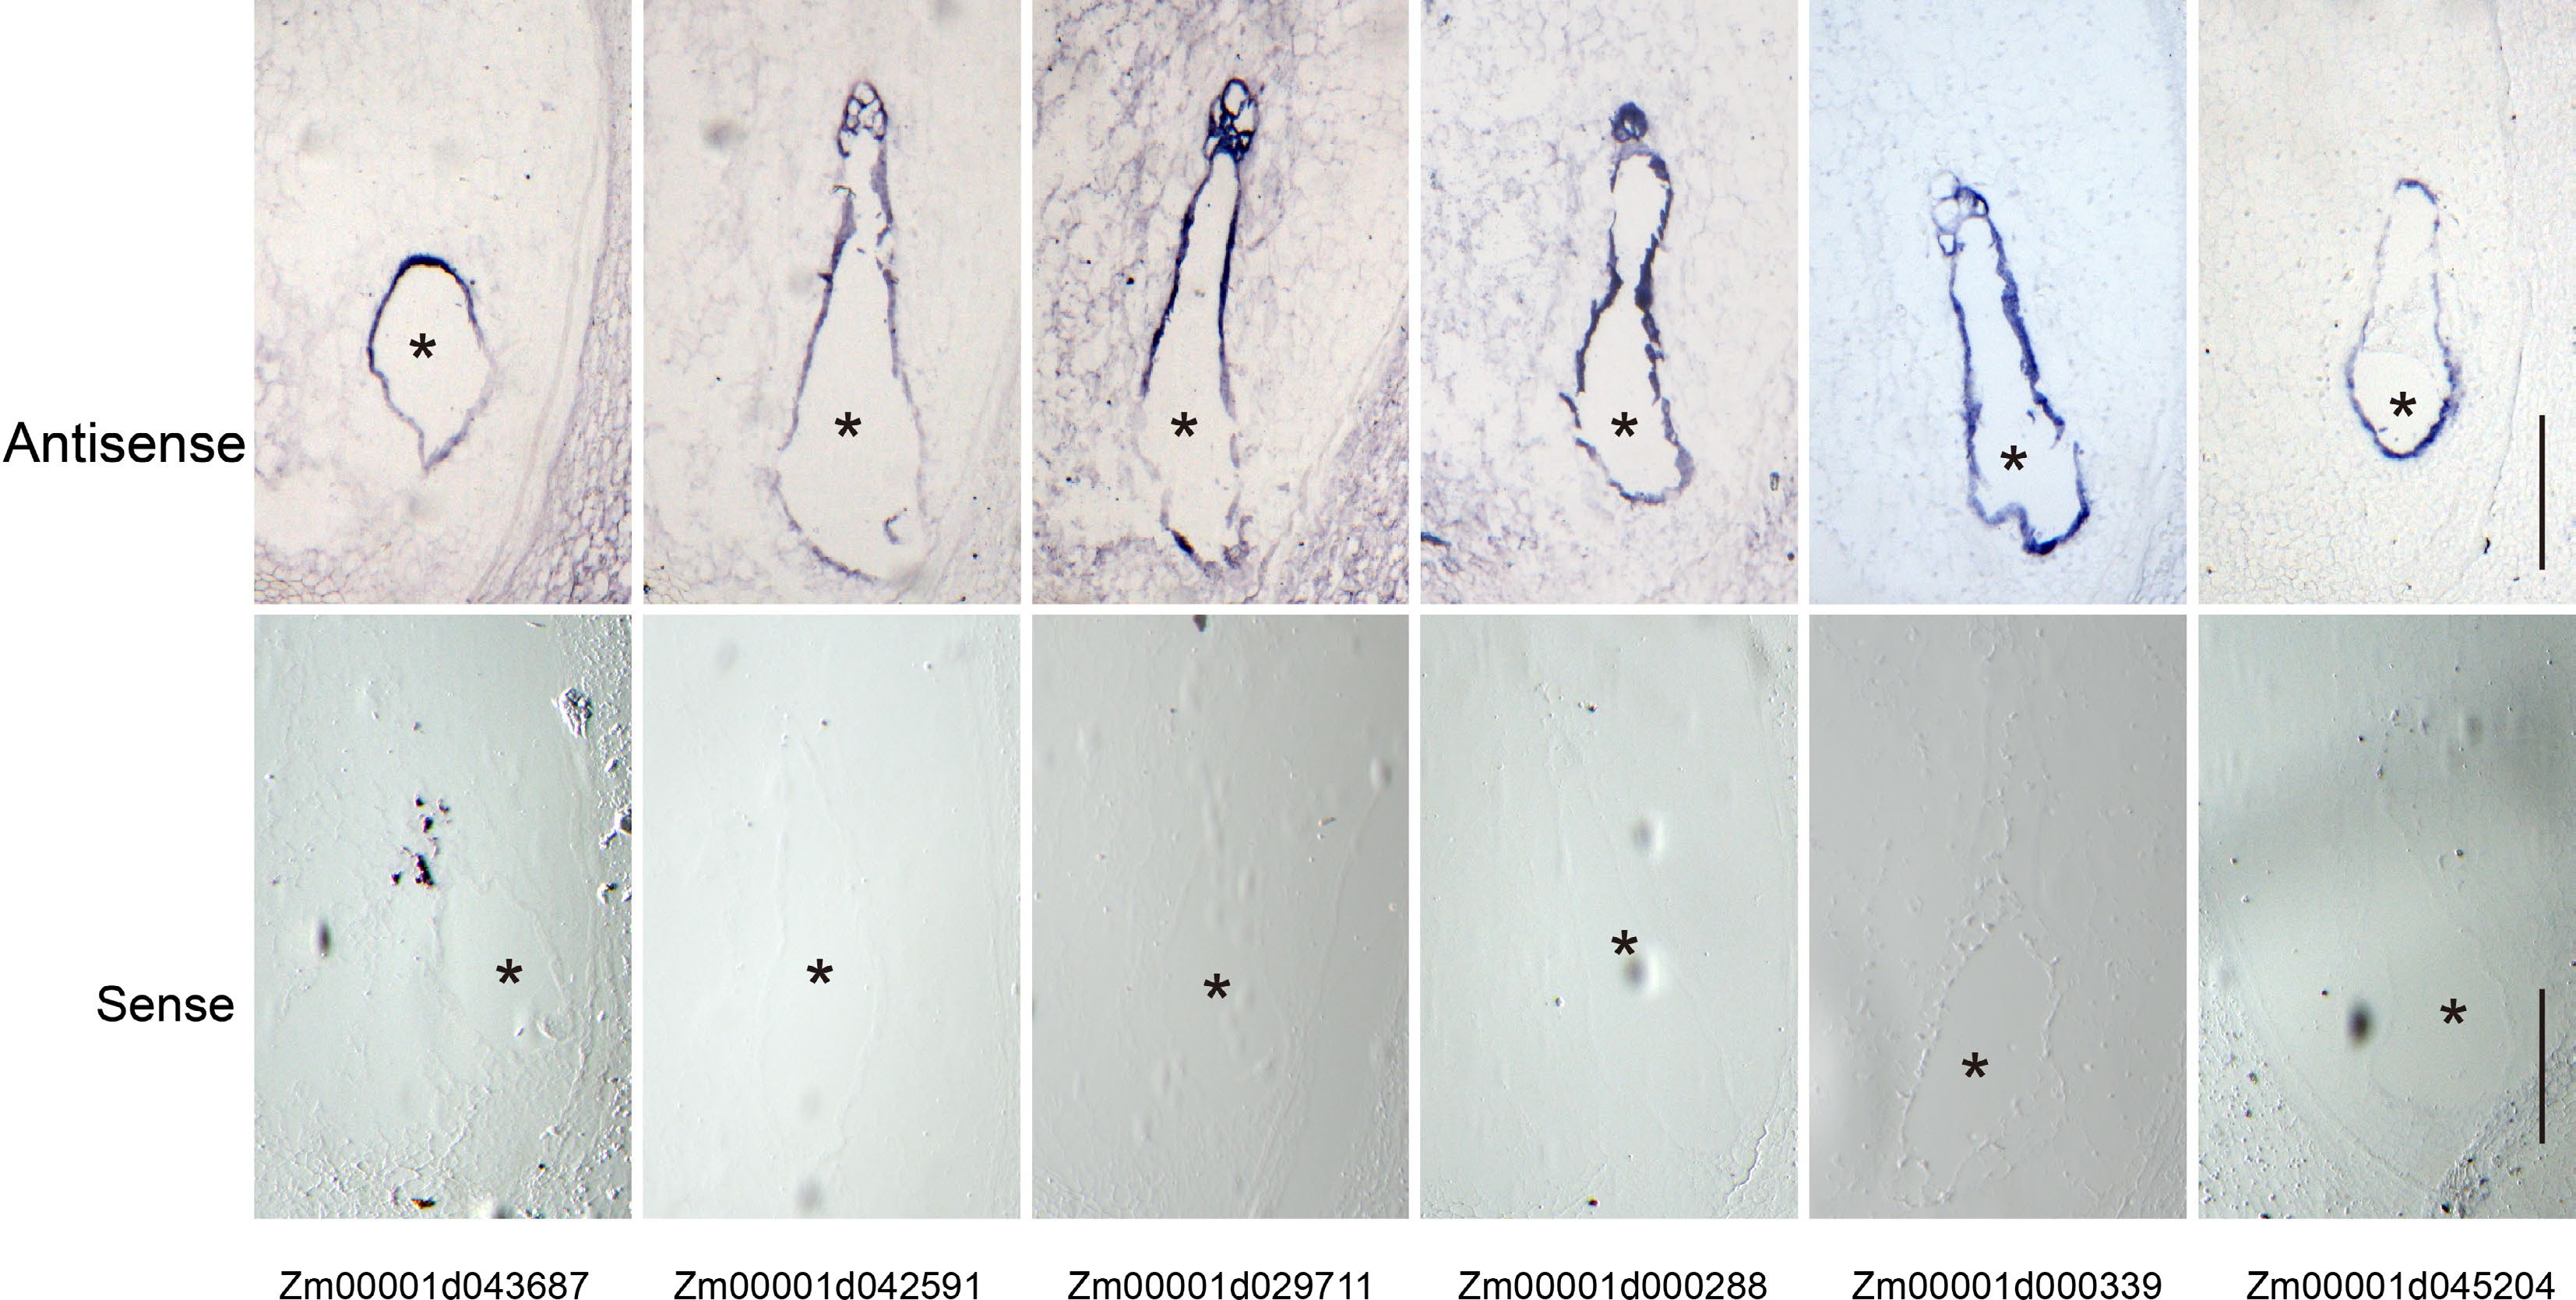
Figure 6.
Validation of the coenocyte-specific genes using in situ hybridization. Upper panel, hybridization with antisense probes; lower panel, hybridization with sense probes. Bar = 200 μm. The endosperms are indicated by black asterisks.
Figures
(6)
Tables
(0)