-
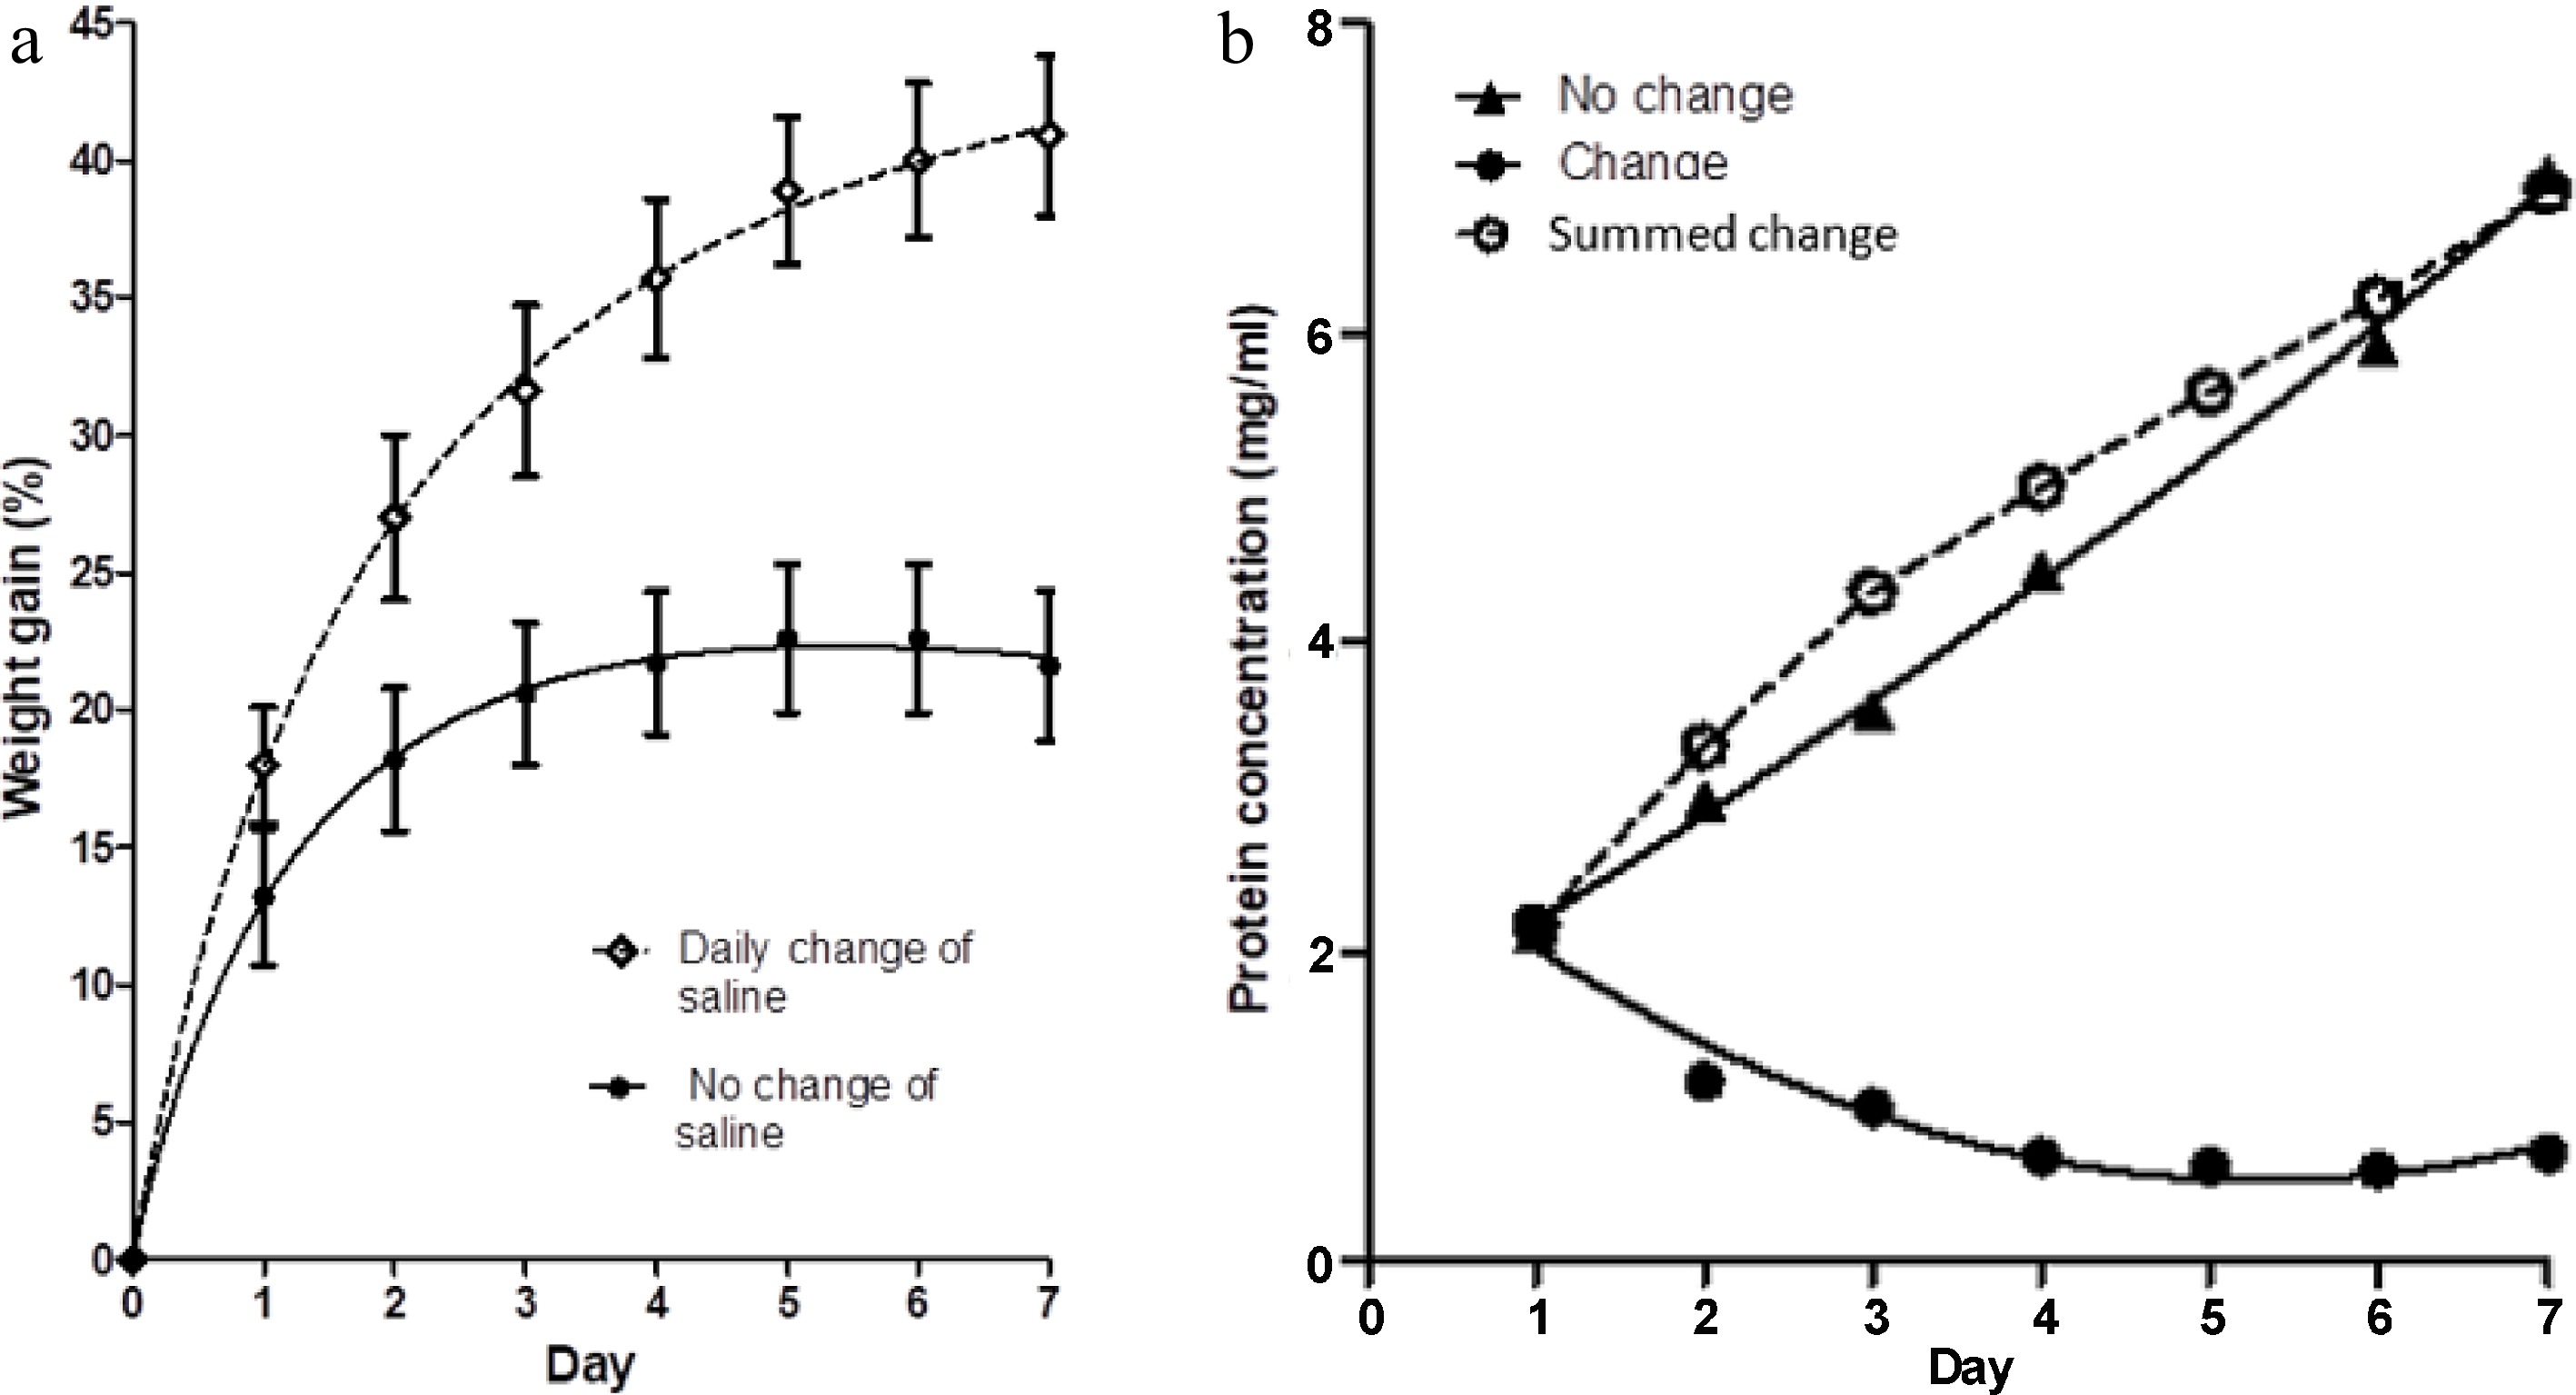
Figure 1.
(a) The percentage weight change in muscle blocks measured each day over a 7-d period of immersion in 3% NaCl solution, with two treatments; maintenance of the same saline solution throughout (no change of saline), and replacement of the saline each day with fresh, pre-chilled, 3% NaCl solution. Values shown are means ± standard errors. (b) Concentration of protein in the two saline baths (change and no change) on each day, measured just before replacement of the saline in the 'change' case. Each point is the mean of two determinations. Summed change is the cumulative concentration of protein in the salines of the treatment with daily changes of solution.
-
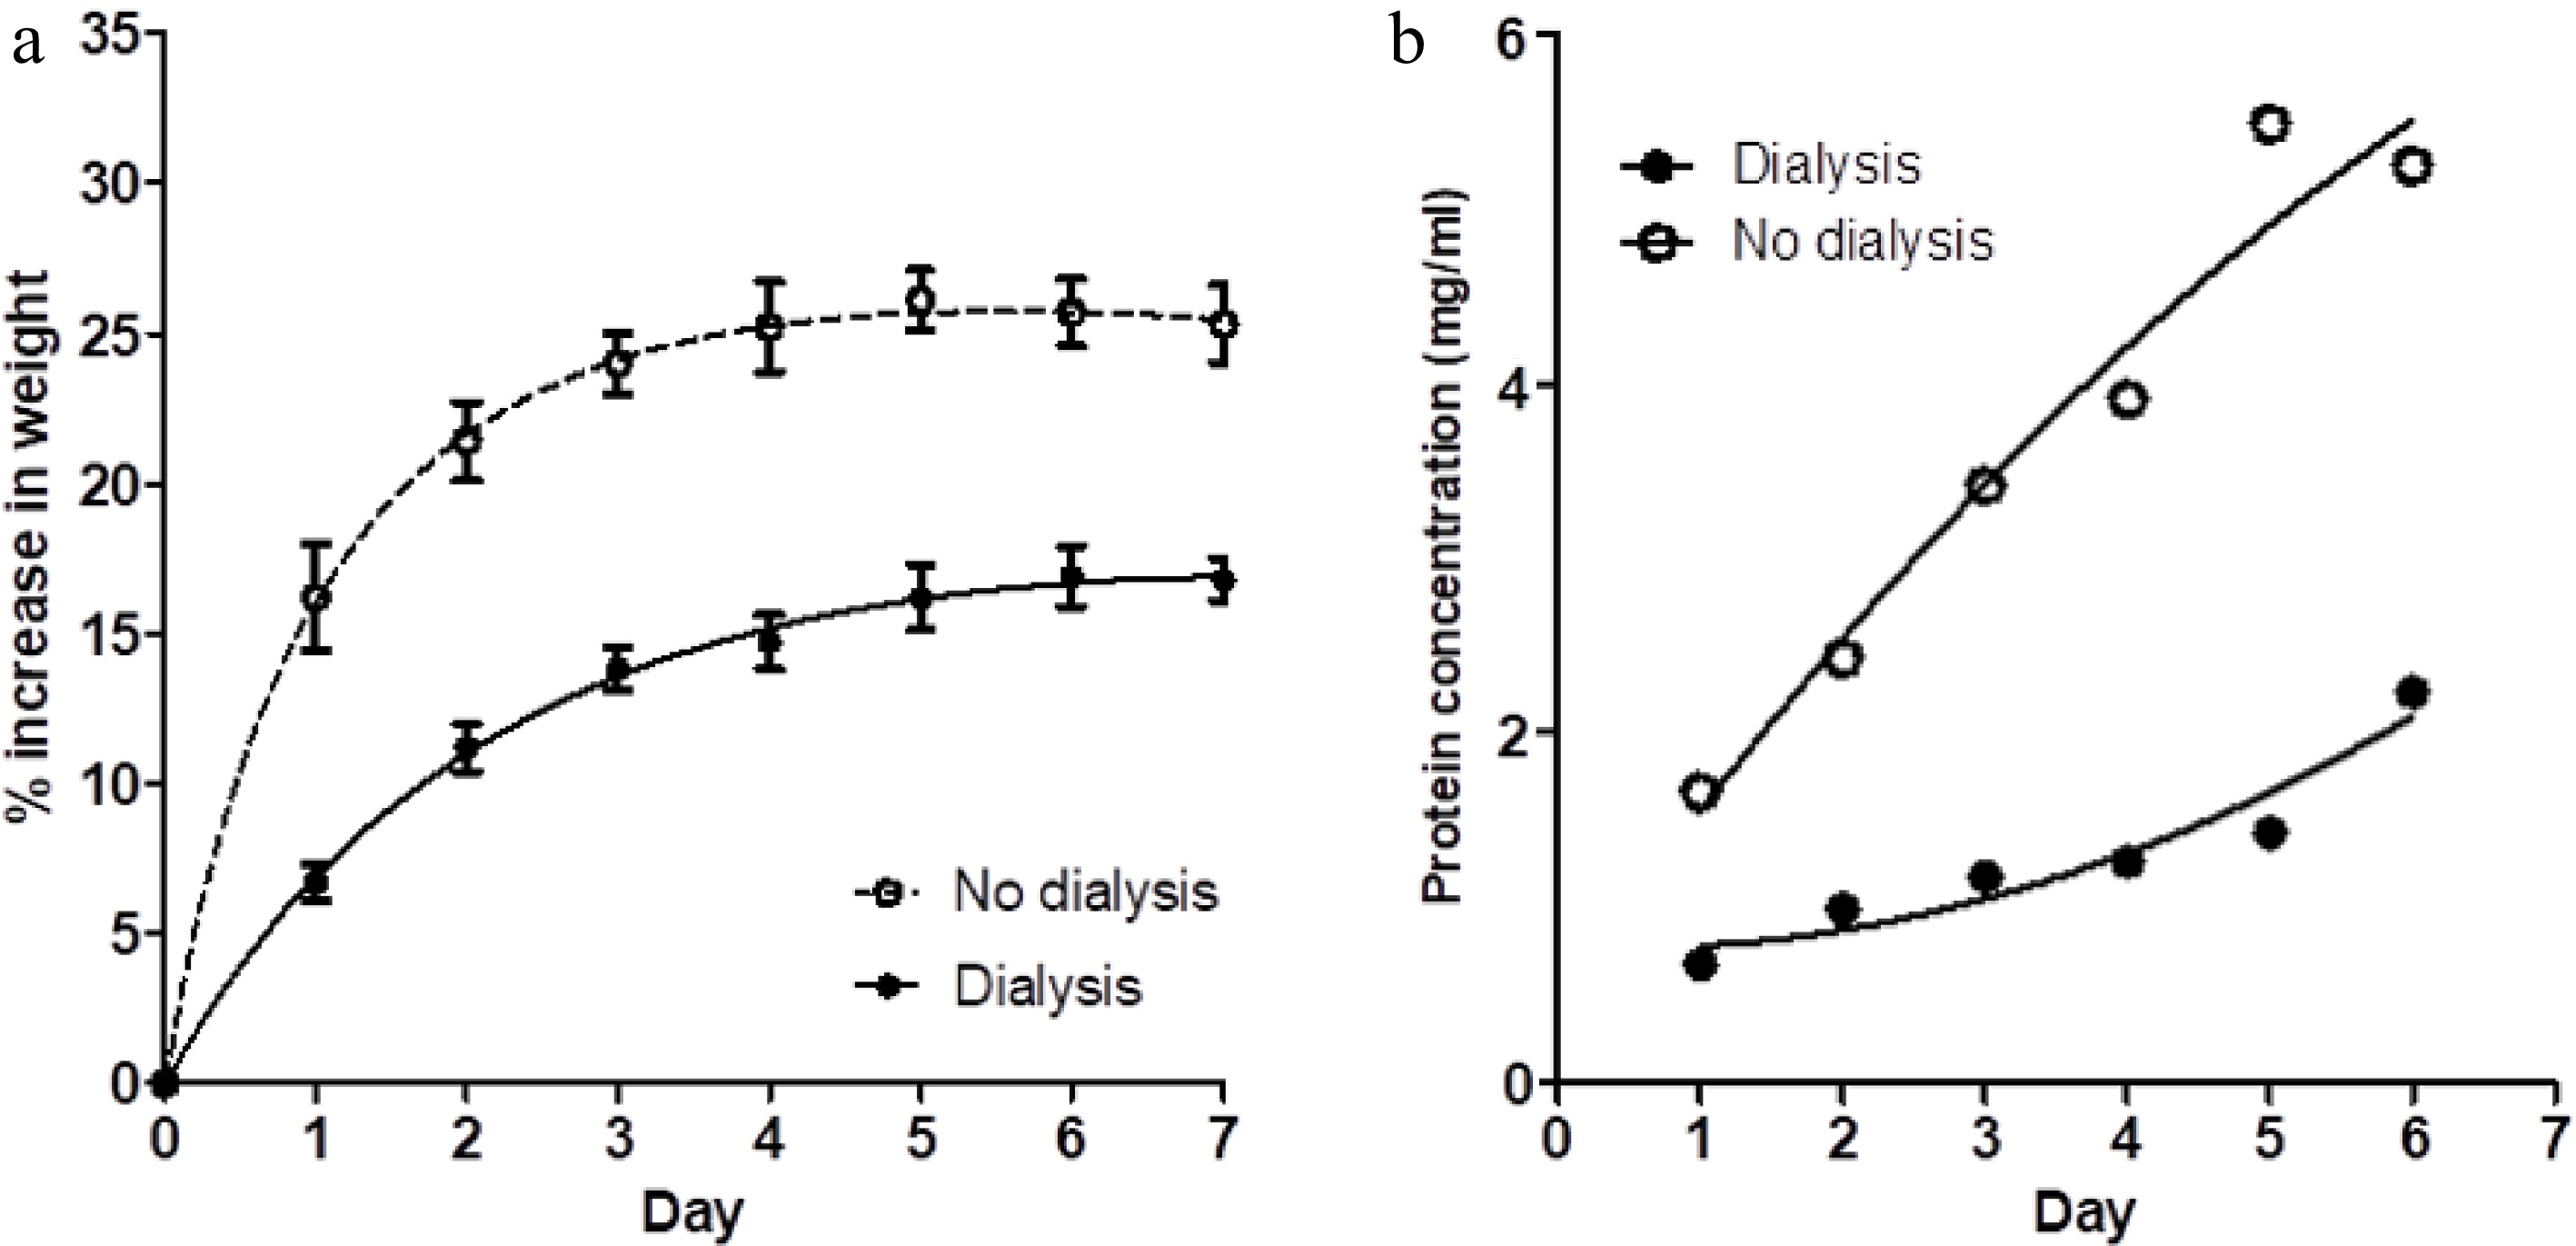
Figure 2.
(a) The percentage weight change in muscle blocks measured each day over a 7-d period of immersion in 3% NaCl solution, without changes of saline, for two treatments; muscle blocks free-floating in saline (no dialysis) and blocks enclosed in dialysis bags (dialysis). Values shown are means ± standard errors. (b) Concentration of protein in the two saline baths (dialysis and no dialysis) on each day. Each point is the mean of two determinations.
-
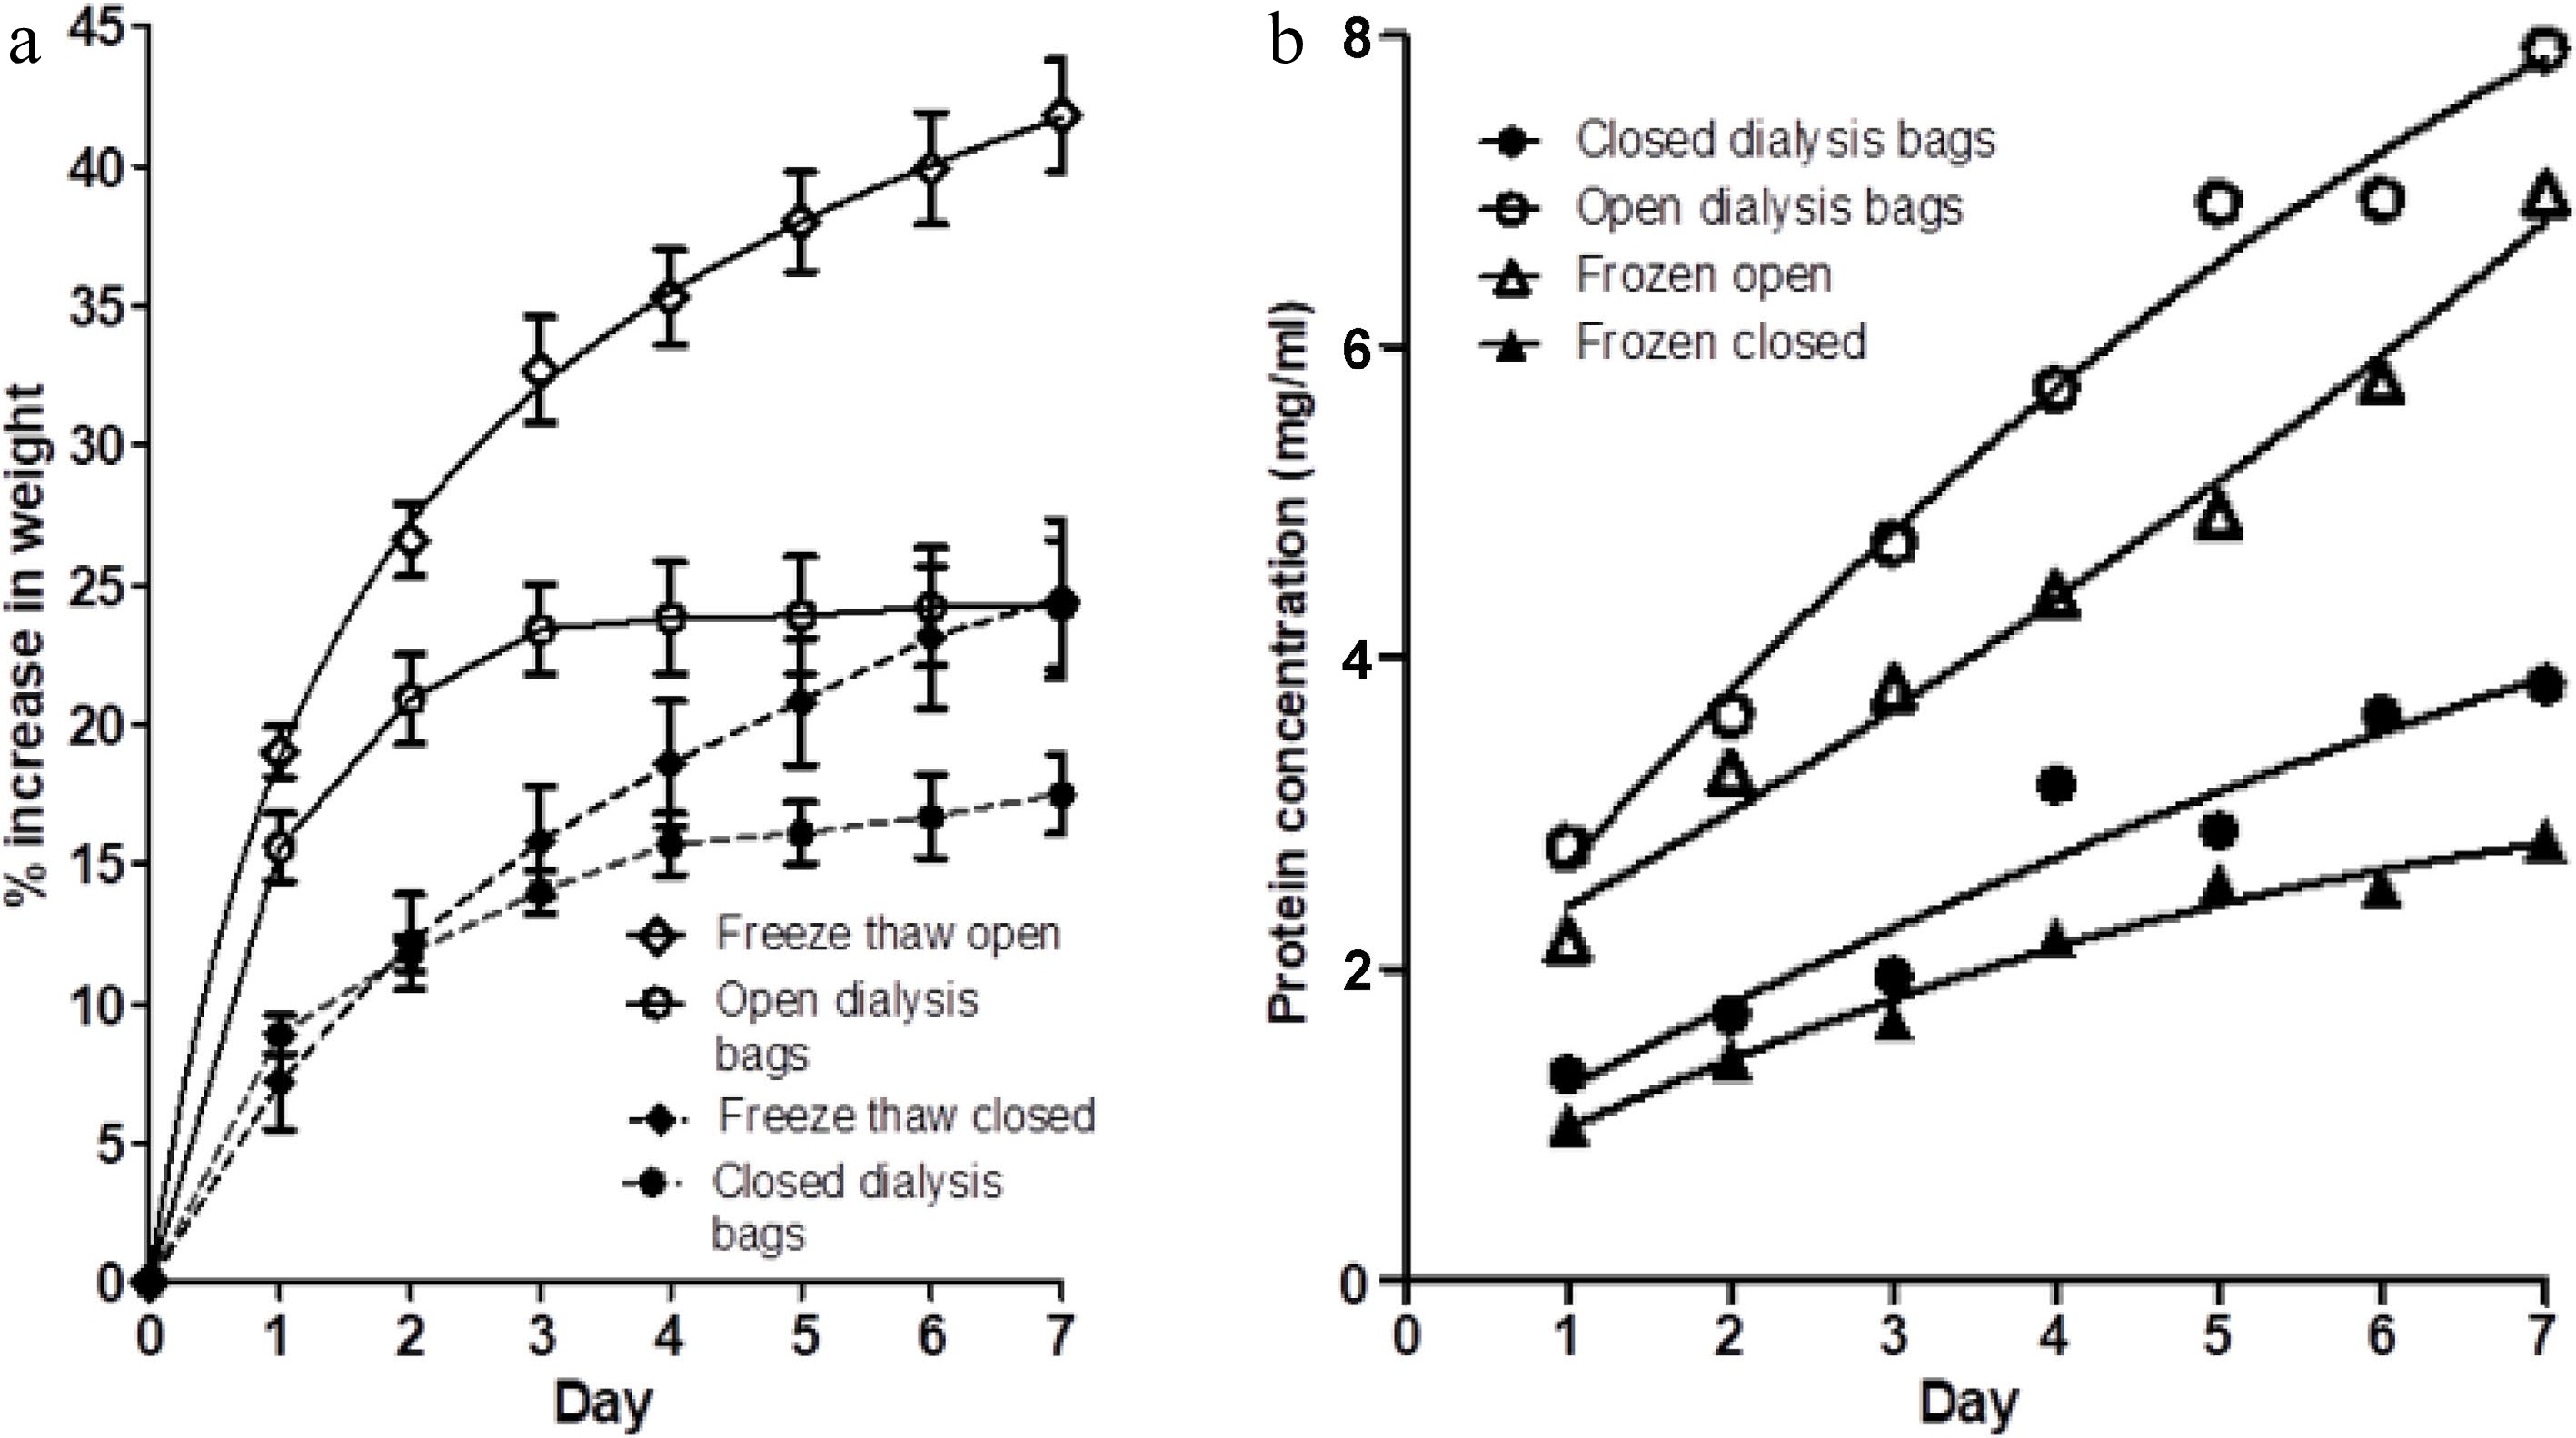
Figure 3.
(a) The percentage weight change in muscle blocks measured each day over a 7-d period of immersion in 3% NaCl solution, without changes of saline, for four treatments; fresh muscle in either (i) closed dialysis bags or in (ii) open-ended dialysis tubing, and frozen-thawed muscle blocks in either (iii) closed dialysis bags (freeze thaw closed) or (iv) open-ended dialysis tubing (freeze thaw open). Values shown are means ± standard errors. (b) Protein concentration on each day in each of the four treatments (i)−(iv) . Each point is the mean of two determinations.
-
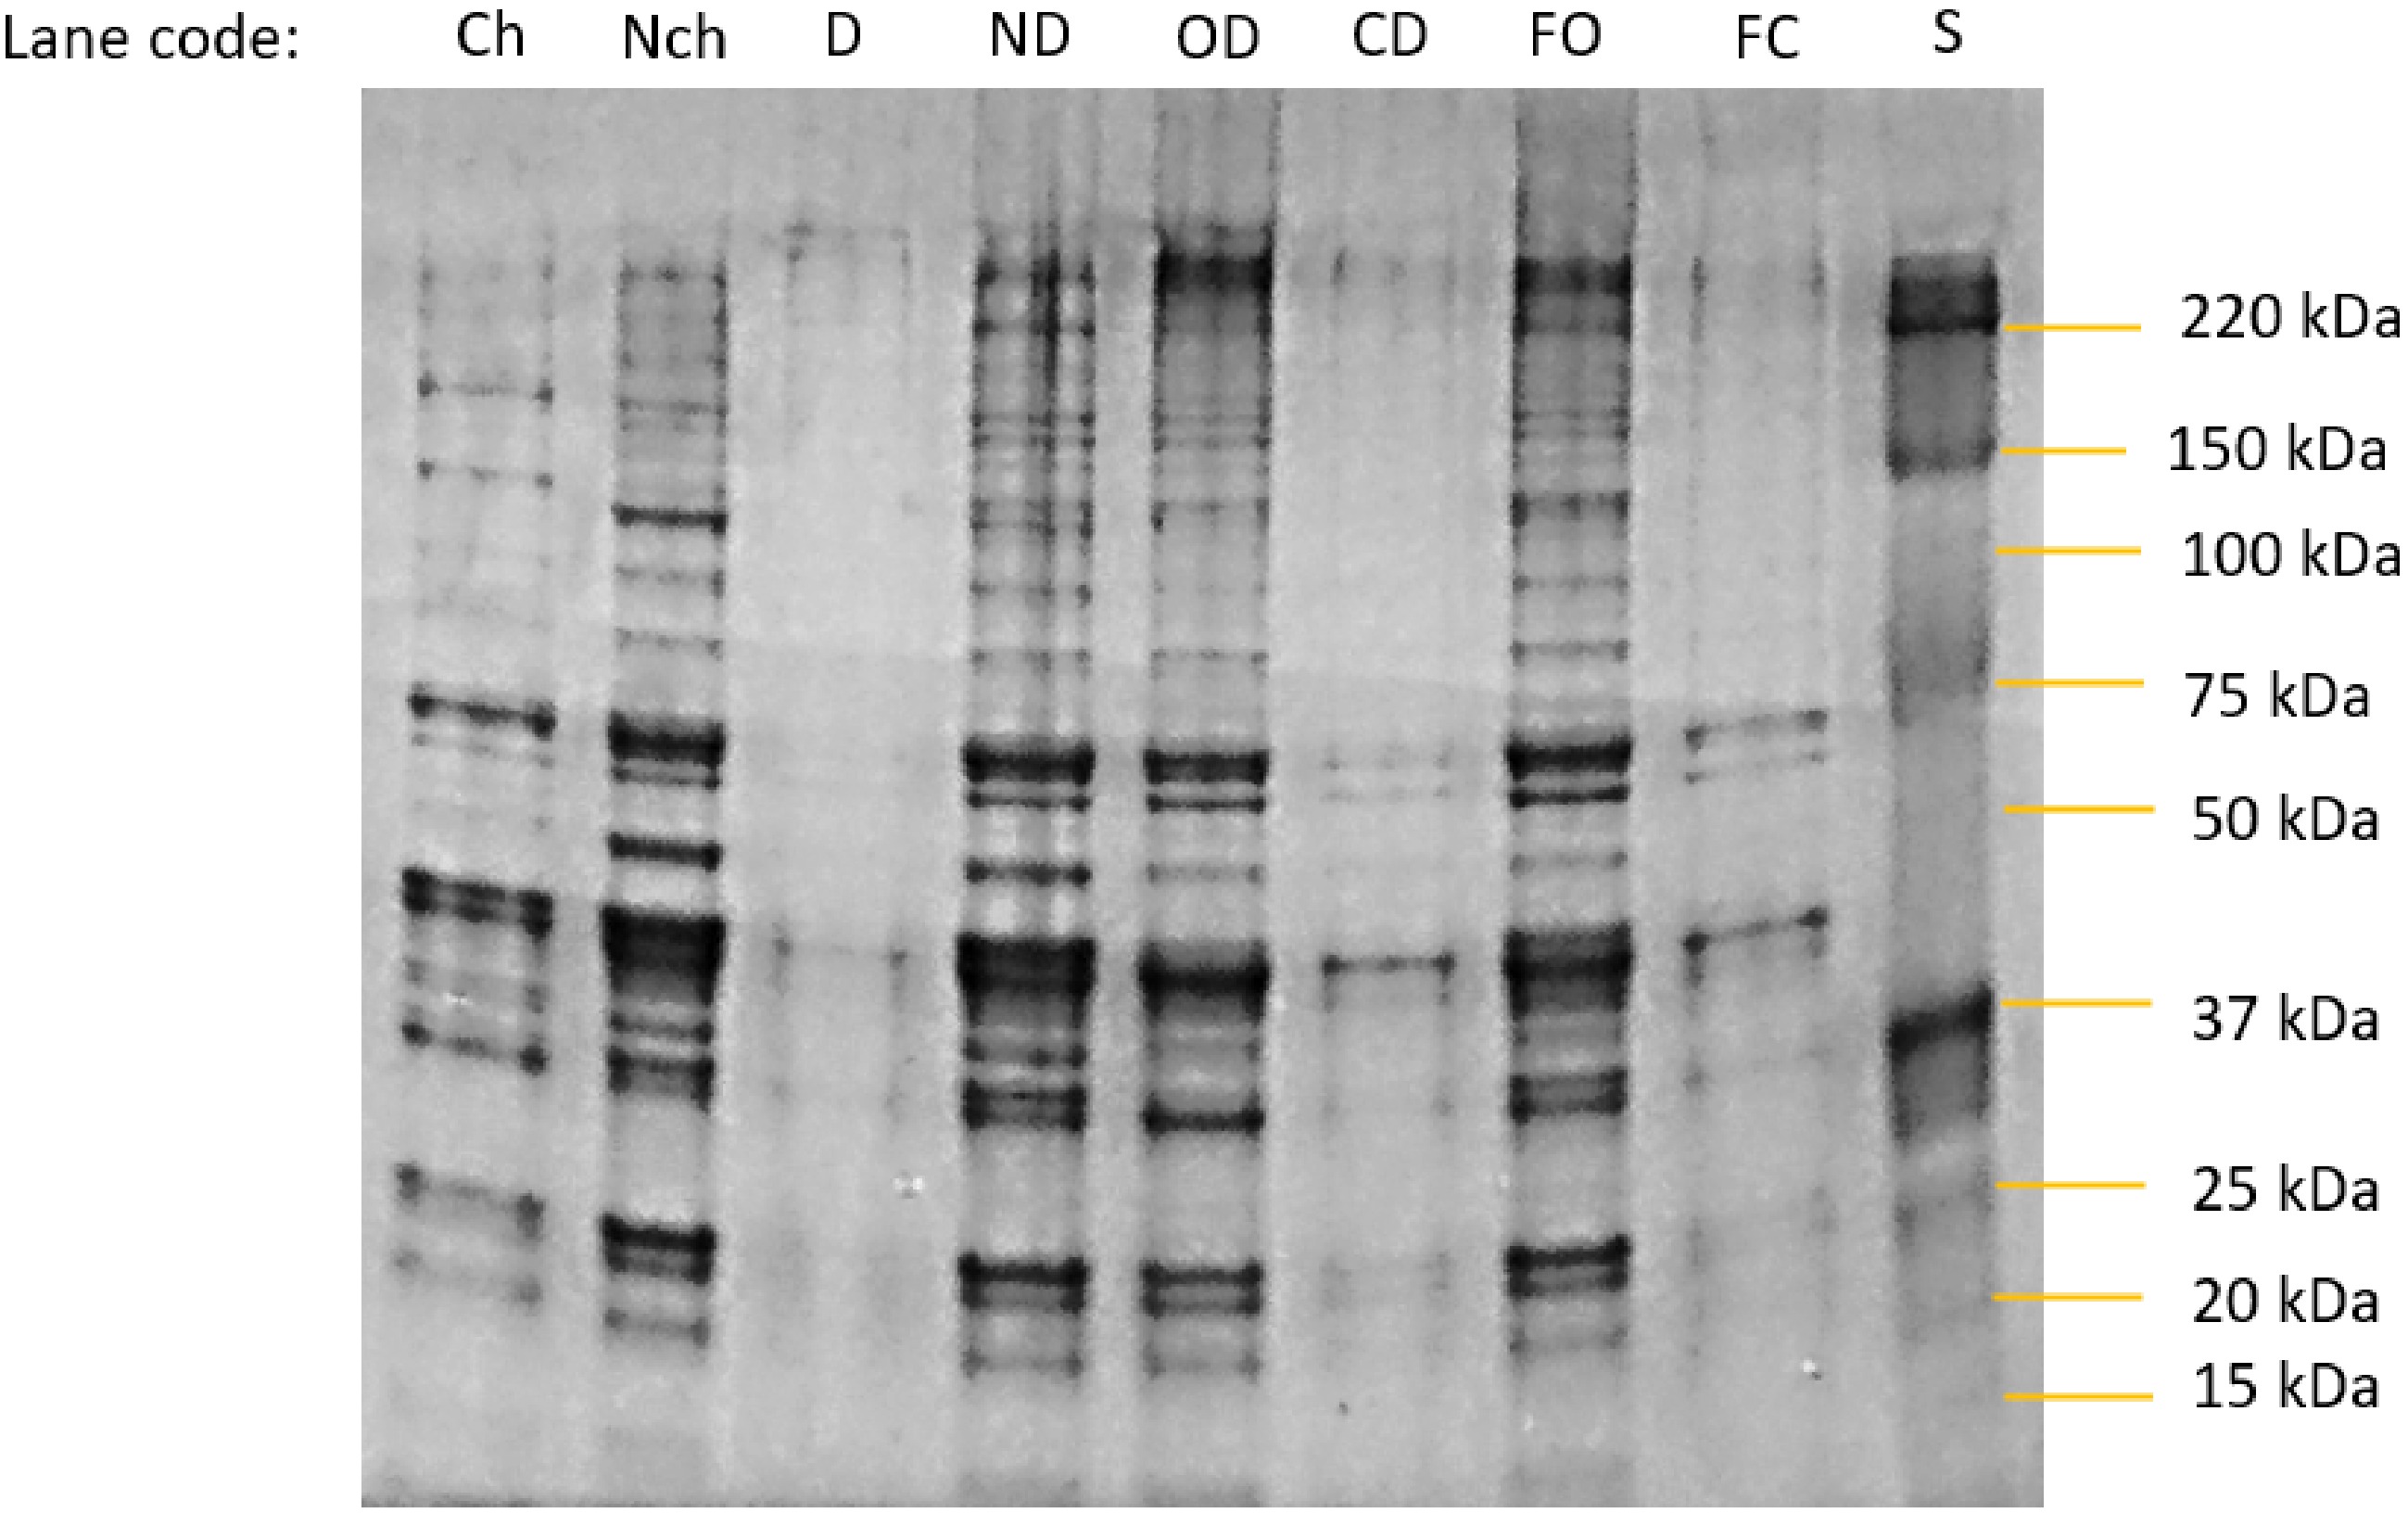
Figure 4.
Photograph of an SDS-Page gel separation of proteins in the bathing salines at the end point of each experimental treatment. Specimen codes: Ch and Nch are the change and no-change treatments from day 7, Fig. 1b. D and ND are the dialysis and no dialysis treatments from the endpoint of Fig 2b. OD = open dialysis bag and CD = closed dialysis bag treatments from the end of the experiment using fresh meat samples in Fig. 3b. FO = open dialysis bag and and F = closed dialysis bag treatments from the end of the experiment using fresh meat samples in Fig. 3b. S = molecular weight markers.
-
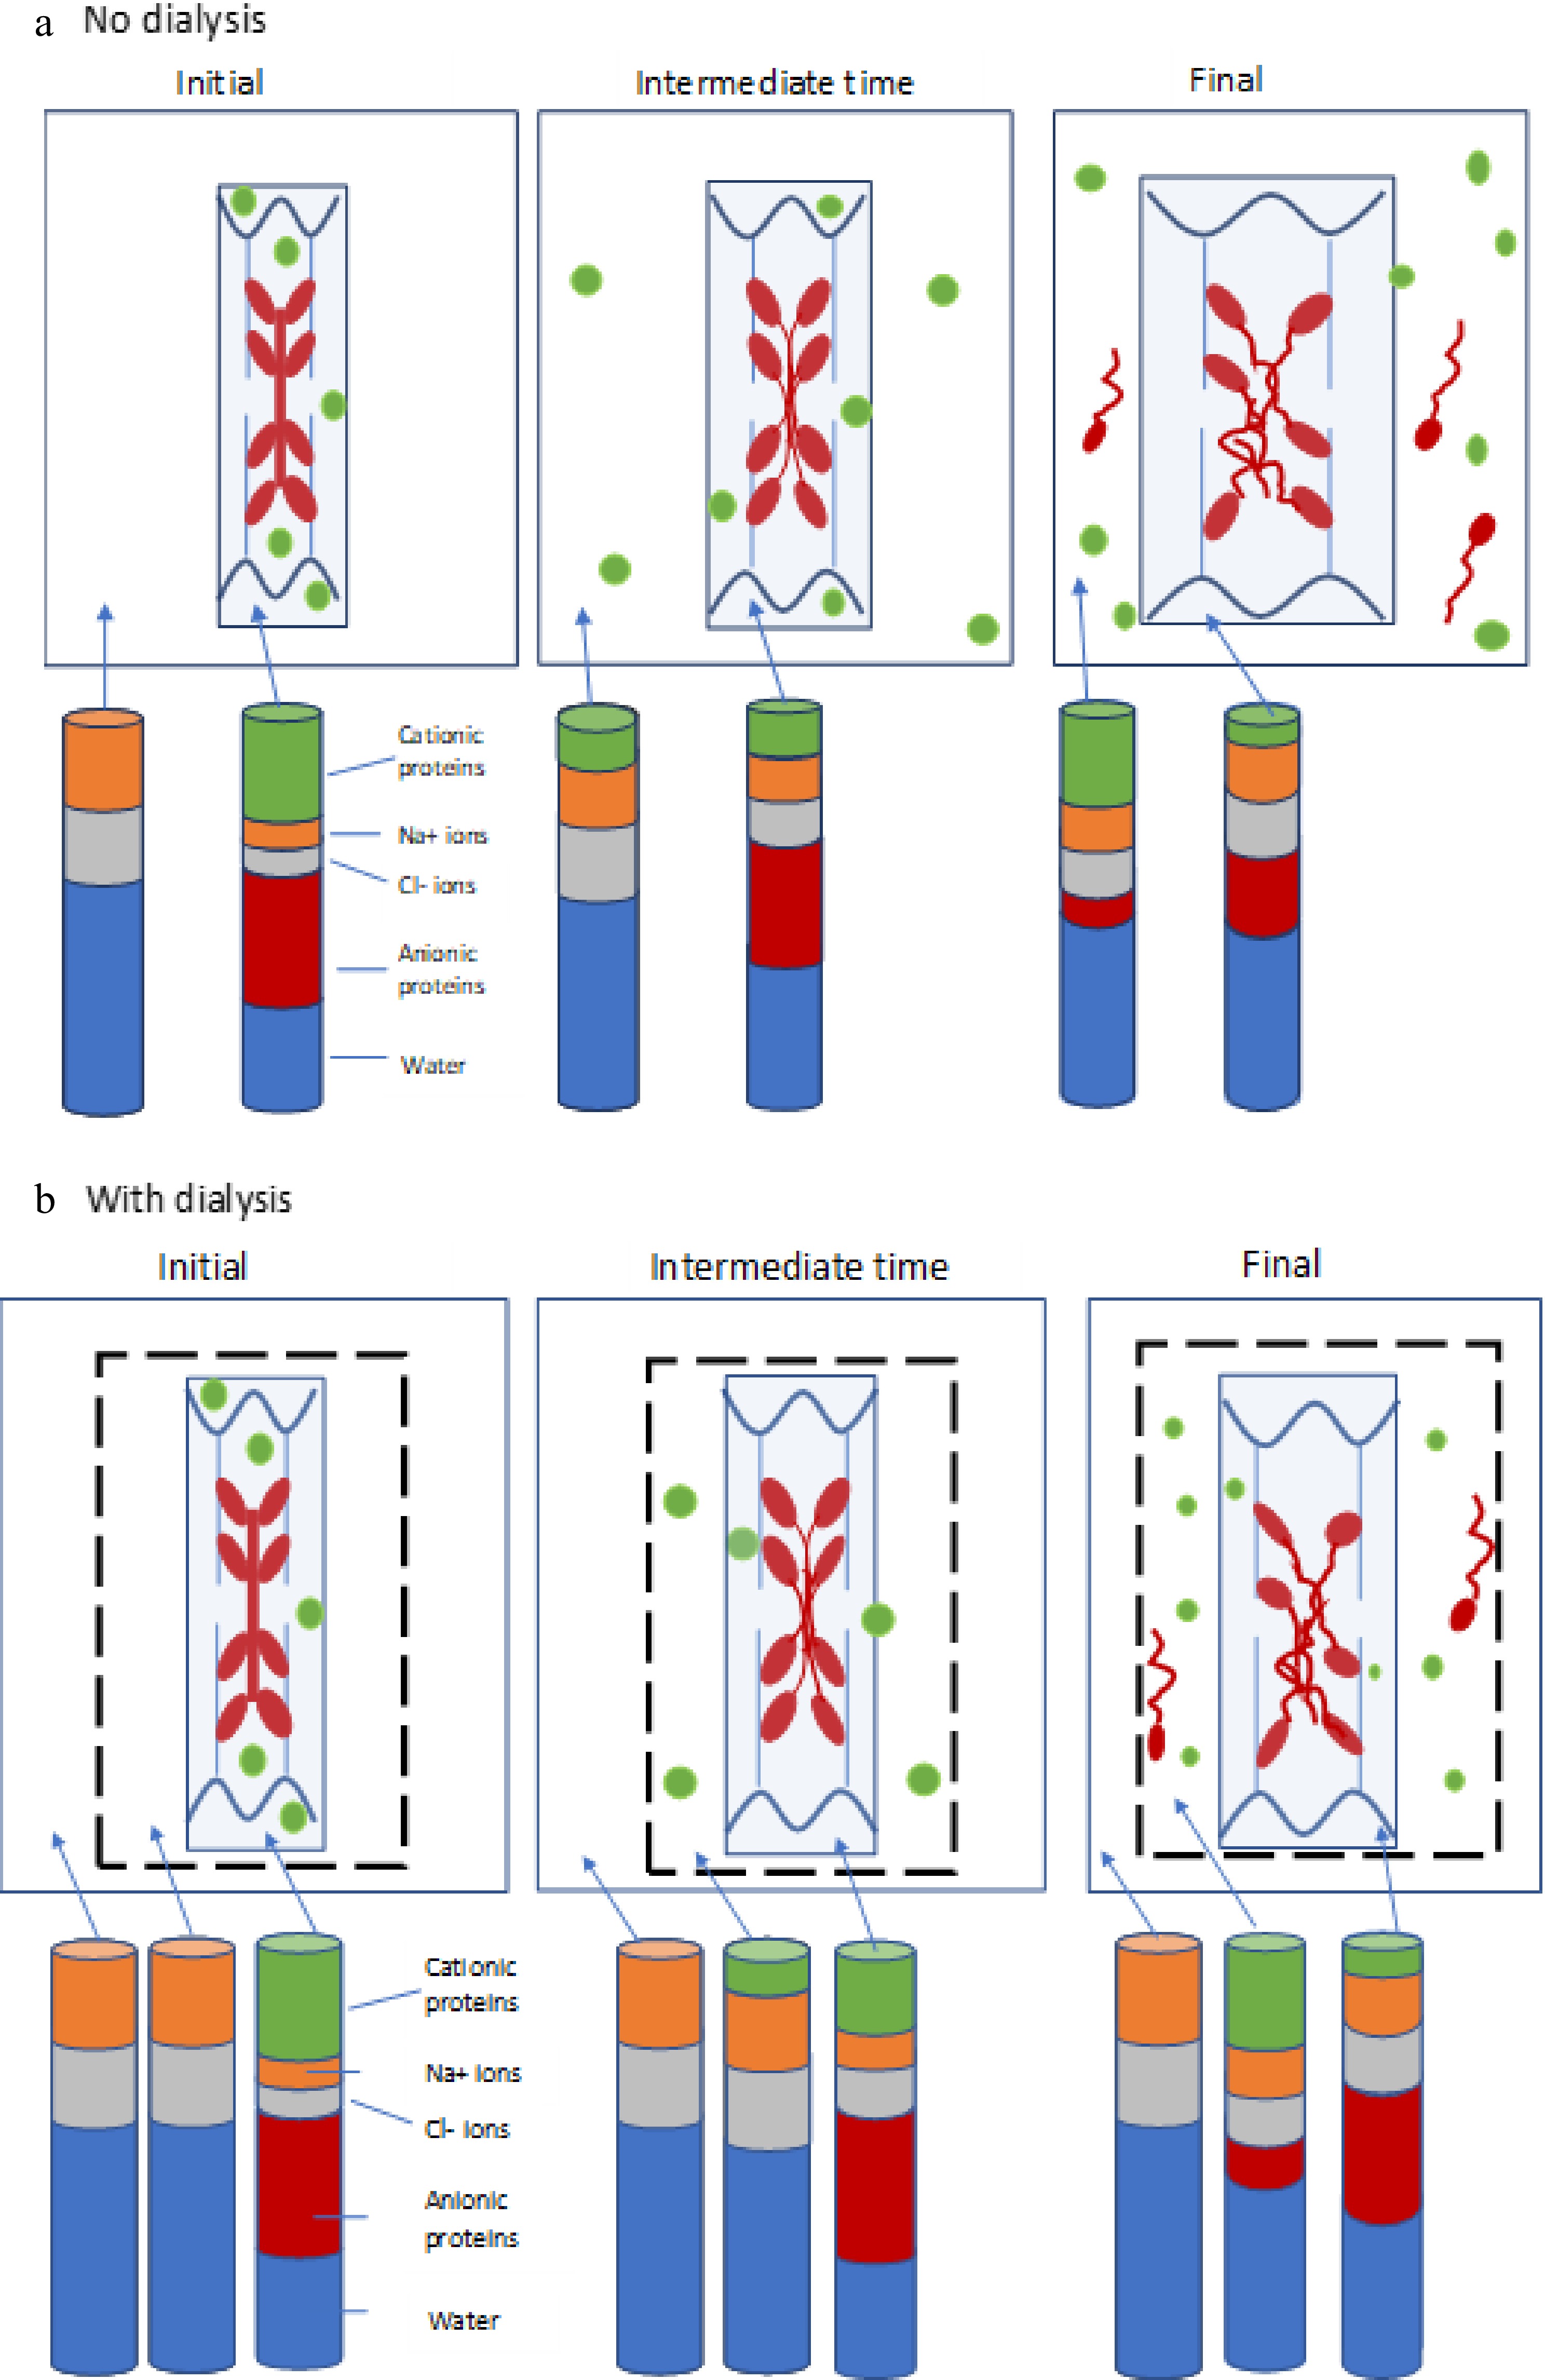
Figure 5.
(a) Schematic diagram depicting negatively-charged thick filaments (myosin, red) and thin filaments (actin, blue) attached to wavy z-discs (wavy dark blue lines) within a sarcomere (light blue box), together with positively-charged soluble sarcoplasmic proteins (green). The system is surrounded by surrounded by a solution of NaCl (white space). The distribution of these proteins is shown at the initial, intermediate and final time points of the experiment. The stacked columns represent the how the relative amounts of cationic proteins (green), anionic proteins (red), sodium ions (orange), chloride ions (grey) and water (blue) in the bathing solution and within the meat piece changes with time (not to scale). (b) Depiction of the same system, but with the addition of a dialysis membrane (dotted black line). Stacked bars now represent the relative amounts of the components within the meat piece, within the dialysis bag, and in the saline external to the dialysis bag. In (a), cationic soluble proteins are extracted from the meat with time, and eventually some myosin is also solubilised and extracted into the bathing medium. In (b), soluble proteins and any extracted myosin are contained within the dialysis bag, providing a smaller osmotic gradient driving water into the meat, and hence reducing swelling.
-
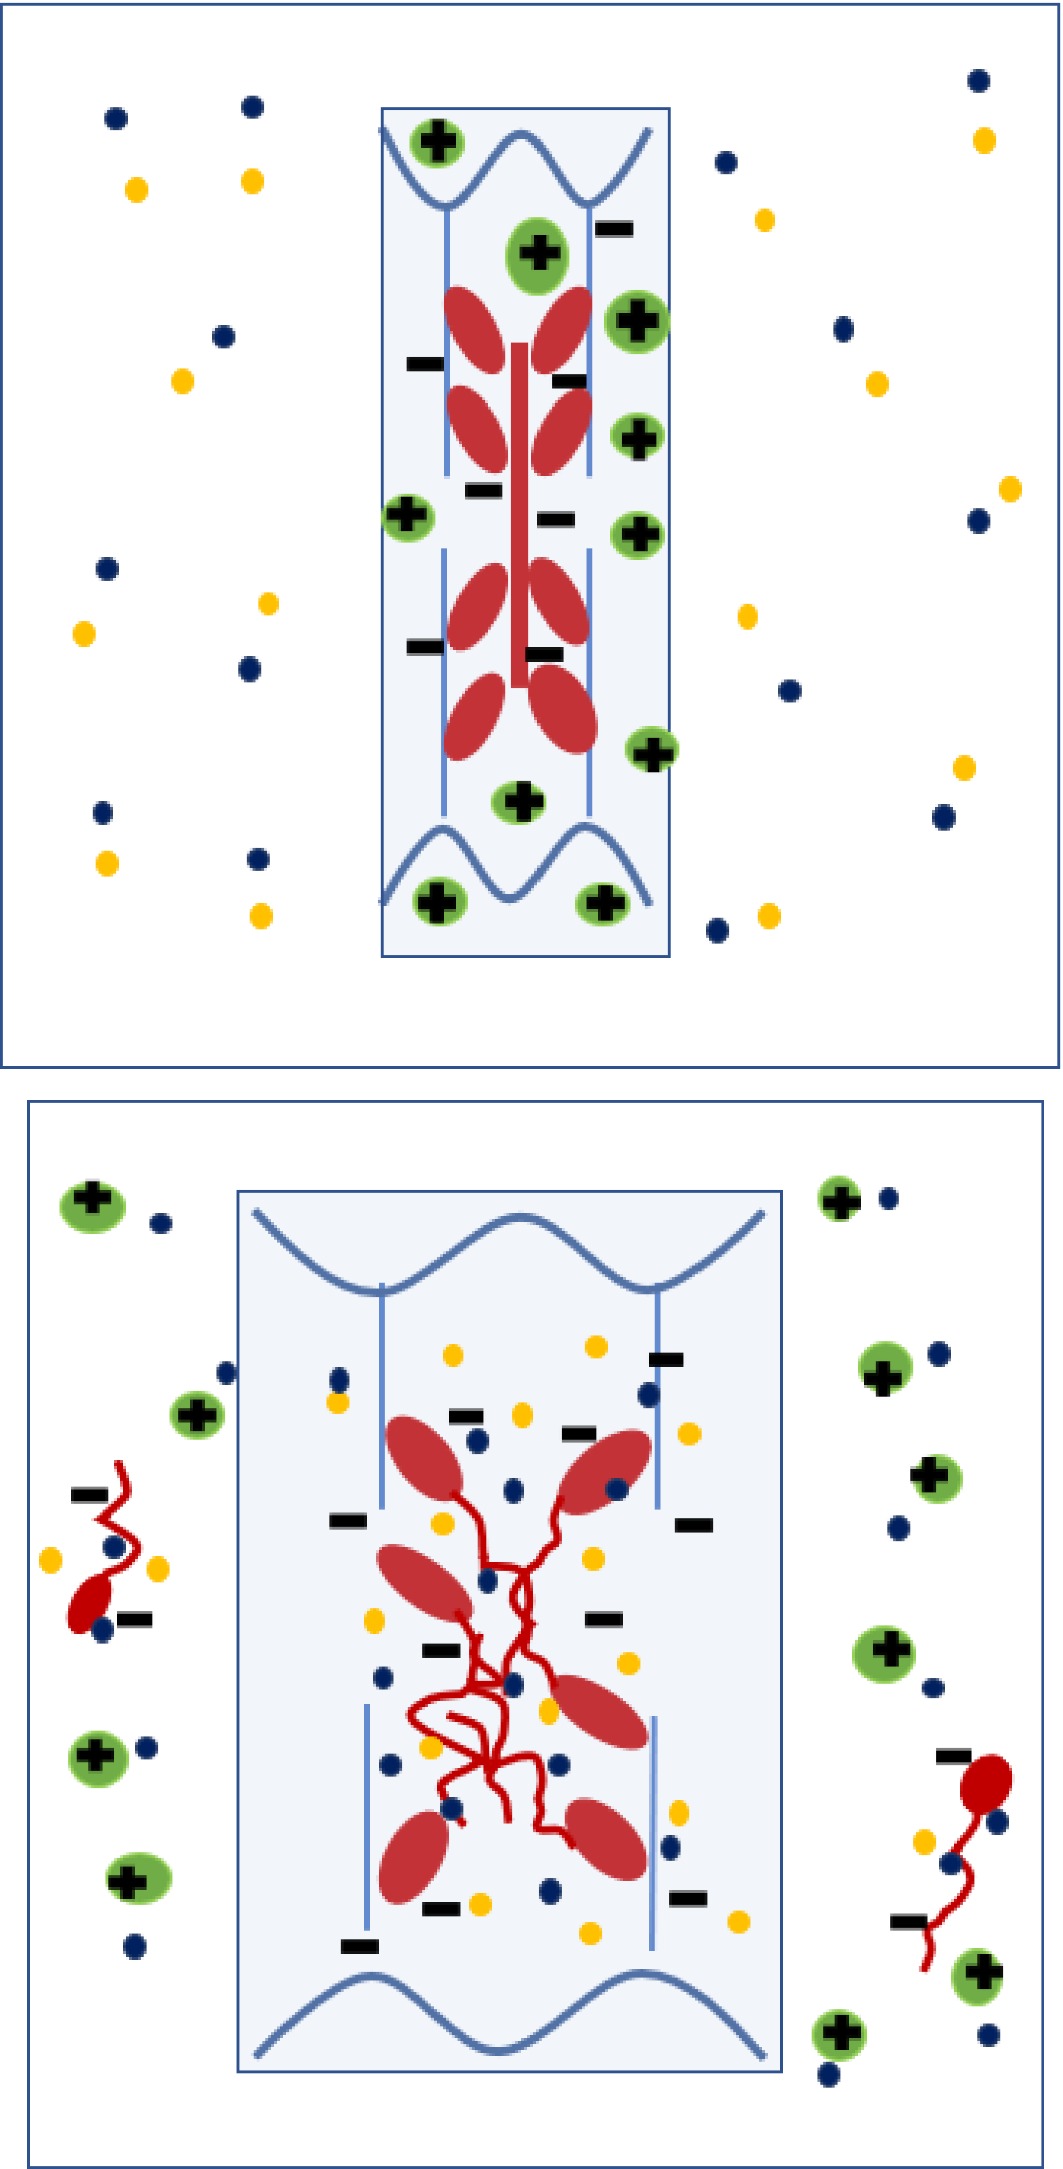
Figure 6.
Diagram depicting anionic (negatively-charged) thick filaments (myosin, red) and thin filaments (actin, blue) within a sarcomere at post-rigor pH, together with cationic (positively -charged) soluble sarcoplasmic proteins (green). Following initial immersion (left) in a solution containing Na+ and Cl- ions, the Cl- preferentially binds to myosin, making the myofilaments more anionic. Sodium counterions are attacted to the anionic myofibrillar proteins and Cl- counterions are attracted to the positively charged, cationic sarcoplasmic proteins. Swelling of the myofilament lattice (mainly anionic proteins) is initially counteracted by the presence of cationic sarcoplasmic protein, but as the soluble sarcoplasmic proteins diffuse out with time (right), their counteracting effect is extracted, leaving the thick filament to disassemble and the sarcomere to expand laterally due to Gibbs-Donnan osmotic forces. At medium to high NaCl concentrations, some of the anionic myosin is also extracted (right).
-
Experiment part Treatment Total meat mass
(g)Saline volume
(ml)Meat : Brine ratio Measured final protein
(mg/ml)Maximum sarc prots
(mg/ml)1 Change 89.1 500 1:5.6 6.91* 9.80 1 No change 82.2 500 1:6.1 7.02 9.04 2 Dialysis 61.1 1,000 1:16.4 2.24** 3.36 2 No dialysis 69.9 1,000 1:14.3 5.25** 3.84 3 Open 90.6 1,000 1:11.4 7.91 4.98 3 Closed 82.5 1,000 1:12.1 3.83 4.54 4 Frozen open 78.7 1,000 1:12.7 6.99 4.33 4 Frozen closed 86.3 1,000 1:11.6 2.82 4.75 Maximum sarc prots (mg/ml): This is the maximum predicted values of protein concentration if sarcoplasmic proteins comprise 5.5% of wet muscle weight and all of this is extracted into the volume of saline used. Values of the measured final protein concentration that exceed the predicted maximum concentration of sarcoplasmic proteins are marked in bold font. * Value shown is for the summed concentration of protein extracted in the daily change of saline. ** These values were from day 6 of the study (values on day 7 not available). Table 1.
Meat:brine ratios and protein content in salines at end of experiment (after 7 d).
-
Protein MW (kDa) % (w/w) of total
protein (sarcomeric)(Glyogen) Phosphorylase 188 3.4 Phosphoglucomutase 62 1.9 Pyruvate kinase 237 6.7 Phosphoglucose isomerase 55 2.2 Enolase 82−100 11.8 Creatine kinase (phosphoglycerate kinase) 81 23.2 Aldolase 160 13.6 Glyceraldehyde phosphate dehydrogenase 144 18.0 Lactate dehydrogenase 140 6.0 Phosphoglycerate mutase 54 6.7 Triosephosphate isomerase 54 2.7 Myokinase 25 trace Myoglobin 16.7 1.1 Table 2.
Individual components of the water-soluble protein extracted from porcine longissimus muscle, showing the relative proportions of each (data from Savage, Warriss & Jolley, 1990) and their molecular weight (MW). The thirteen major components listed comprise 90.6% of the total amount of sarcoplasmic proteins.
Figures
(6)
Tables
(2)