-
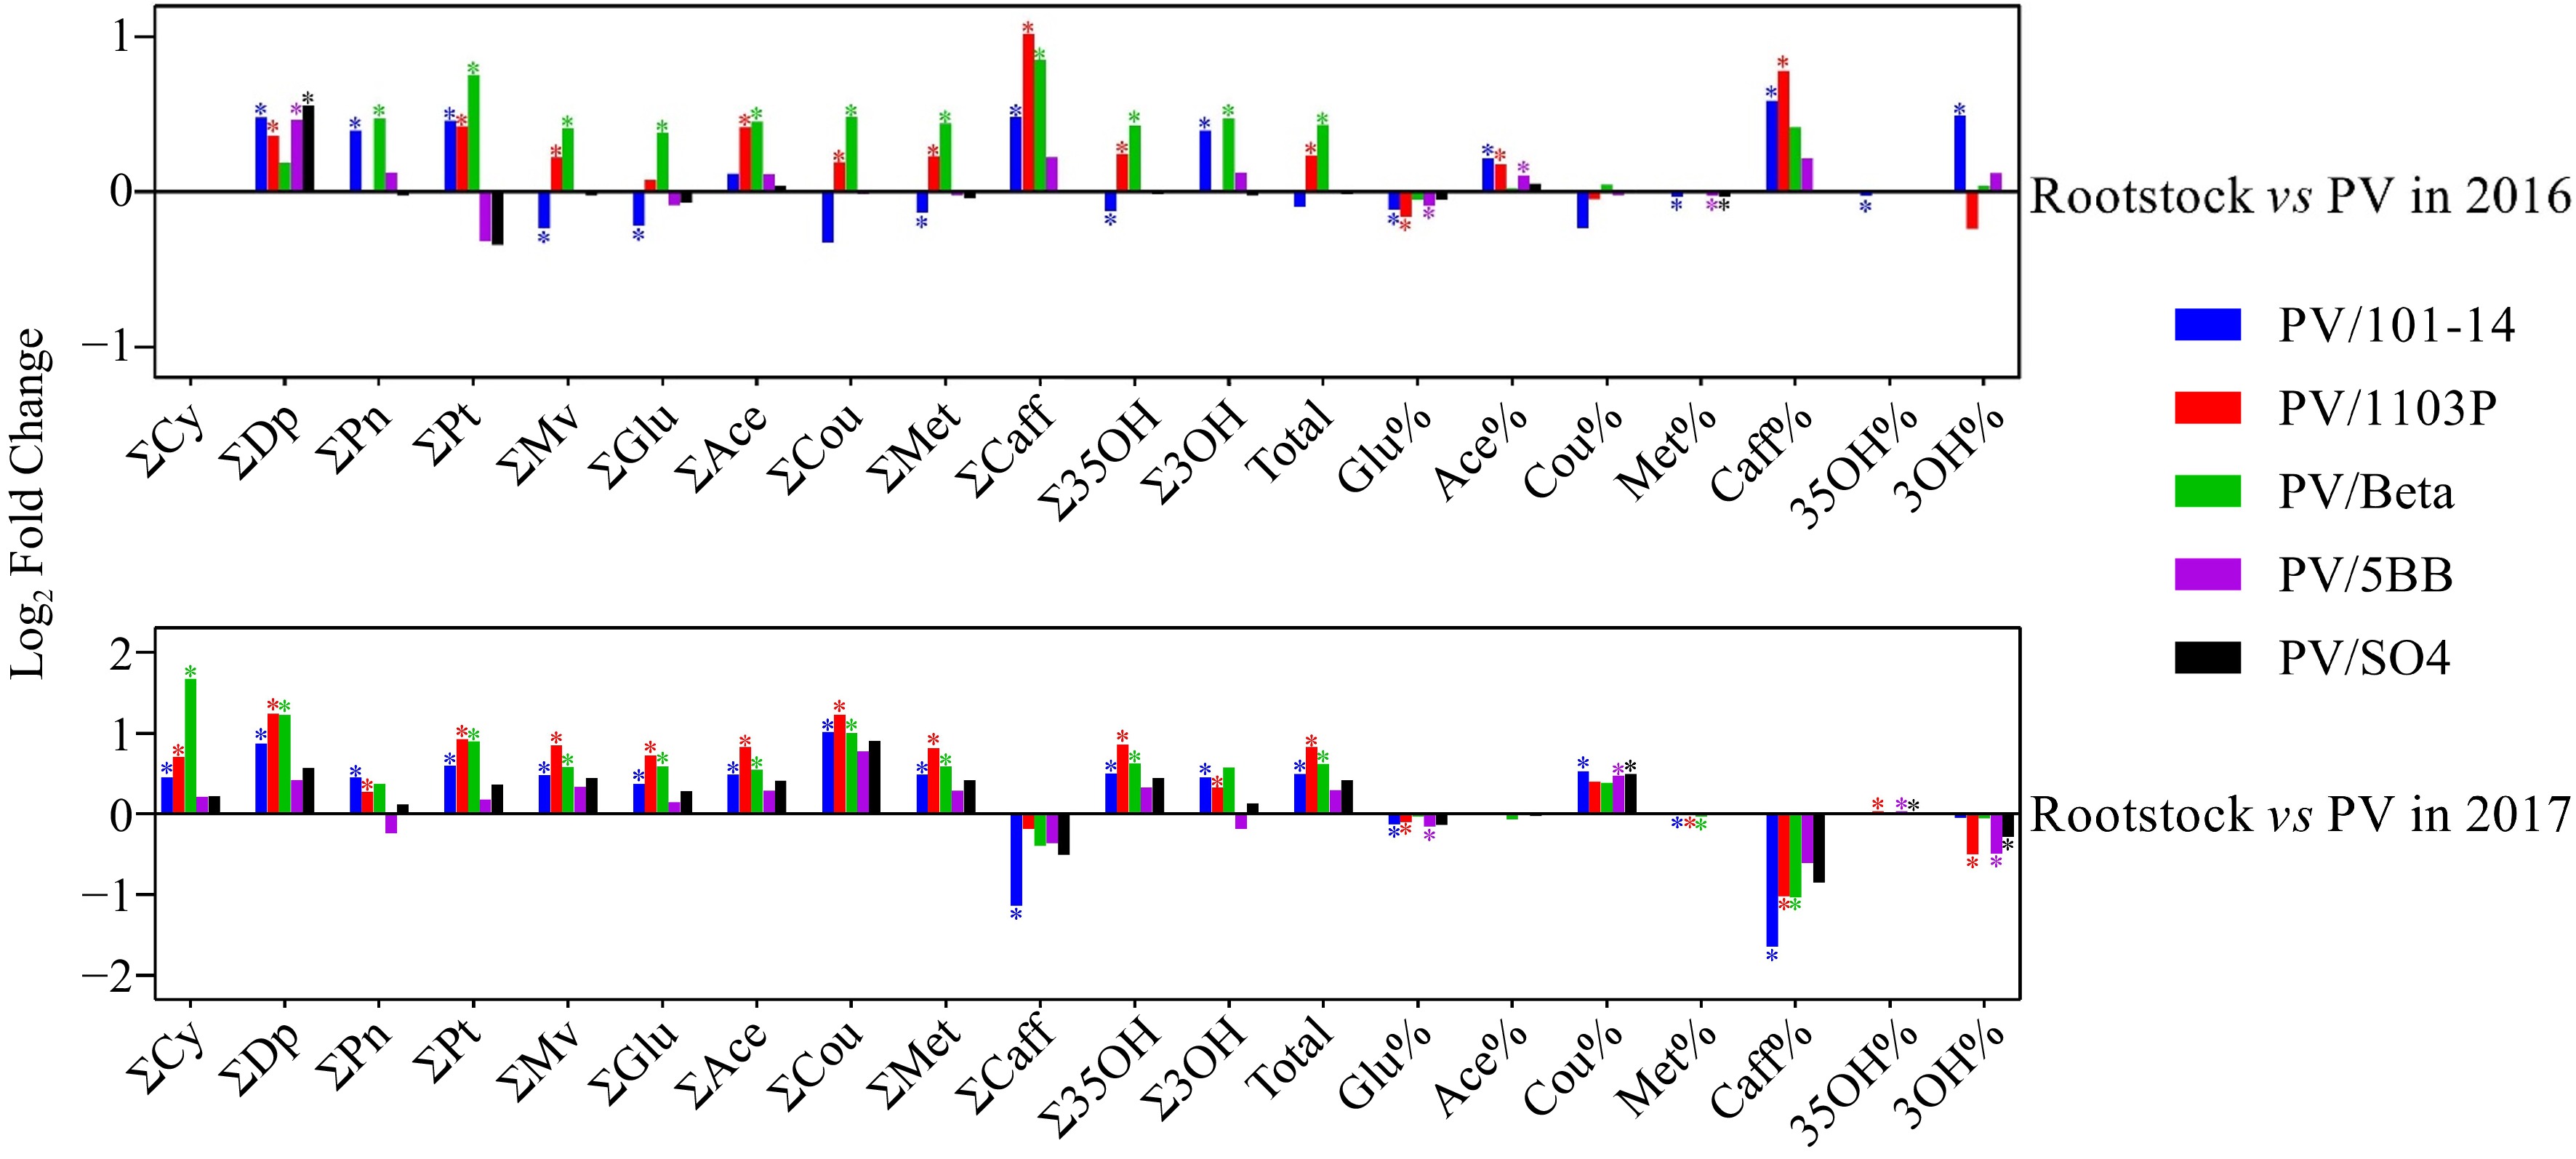
Figure 1.
Effect of rootstocks on anthocyanins in two vintages (2016−2017). Each data represents the log2 fold change in anthocyanin concentration/proportion in mature berries on each rootstock relative to those on own-rooted vines. '∑', the total concentration of different types of anthocyanins; '%', the proportions of different types of anthocyanins; 'Total', the total concentration of anthocyanins; 'Cy', cyanidin; 'Dp', delphinidin; 'Pn', peonidin; 'Pt', petunidin; 'Mv', malvidin; 'Glu', anthocyanins in glucoside form; 'Ace', acetylated anthocyanins; 'Cou', coumarylated anthocyanins; 'Met', methoxylated anthocyanins; 'Caff', caffeoylated anthocyanins; '35OH', 3'5'-hydroxylated anthocyanins; '3OH', 3'-hydroxylated anthocyanins. The * on each column indicates a significant difference between rootstock and own-rooted vines in accordance with Duncan's test (p < 0.05).
-
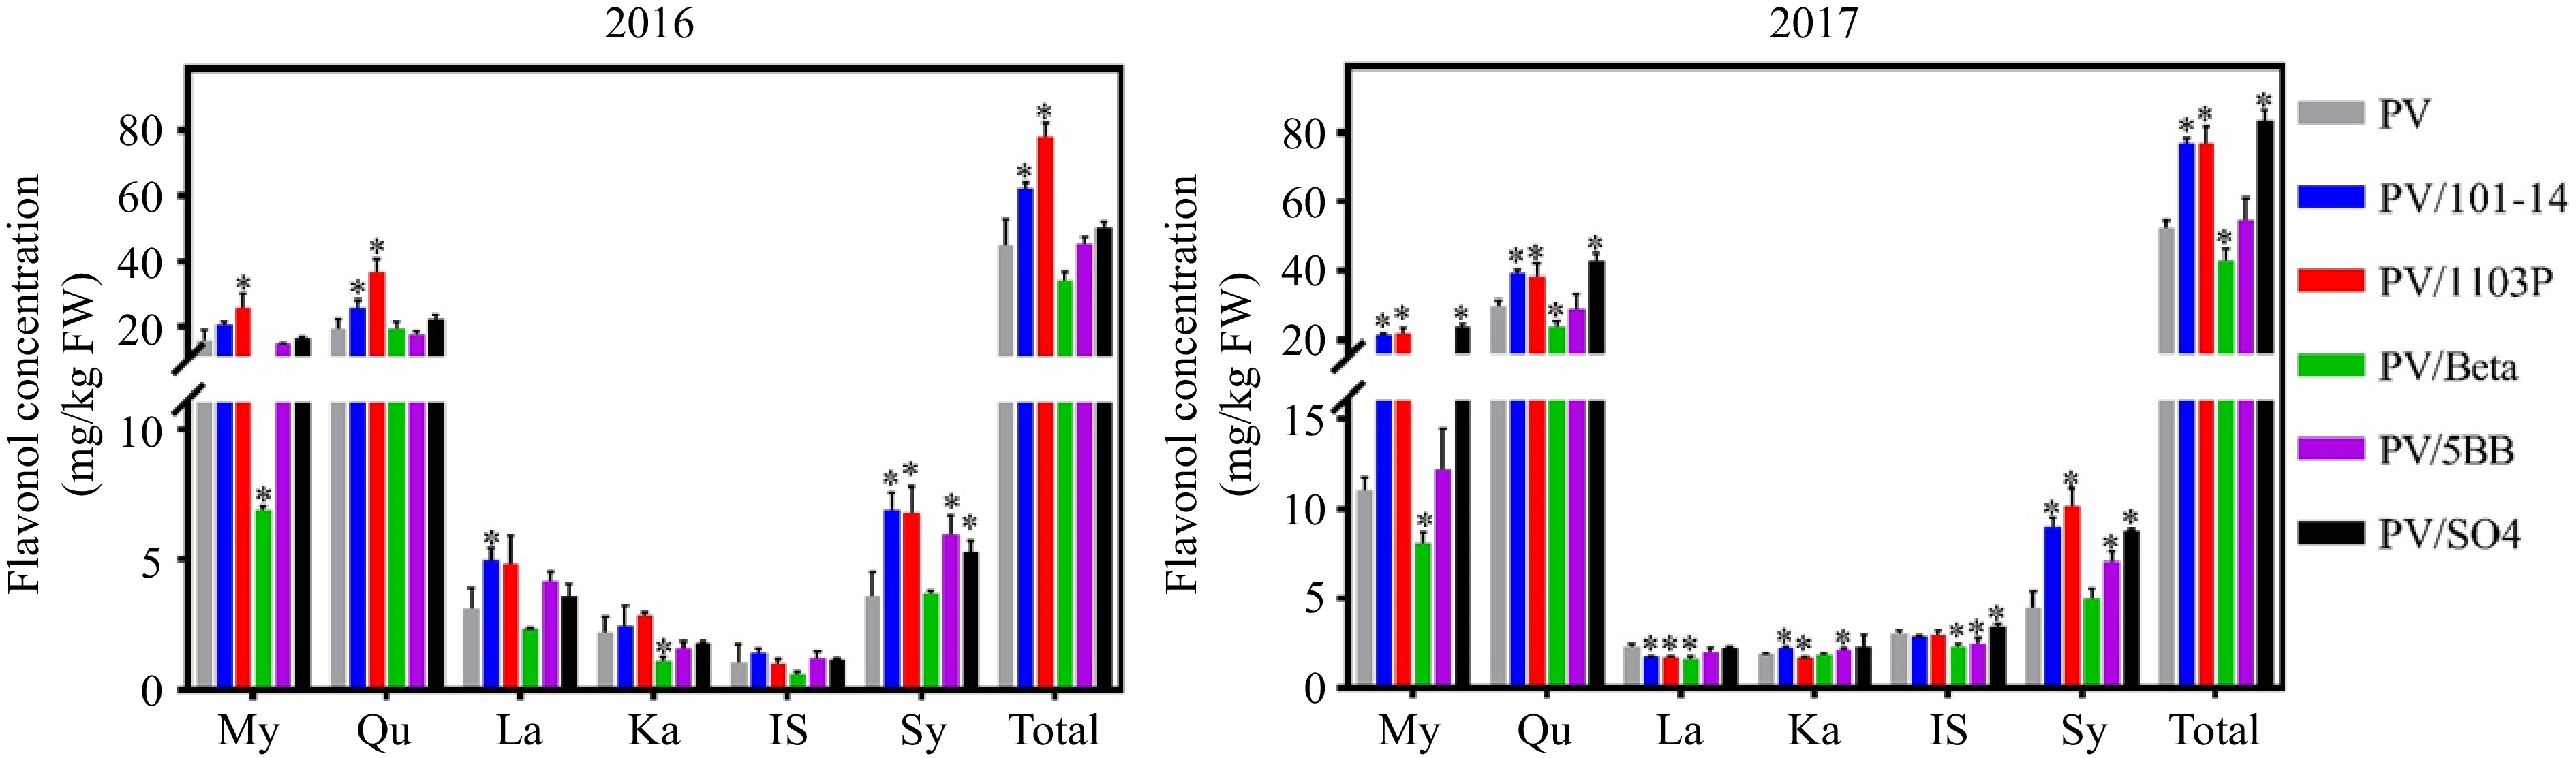
Figure 2.
Effect of rootstocks on flavonols in two vintages (2016−2017). 'My', myricetin; 'Qu', quercetin; 'La', laricitrin; 'Ka', kaempferol; 'IS', isohamnetin; 'Sy', syringetin; 'Total', the total concentration of flavonols; The * on each column indicates significant difference between rootstock and own-rooted vines in accordance with Duncan's test (p < 0.05).
-
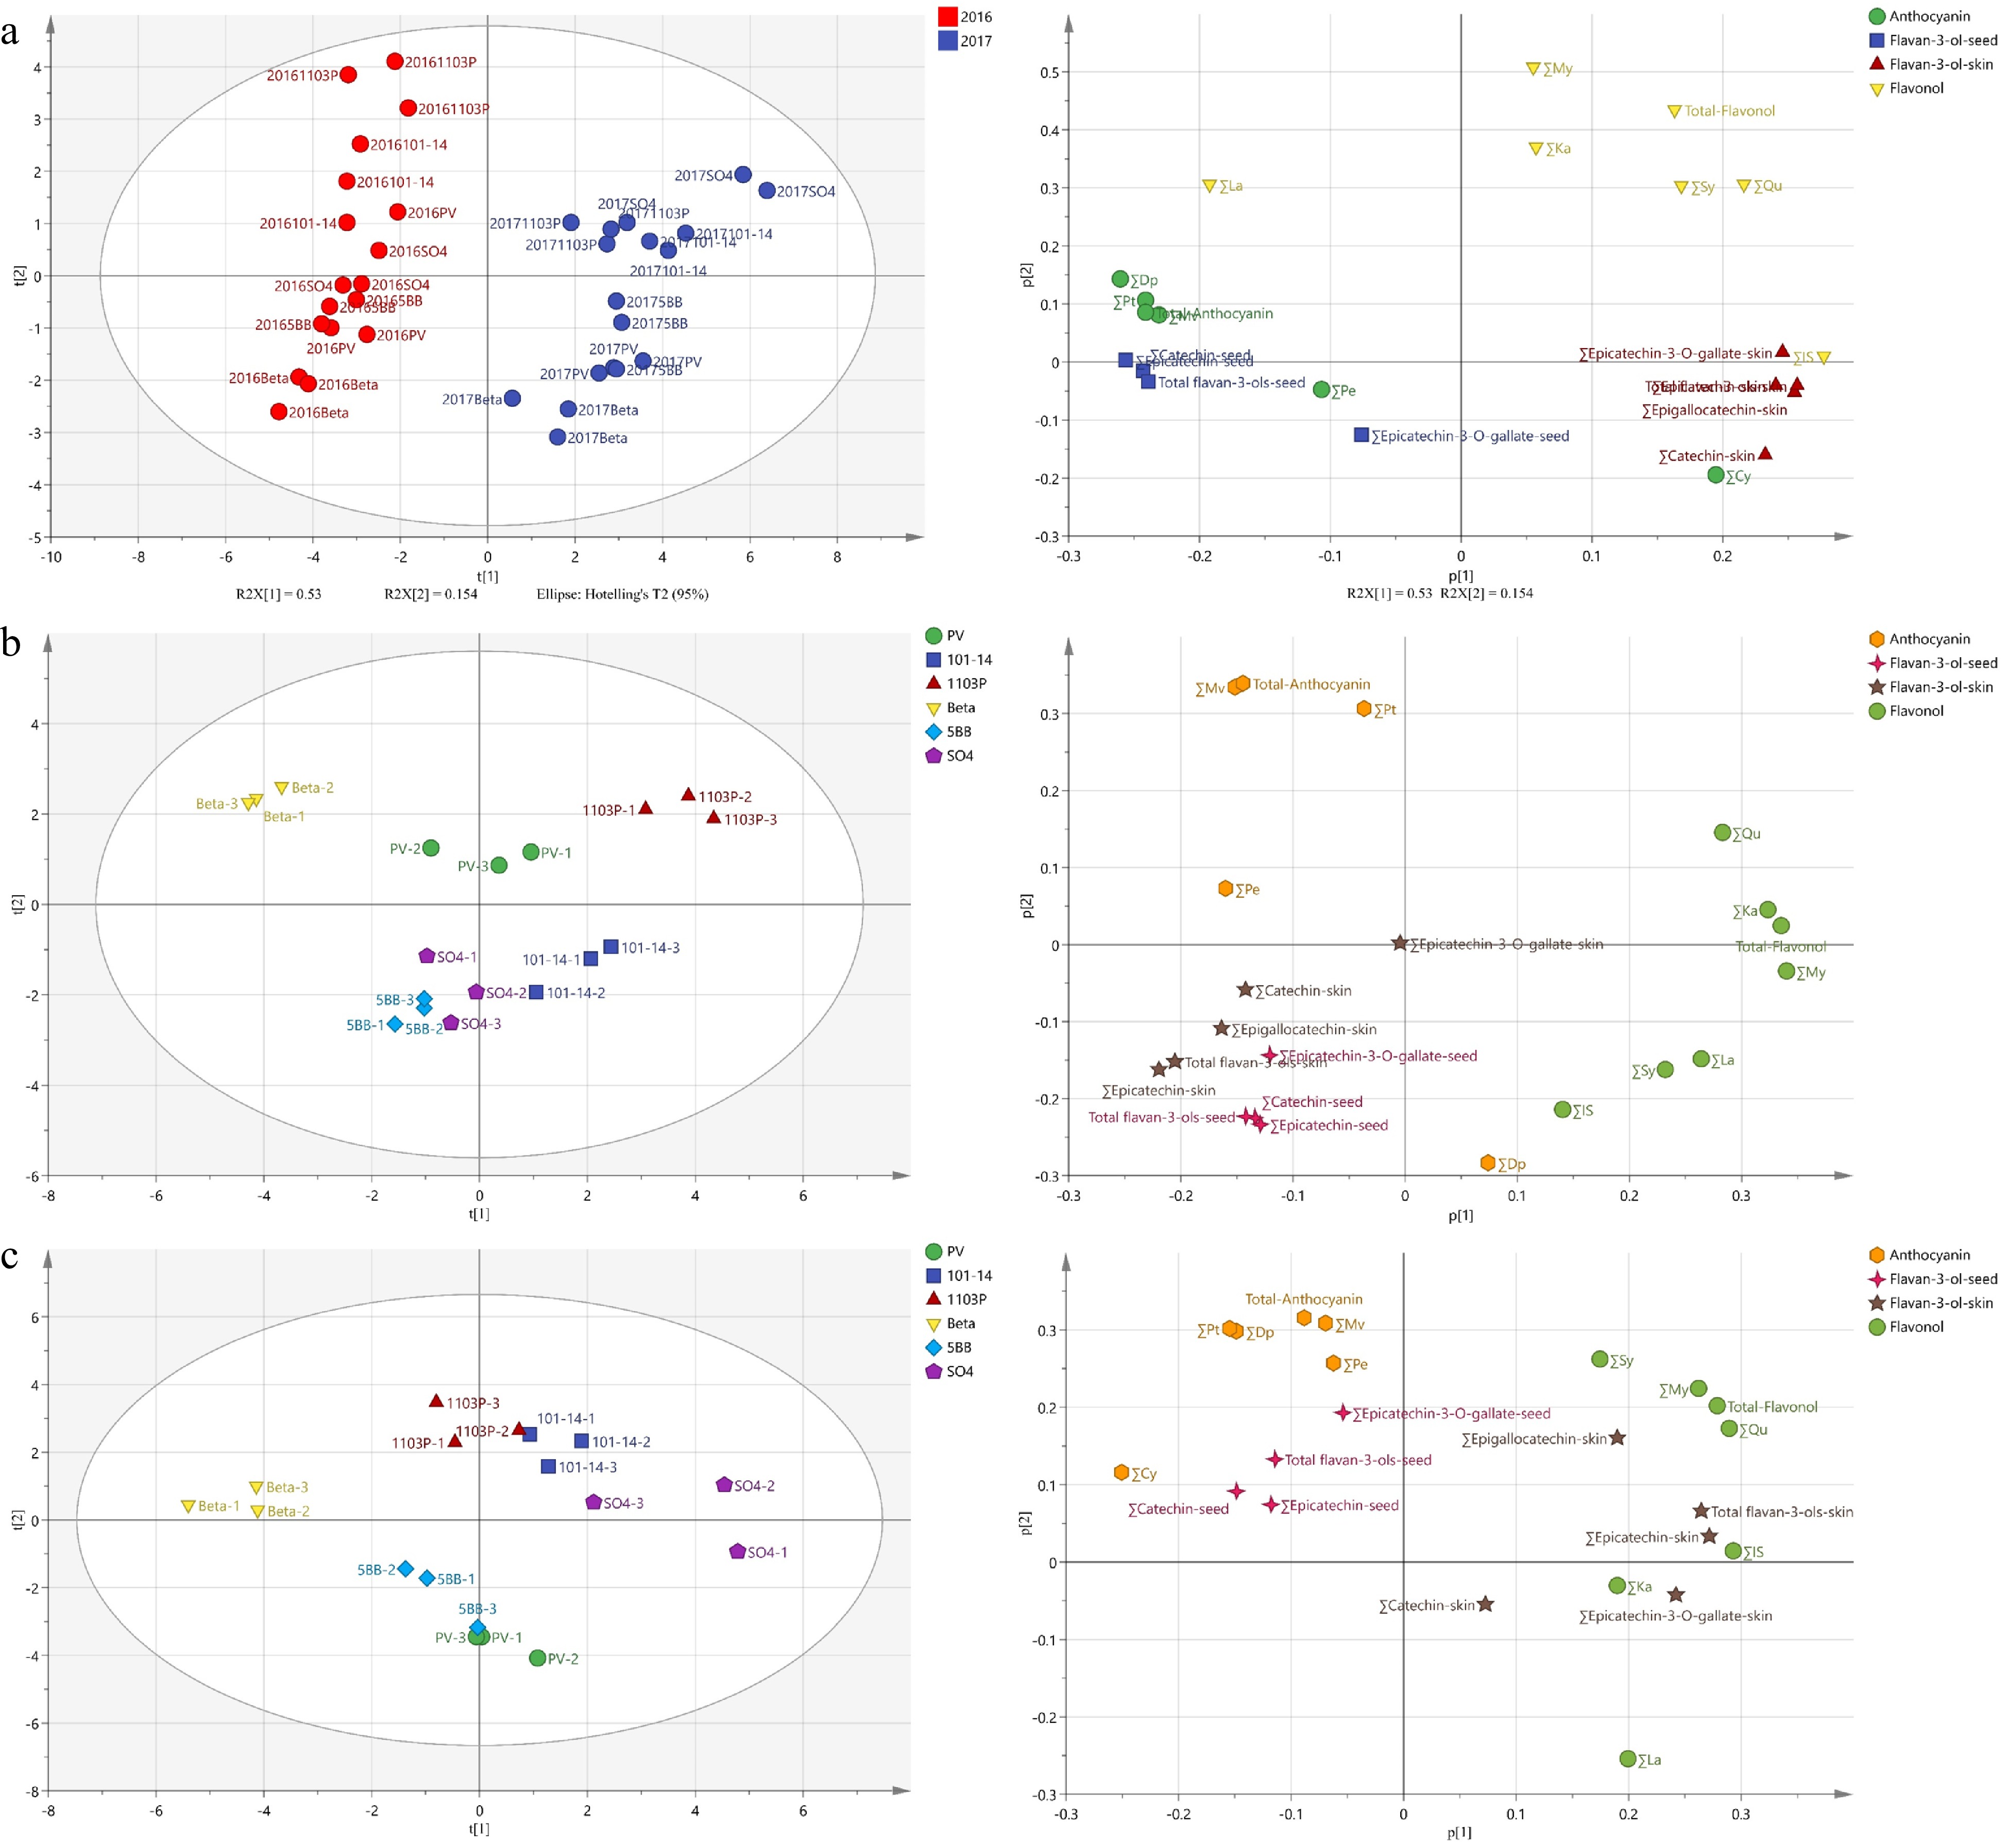
Figure 3.
(a) Principal component analysis (PCA) based on flavonoid compound concentrations in grape of 2016 and 2017, (b) grapes of 2016, (c) grapes of 2017. Left side is score plot and the right side is their corresponding loading plot. '∑', the total concentration of different types of flavonoid; 'Cy', cyanidin; 'Dp', delphinidin; 'Pn', peonidin; 'Pt', petunidin; 'Mv', malvidin; 'My', myricetin; 'Qu', quercetin; 'La', laricitrin; 'Ka', kaempferol; 'IS', isohamnetin; 'Sy', syringetin.
-
Year Month Mean May June July August September Mean daily temperature (°C) 2016 21.5 25.9 27.4 27.5 22.2 24.9 2017 23.3 25.6 27.9 26.2 23.0 25.2 Historical average (2008−2017) 21.9 24.5 27.5 26.4 22.1 24.5 Maximum daily temperature (°C) 2016 28.1 31.4 31.8 31.8 27.2 30.1 2017 29.7 31.7 32.3 31.1 28.4 30.7 Historical average (2008−2017) 27.9 30.4 32.1 31.1 27.3 29.8 Minimum daily temperature (°C) 2016 14.8 20.1 23.8 23.0 17.7 19.9 2017 16.3 19.4 24.0 22.2 17.7 19.9 Historical average (2008−2017) 15.7 18.4 23.4 22.3 17.3 19.4 Sunshine duration (h) 2016 281.9 224.4 153.4 218.7 201.5 281.9 2017 298.5 250.9 179 205.9 214.2 298.5 Historical average (2008−2017) 269.7 219.0 180.0 209.8 194.5 269.7 Precipitation (mm) 2016 24.0 72.9 344.3 76.8 59.0 115.4 2017 31.2 119.5 97.4 233.9 2.8 97.0 Historical average (2008−2017) 30.9 83.5 176.4 116.4 60.4 93.5 Table 1.
Meteorological conditions of the experimental vineyard from May to September in 2016−2017.
-
Source of variation Berry weight (g/100 berries) Total soluble solids (oBrix) pH Titratable acidity (g/L) Rootstock (R) PV 135.56 ± 12.30a 18.70 ± 2.69ab 3.00 ± 0.19b 11.14 ± 3.04 PV/101-14MGt 146.47 ± 6.61 19.46 ± 1.57ab 3.06 ± 0.51ab 10.95 ± 0.84 PV/1103P 164.77 ± 11.92 18.98 ± 1.16ab 3.08 ± 0.41ab 11.26 ± 2.76 PV/Beta 168.34 ± 58.71 20.32 ± 1.38a 3.13 ± 0.14a 9.23 ± 1.96 PV/5BB 197.57 ± 77.01 18.28 ± 1.58b 3.09 ± 0.11ab 10.47 ± 1.36 PV/SO4 179.12 ± 65.70 18.43 ± 0.87b 3.05 ± 0.73ab 10.44 ± 1.75 Vintage (V) 2016 182.73 ± 64.24a 19.97 ± 1.16a 3.13 ± 0.10a 10.15 ± 2.23 2017 147.69 ± 15.26b 18.10 ± 1.61b 3.00 ± 0.09b 11.10 ± 1.83 Significanceb R 0.321 0.115 0.171 0.428 V 0.047 0.000 0.000 0.179 R × V 0.611 0.204 0.032 0.255 a Data are expressed as means of three replicates, and different letters within the same column indicate significant differences among the rootstocks or vintages in accordance with Duncan’s test (p < 0.05). b Two-way ANOVA tests for significance of the differences of rootstock × vintage interaction. Table 2.
Physicochemical parameters of mature berries on different rootstocks in the two seasons (2016−2017).
Figures
(3)
Tables
(2)