-
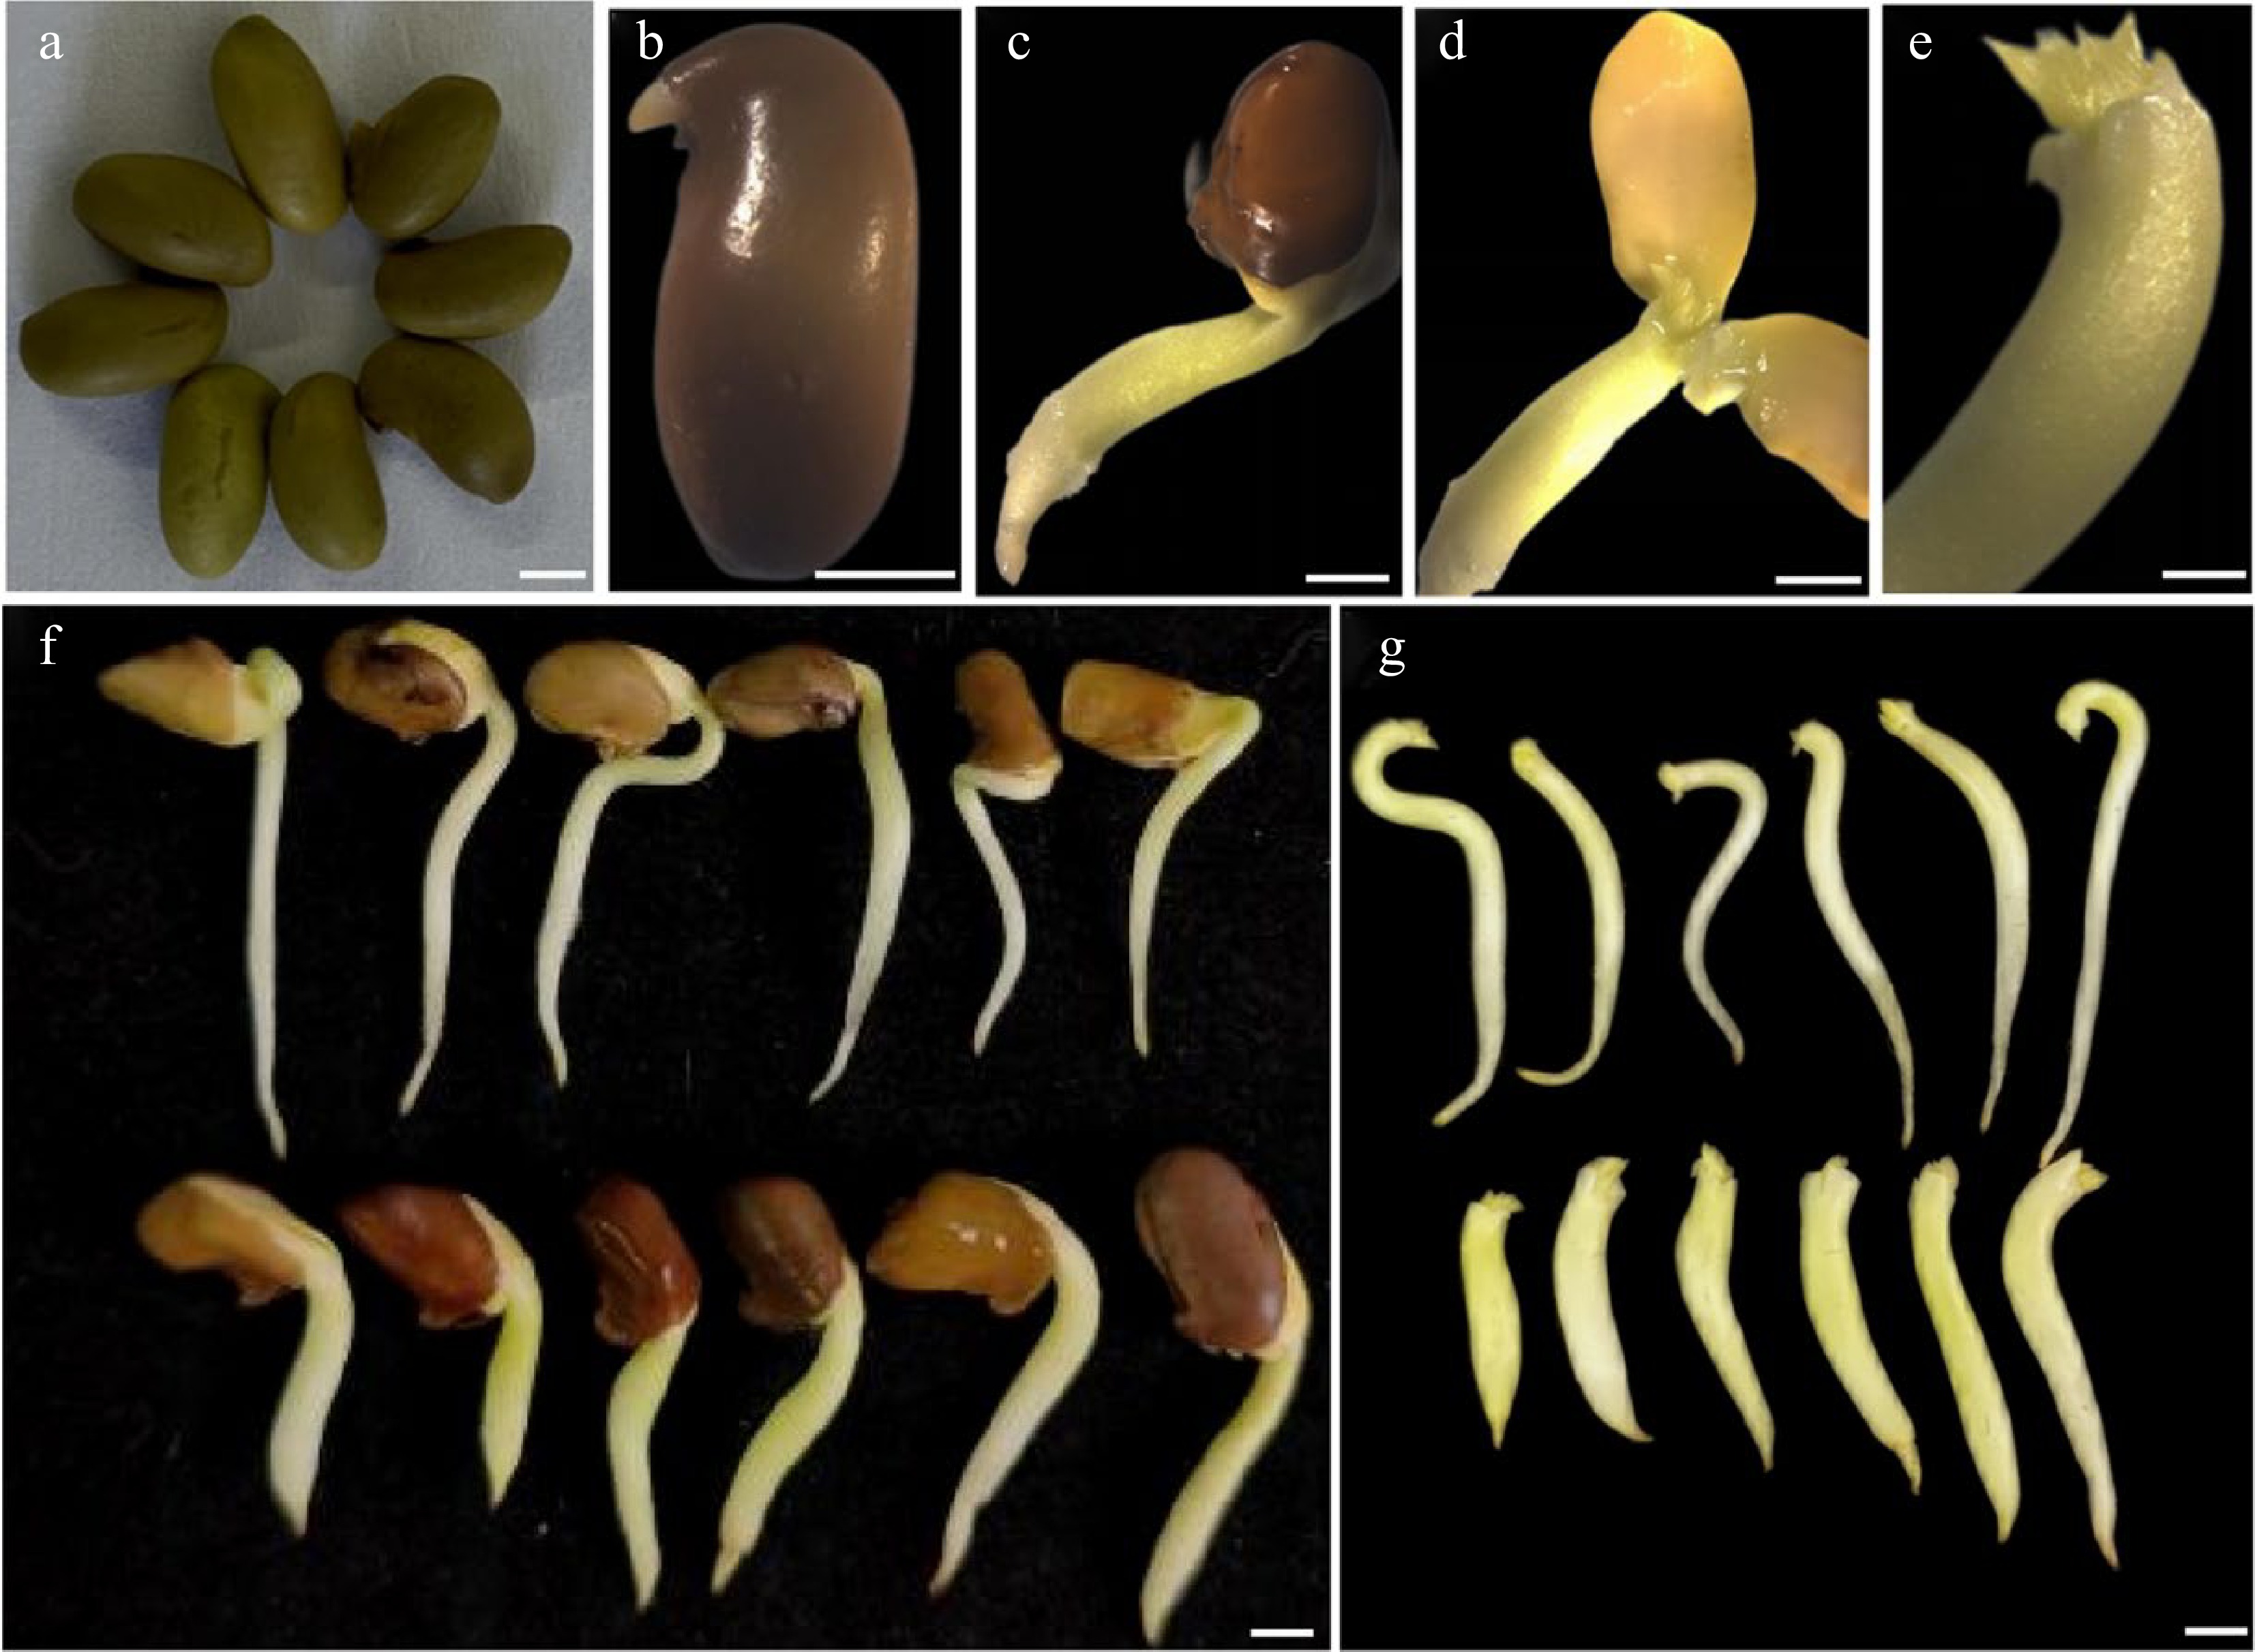
Figure 1.
The enlarged embryonic tip explants after pre-treatment of the seeds of C. korshinskii. (a) Freshly sterilized seeds of C. korshinskii. (b) - (d) Embryonic tip explant preparation. (e) The 'enlarged' explants. (f), (g) Comparison of the phenotype of the germinating seeds between untreated (the upper panel of the photographs) and cytokinin-treated ones (the lower panel of photographs). Bar = 2 mm.
-
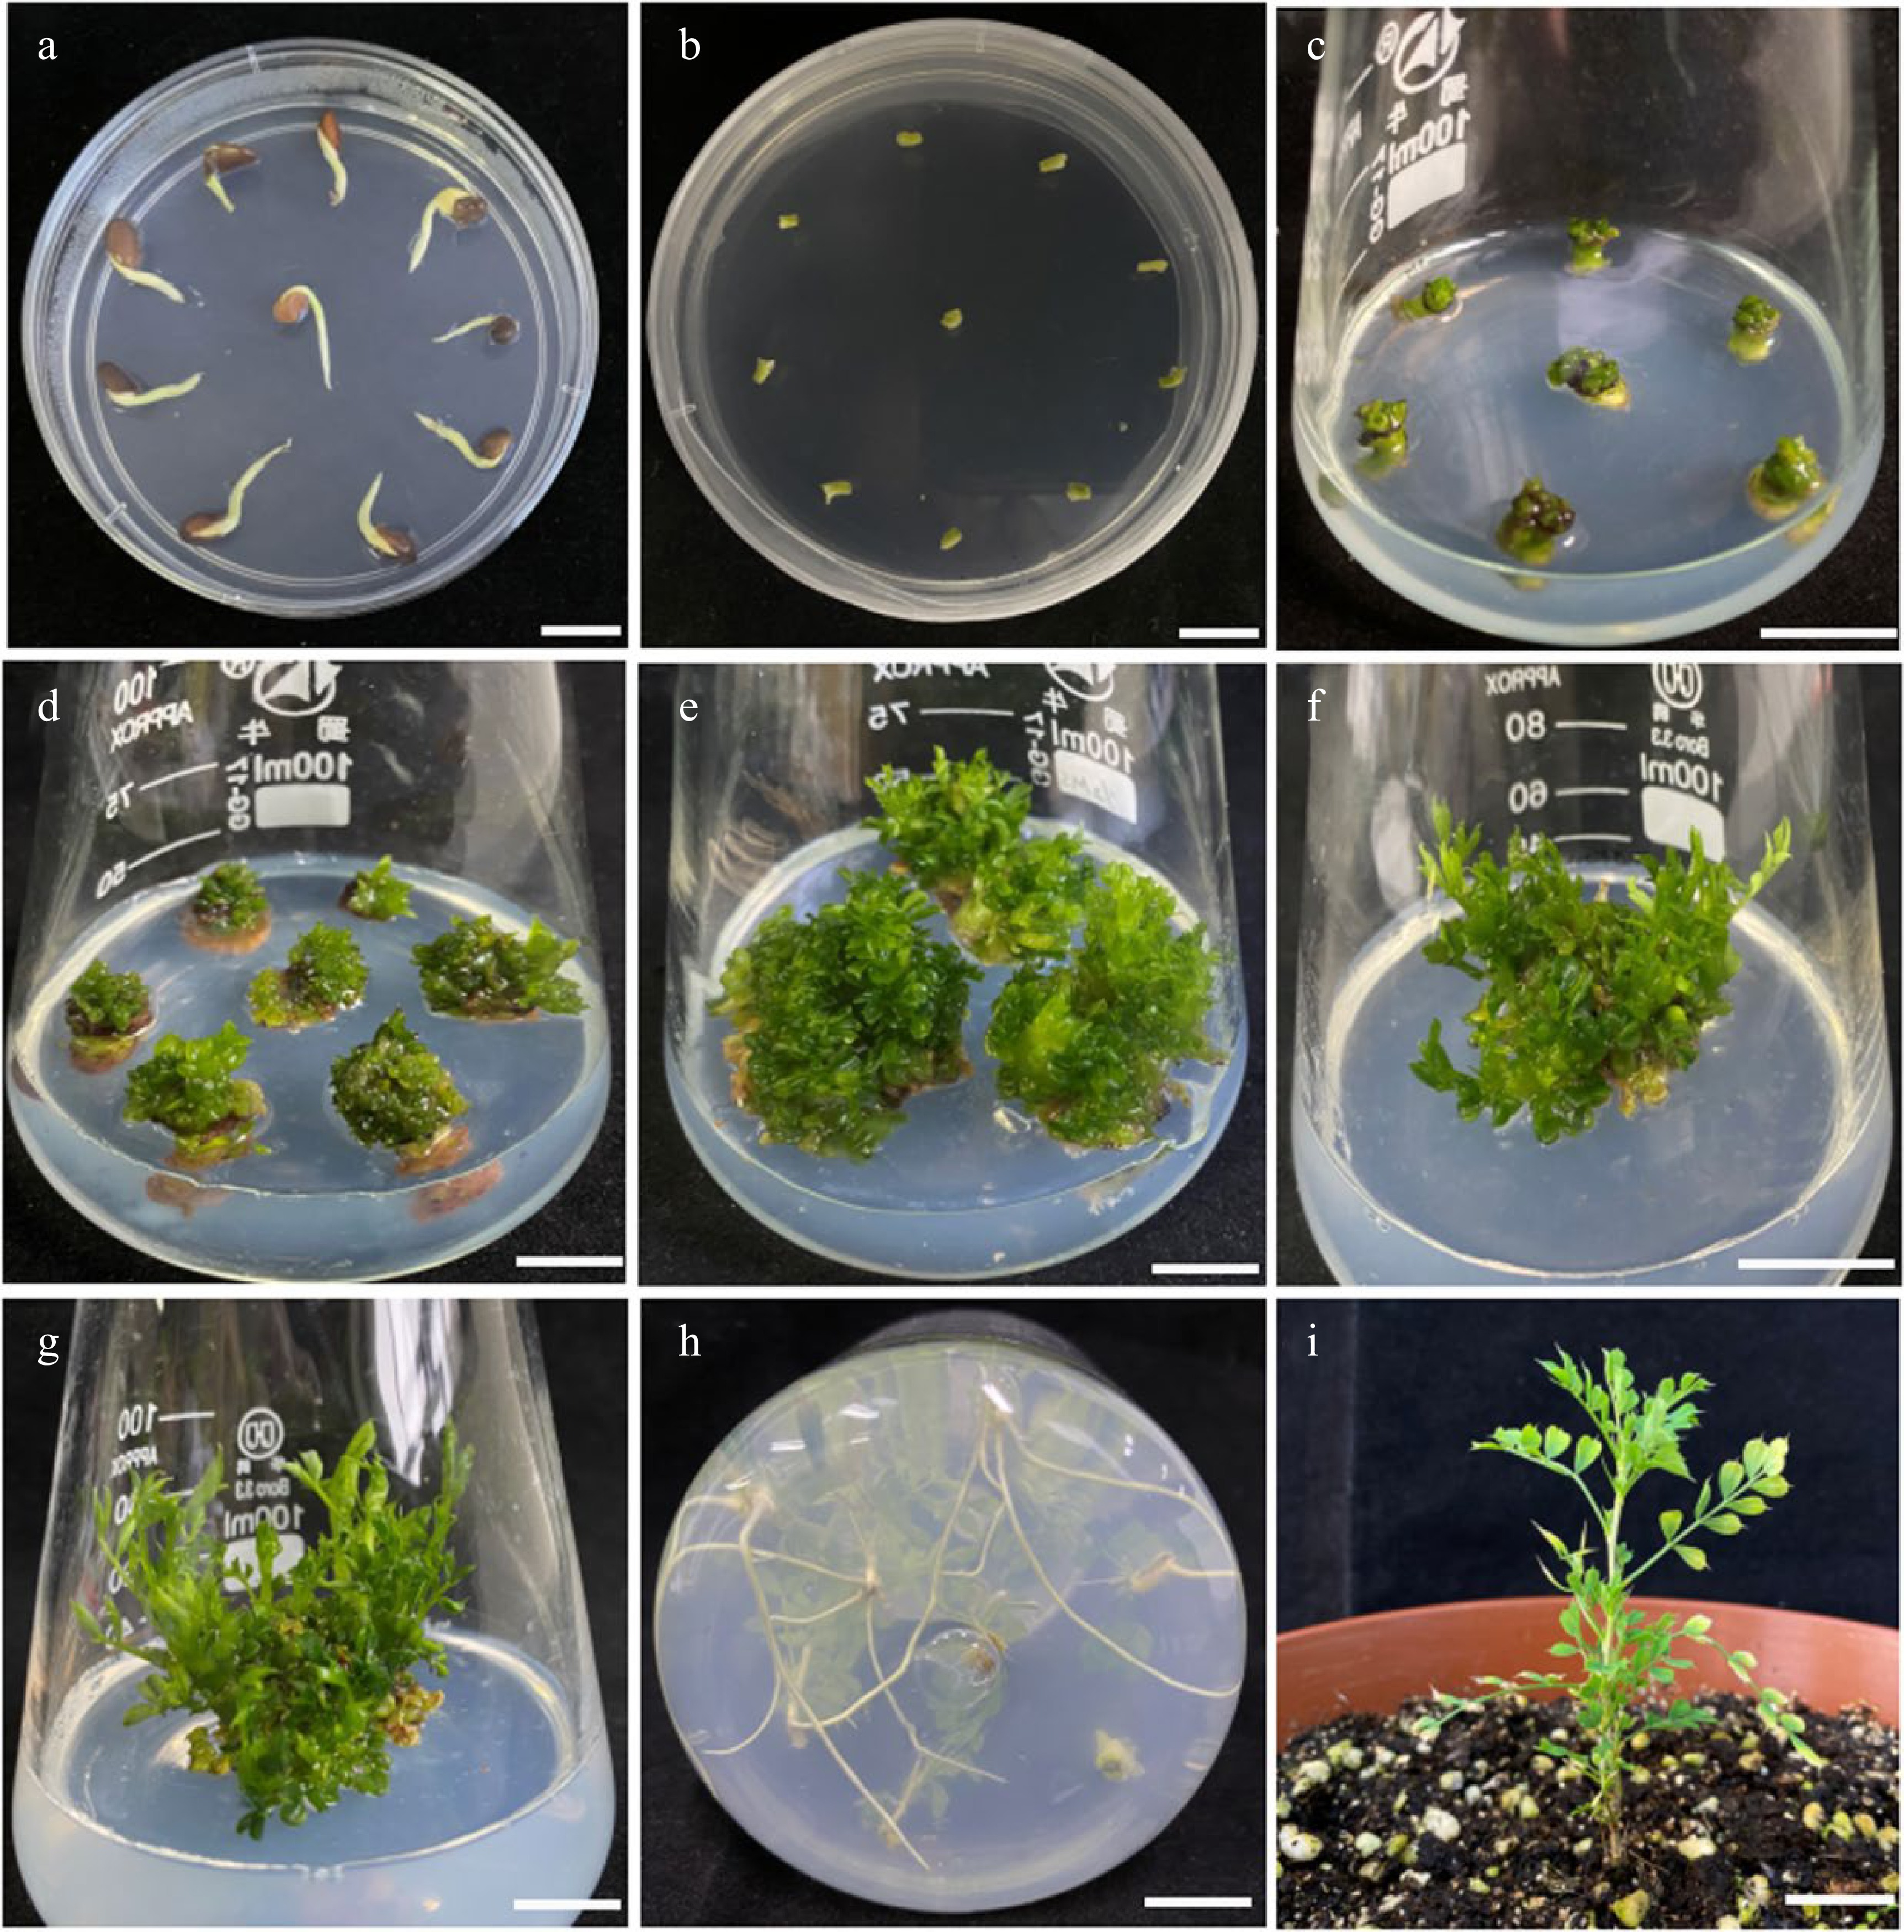
Figure 2.
The complete process of the regeneration system from embryonic tip of C. korshinskii in vitro. (a) Pre-treated germinating seeds of C. korshinskii. (b) The embryonic tips begin to turn green and to enlarge. (c) Adventitious buds induction after priming. (d) Successful induction of adventitious buds. (e) 'Storm-like' adventitious buds. (f) First step elongation of the adventitious buds. (g) Second step elongation of the adventitious buds. (h) Adventitious roots induction. (i) Healthy seedlings after transferring into soil for 40 d. Bar = 1 cm.
-
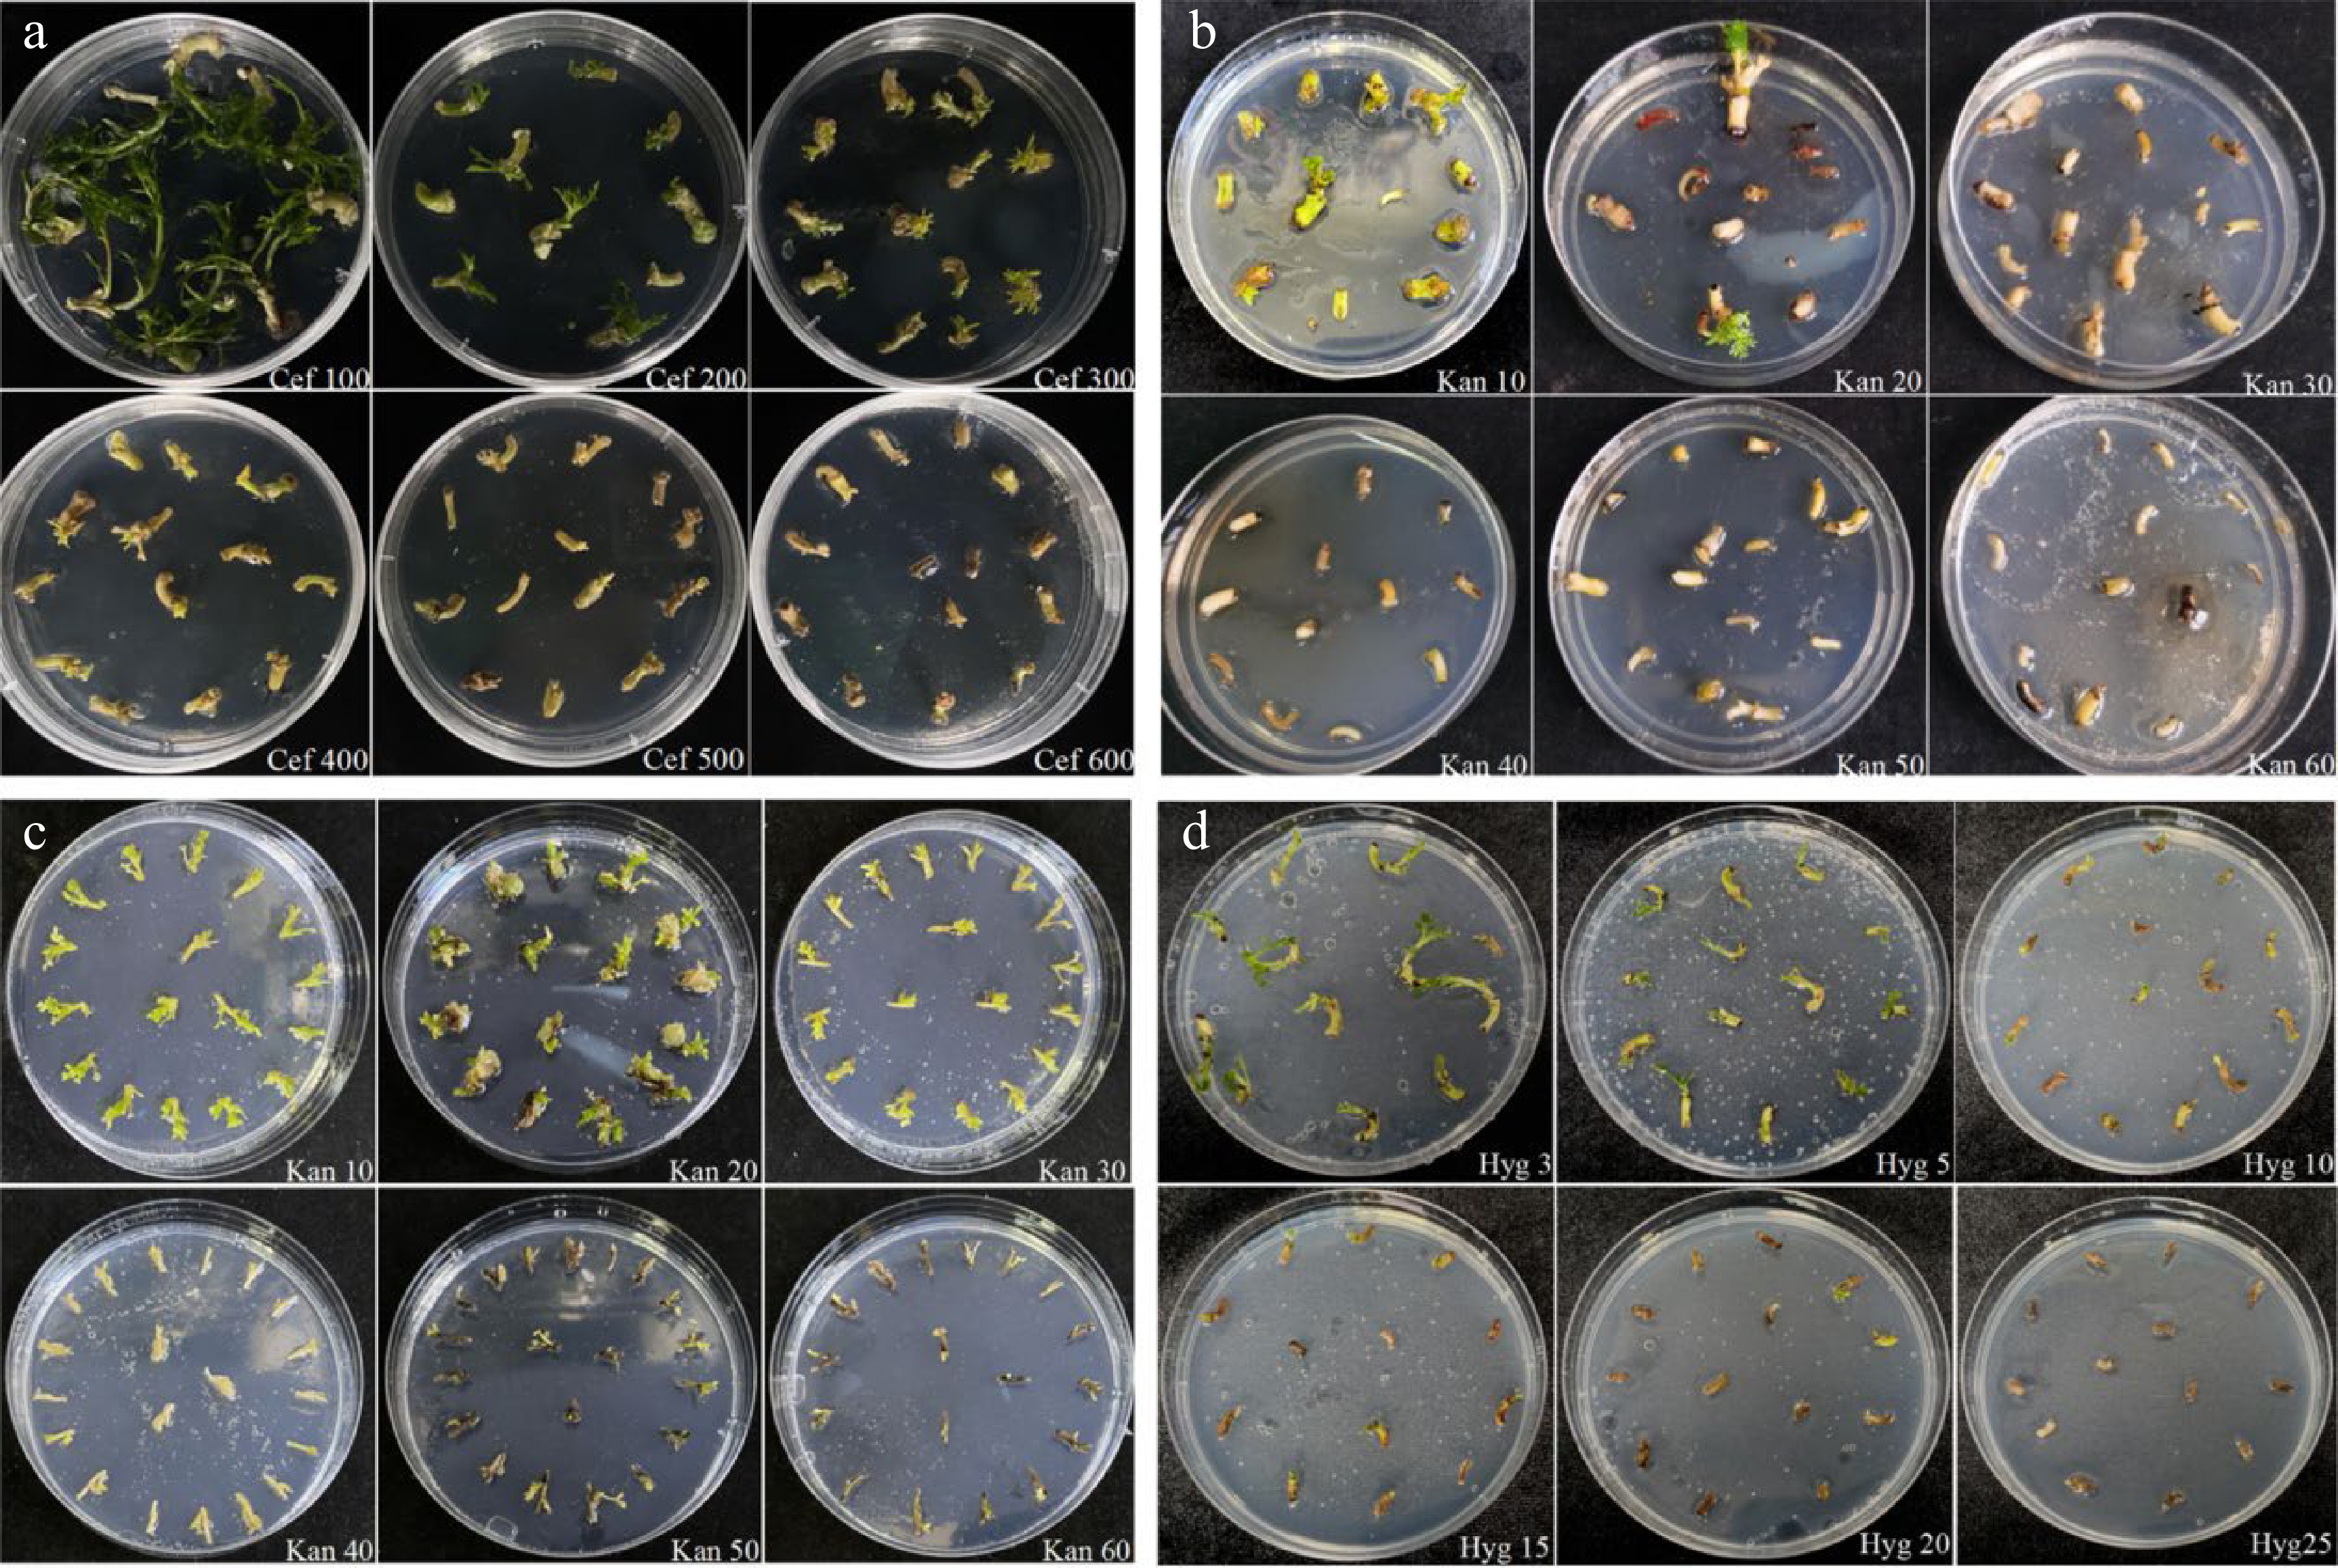
Figure 3.
Effects of cefotaxime, kanamycin and hygromycin on growth of explants. (a) Growth status of the embryonic tips in response to different concentrations of cefotaxime. (b) Growth status of the embryonic tips after being treated with various concentrations of kanamycin. (c) Growth status of the regenerated shoots under gradient concentrations of kanamycin. (d) Growth status of the embryonic tips after being treated with various concentrations of hygromycin.
-
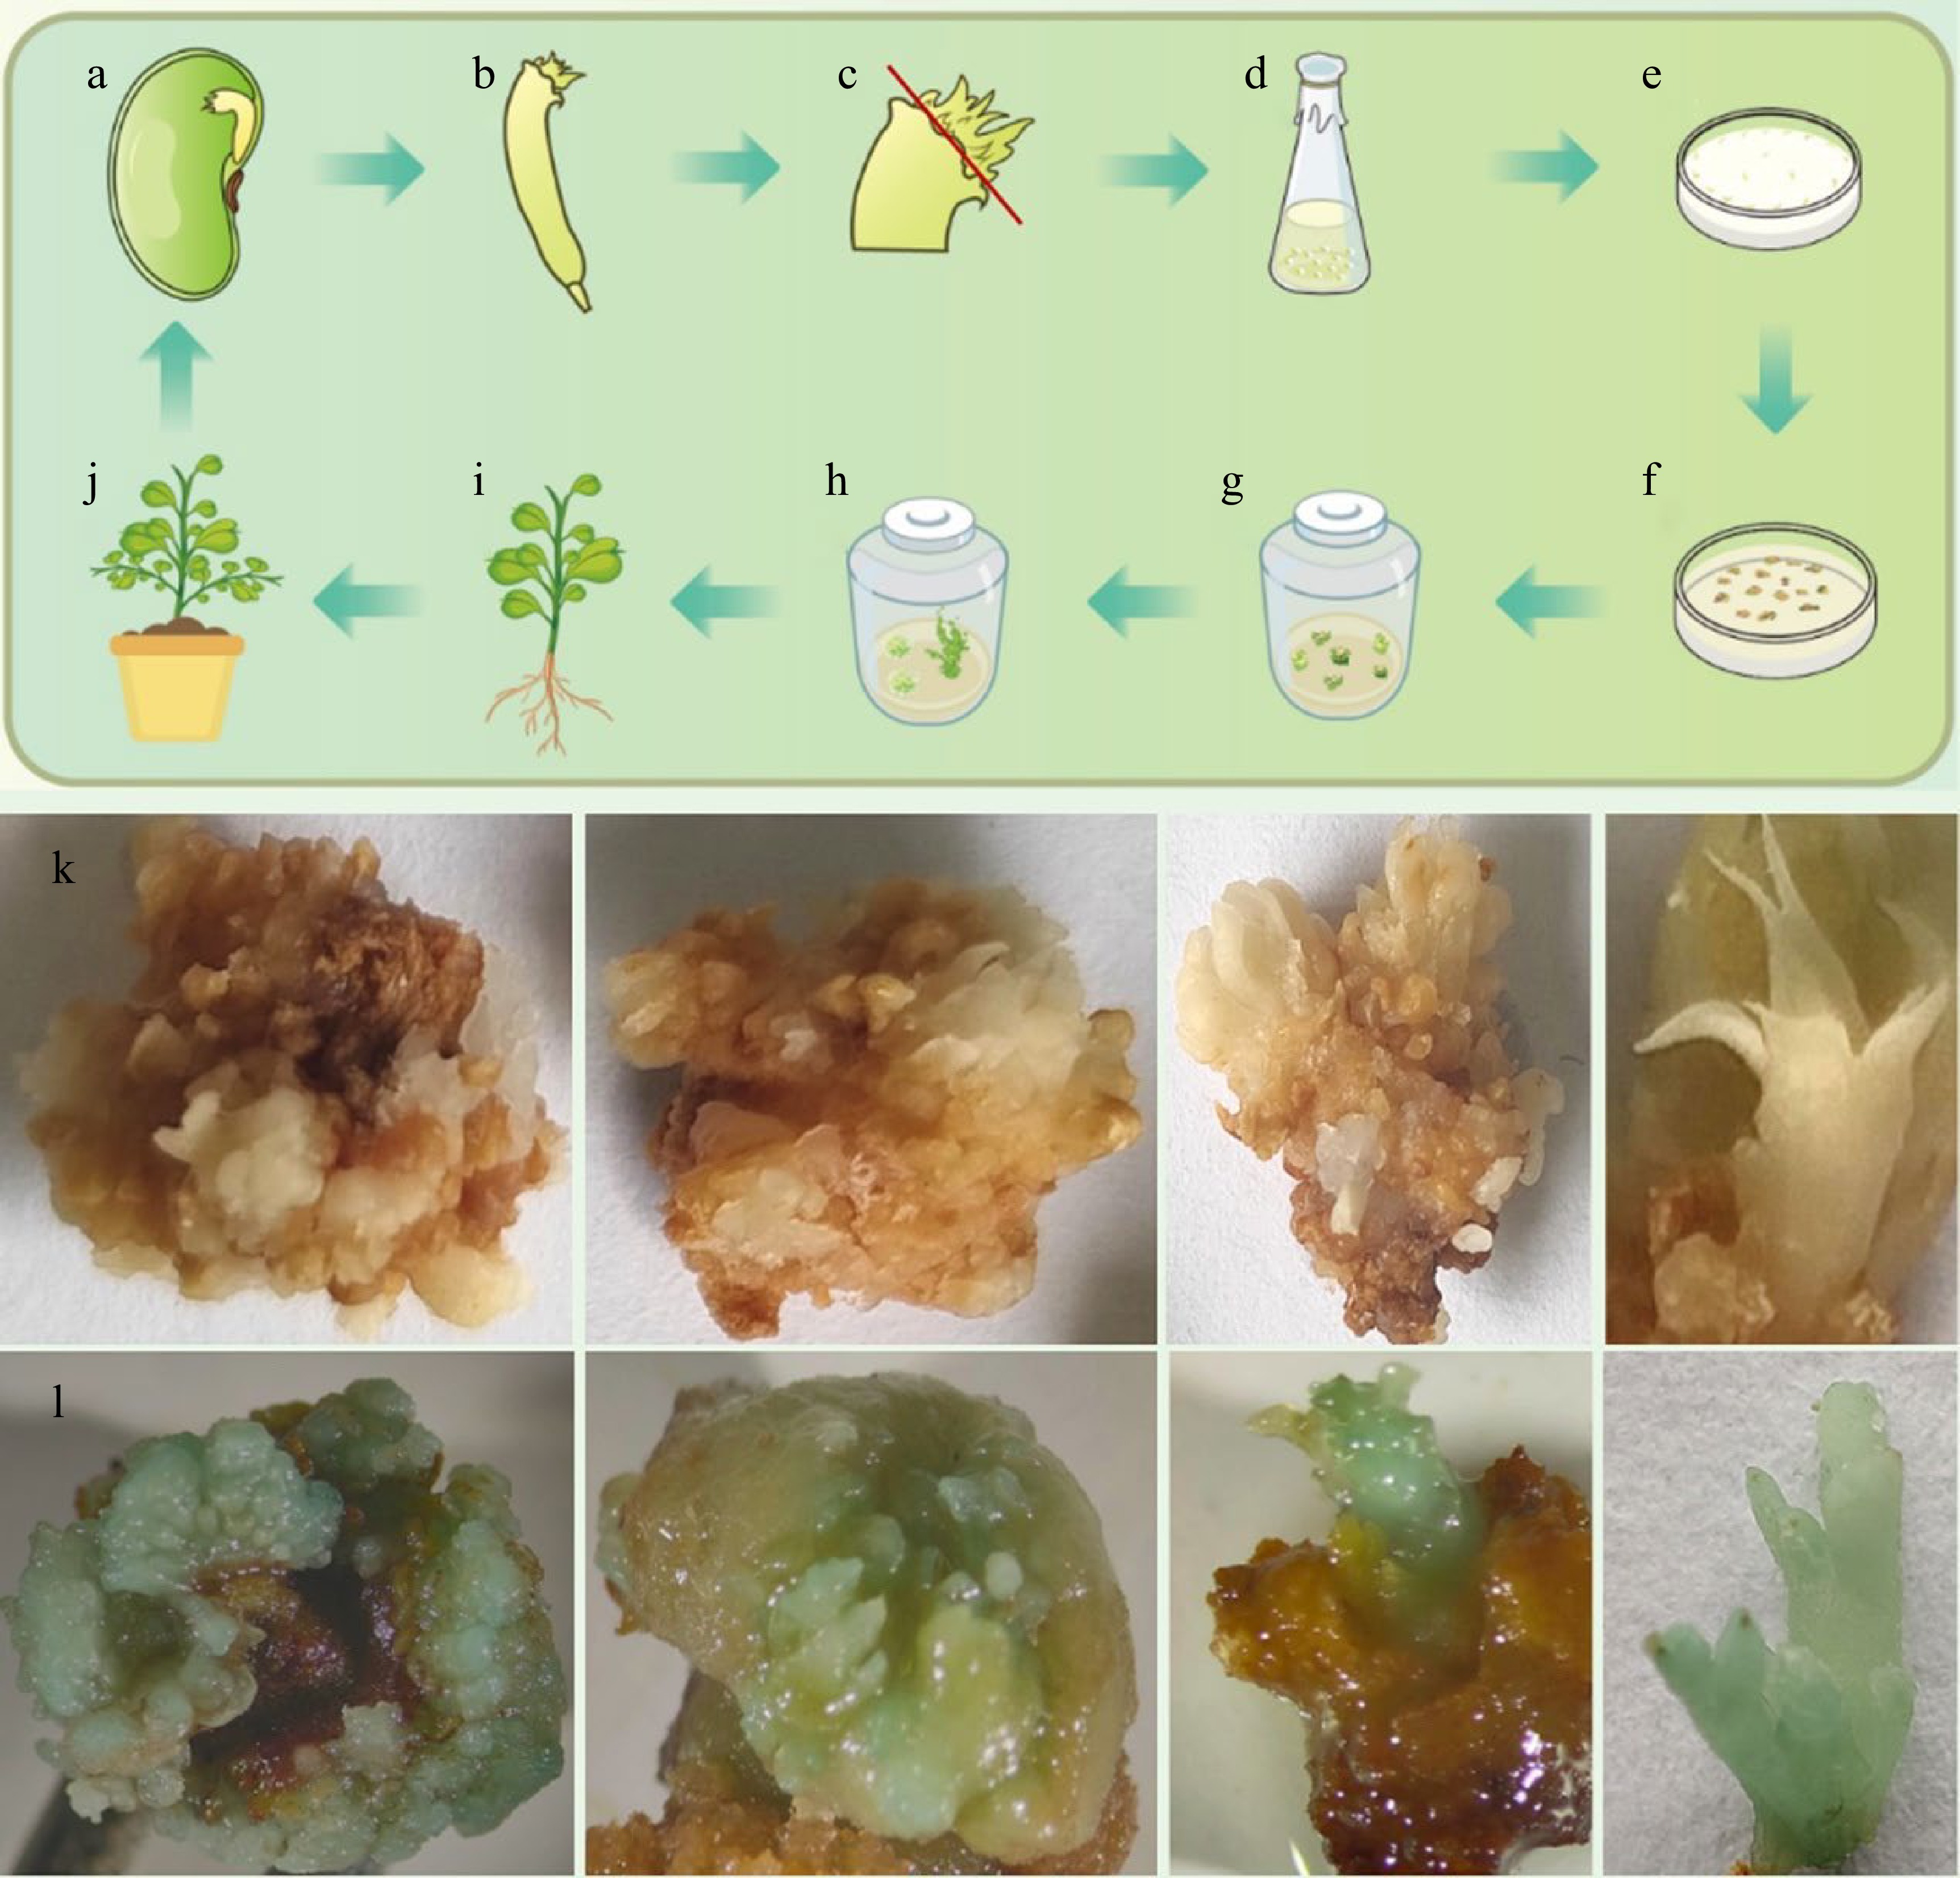
Figure 4.
Schematic illustration of embryonic tip transformation system and GUS staining results in C. korshinskii. In the schematic of genetic transformation ((a)−(j), upper panel), the plumule is removed from the red line. (k) Pictures of GUS staining from the un-transformed calli and buds. (l) Pictures of GUS staining from the transformed calli and buds.
-
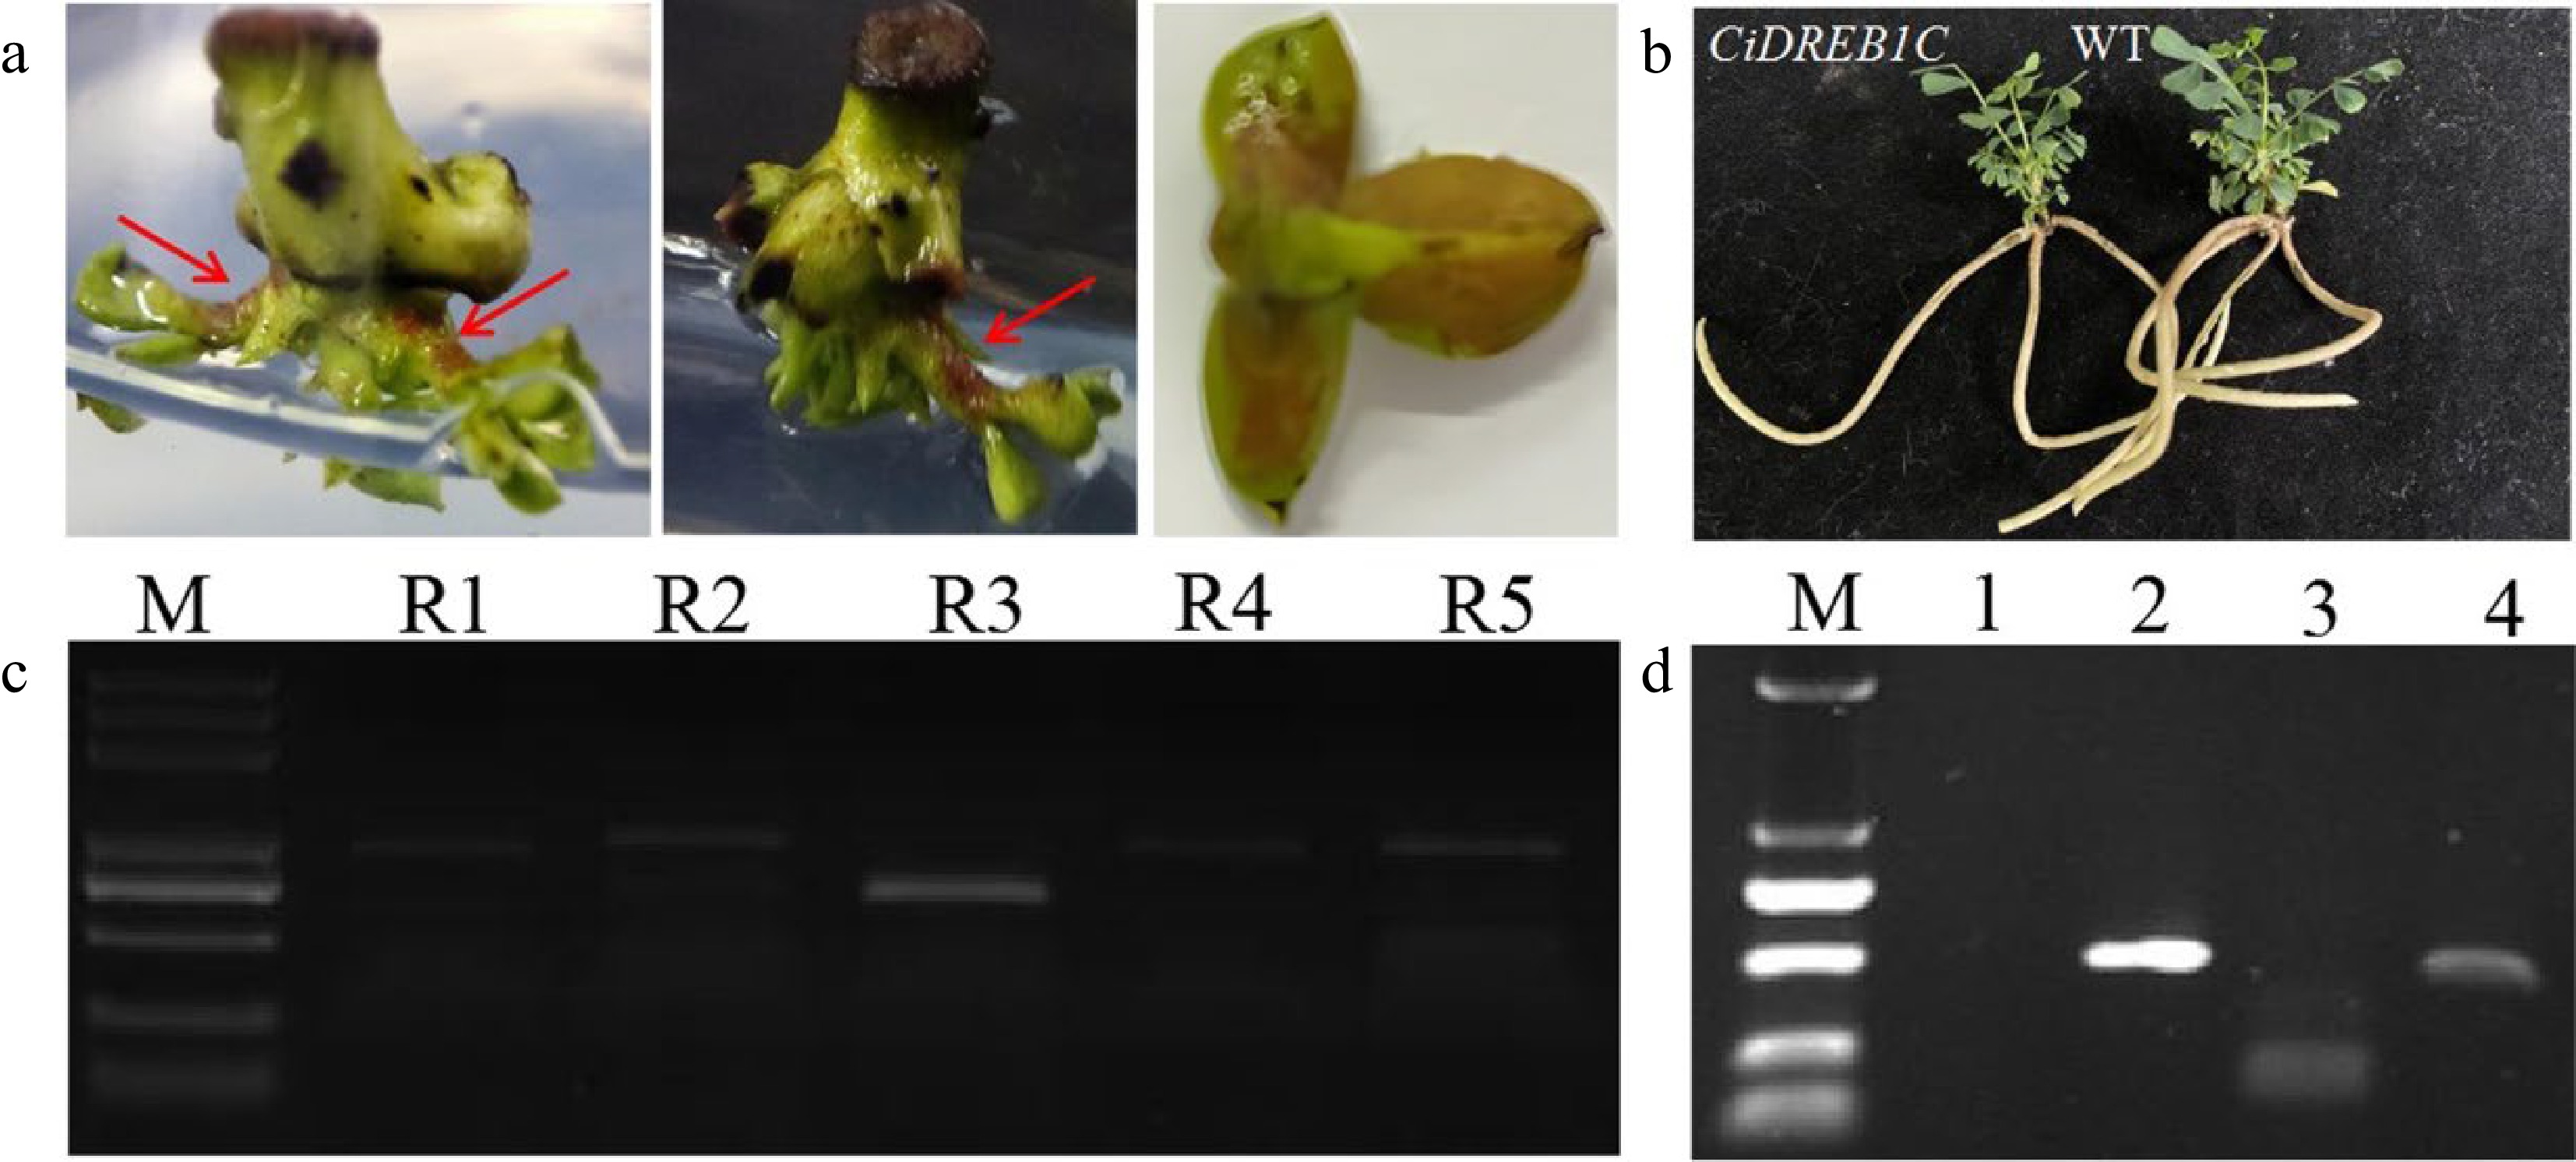
Figure 5.
Accumulation of betalain in transgenic C. korshinskii buds and PCR detection of the RUBY and CiDREB1C genes. (a) Phenotype of RUBY-positive buds, as indicated by the red arrows. (b) CiDREB1C transgenic plants and the negative control (WT). (c) Eletrophoresis results of the PCR products from RUBY in the positive transgenic buds; Lane R1-R5, the PCR products from the five segments of RUBY. M, molecular weight marker (DL5000). (d) Electrophoresis results of the PCR products from CiDREB1C in the positive transgenic seedlings and wild type control; M, molecular weight marker (DL2000). Lane 1: negative control, PCR products for the Kan gene (lane 2), the NOS terminator (lane 3), and the CaMV35S promoter (lane 4).
-
6-BA concentration
(mg·L−1)Induction rate of adventitious buds (%) Average number of adventitious buds 0 8.89 ± 0.02e 2.72 ± 0.25e 1 30.00 ± 0.07d 3.80 ± 0.18d 2 52.22 ± 0.05c 5.14 ± 0.38c 3 77.78 ± 0.07a 8.19 ± 0.29a 4 63.33 ± 0.06b 5.75 ± 0.24b 5 48.89 ± 0.07c 4.71 ± 0.25c 6 31.11 ± 0.02d 4.18 ± 0.17d Values represent the mean ( ± standard error) of three independent experiments. Different letters of the same column indicate significant differences at P < 0.05. Table 1.
Effect of different 6-BA concentrations on the induction rate of adventitious buds from embryonic tip explants.
-
Treatments Hormones and concentrations (mg·L−1) Elongation
rate (%)6-BA NAA 1 0 0 6.03 ± 0.04d 2 0.3 0.03 30.50 ± 0.07bc 3 0.5 0.05 41.43 ± 0.06b 4 0.7 0.07 59.49 ± 0.05a 5 1.0 0.10 67.92 ± 0.08a 6 2.0 0.20 26.11 ± 0.06c Values represent the mean ( ± standard error) of three independent experiments. Different letters of the same column indicate significant differences at P < 0.05. Table 2.
Effect of different combinations of 6-BA and NAA on the elongation of adventitious buds.
-
Treatments NAA concentration
(mg·L-1)Number of
explantsRooting rate
(%)1 0 90 0d 2 0.5 90 41.11 ± 0.18bc 3 1 90 78.89 ± 0.15a 4 2 90 55.56 ± 0.14ab 5 3 90 28.89 ± 0.08c Values represent the mean ( ± standard error) of three independent experiments. Different letters of the same column indicate significant differences at P < 0.05. Table 3.
Effect of NAA concentrations on adventitious roots induction.
Figures
(5)
Tables
(3)