-
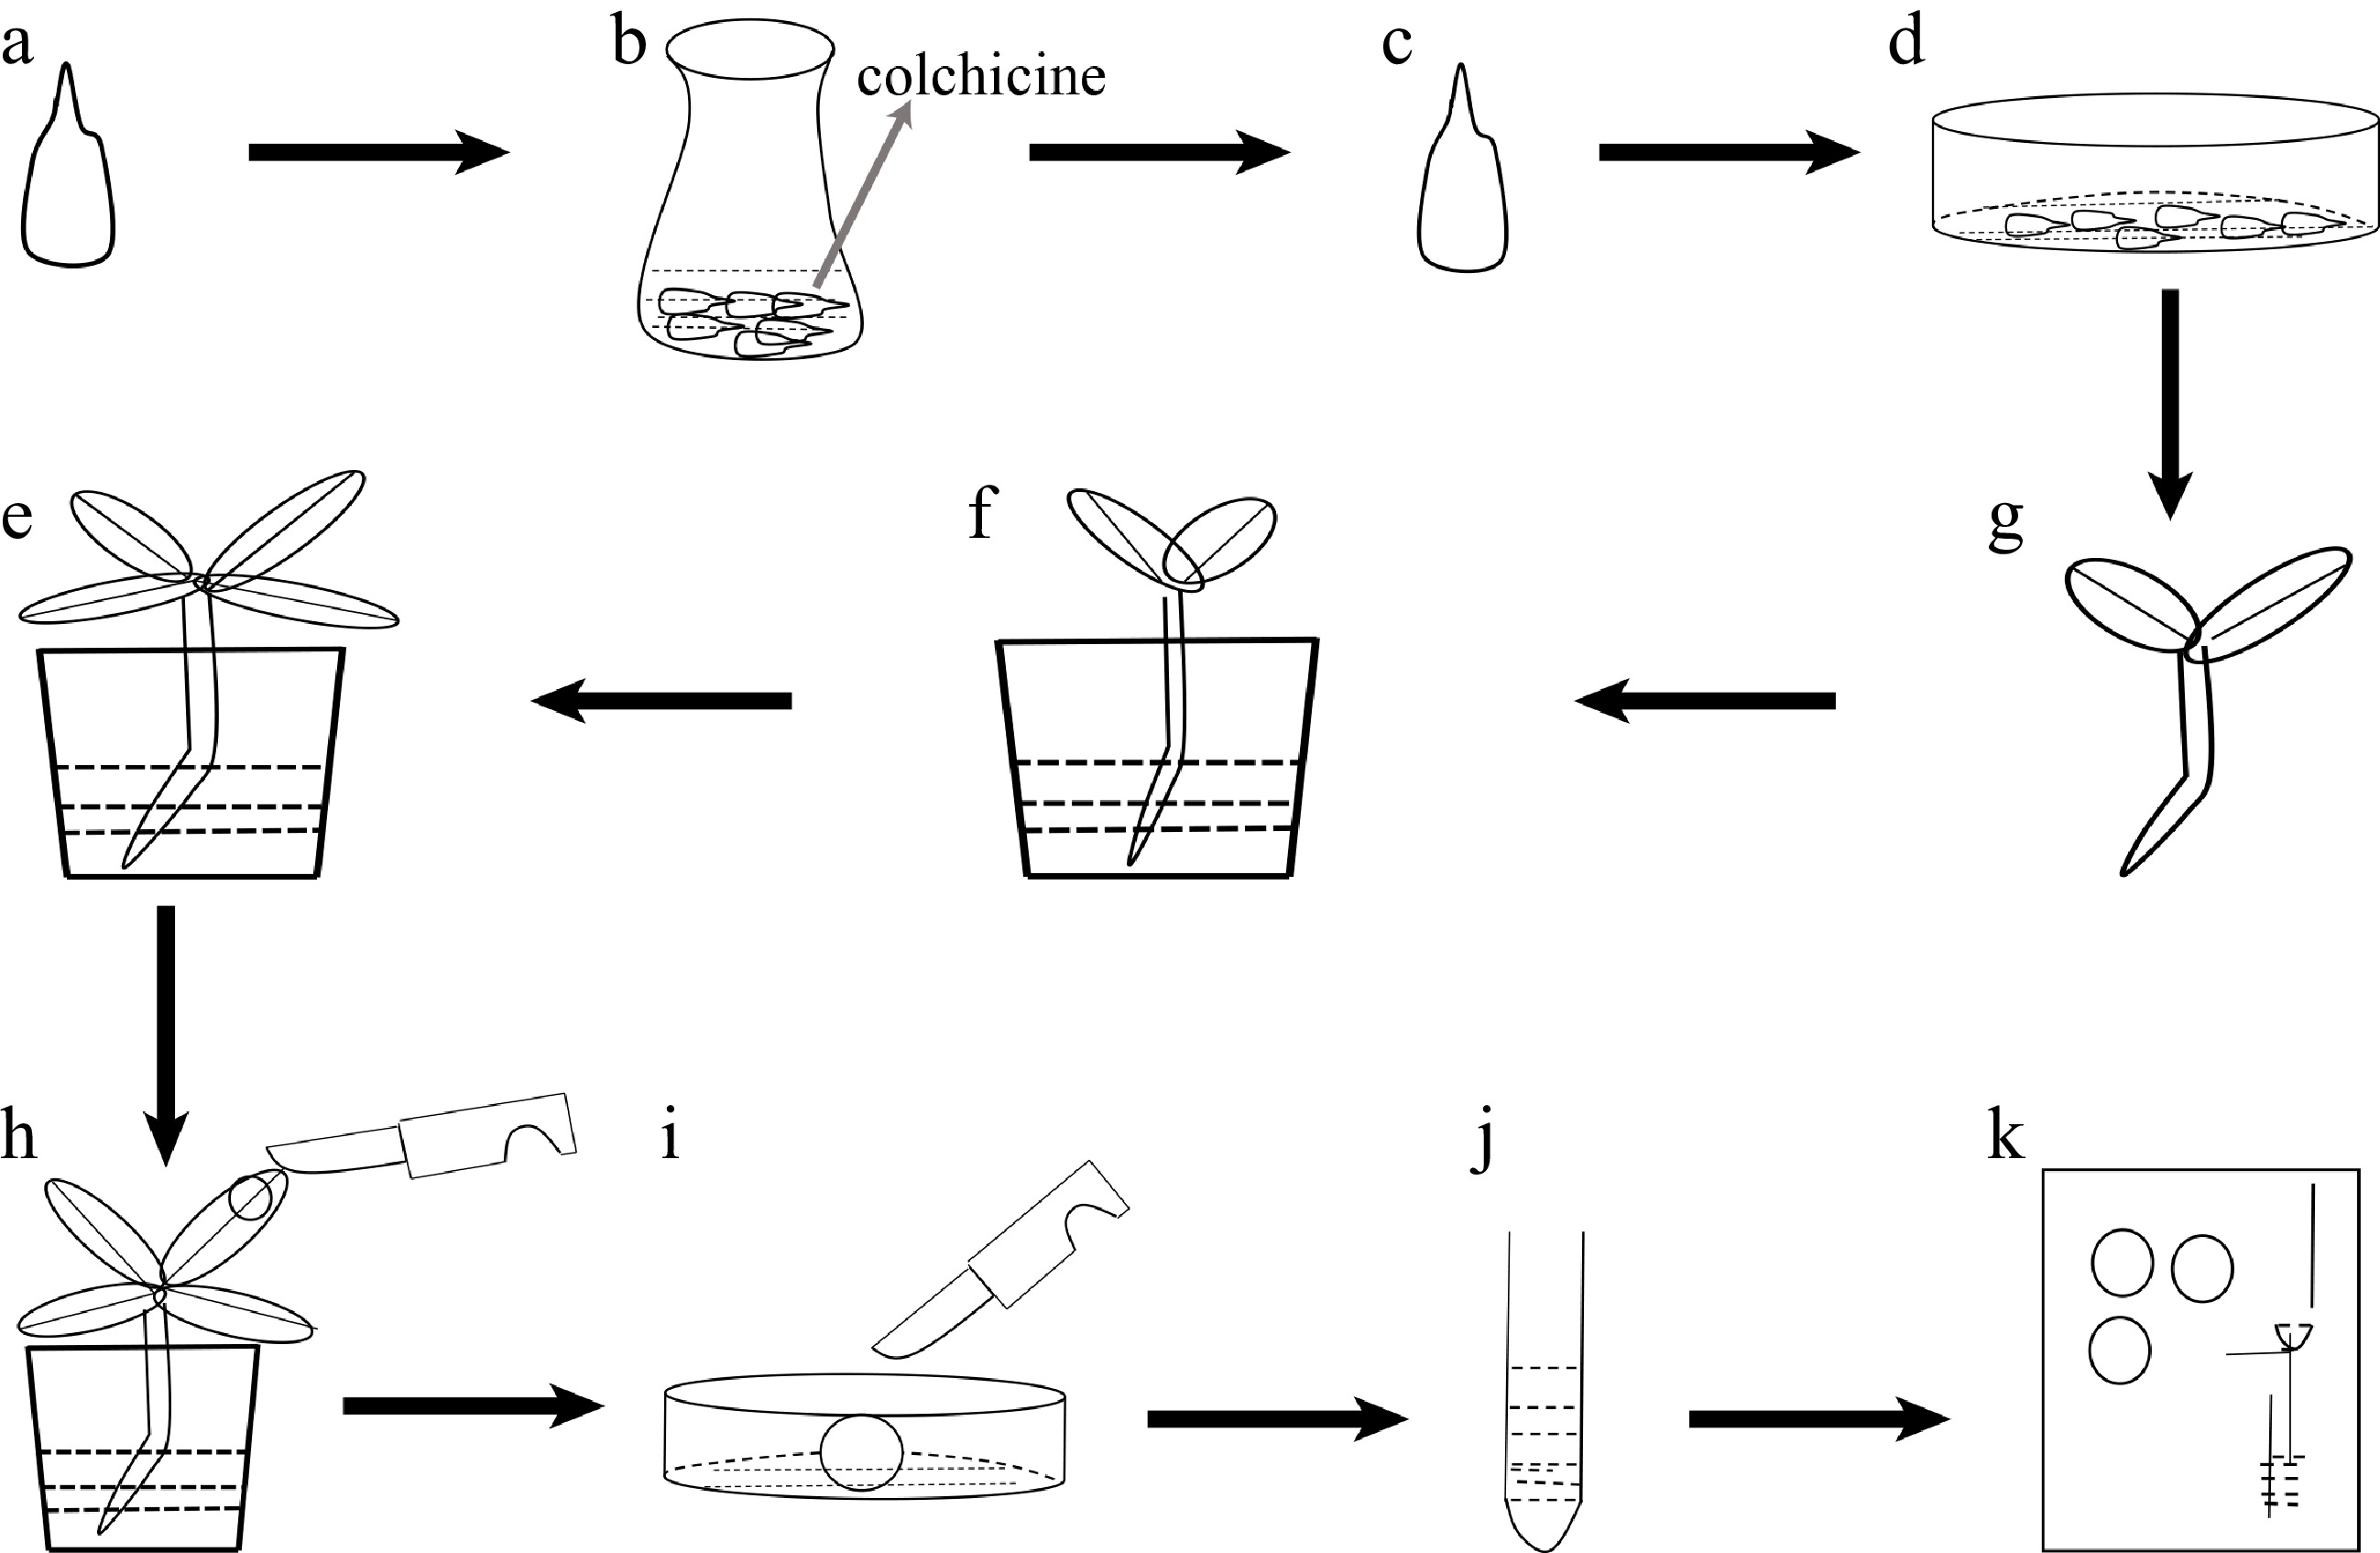
Figure 1.
Flow-process diagram of inducing polyploidy from pear seeds treated with colchicine. (a) Pear seeds; (b) pear seeds soaking in colchicine solution; (c) seeds treated with colchicine solution; (d) seeds spread in plastic Petri dishes; (e) seedlings; (f) seedlings transplanted into soil; (g) plant growth; (h) collected leaf samples; (i) chopped leaves; (j) samples to be tested after centrifugation; (k) flow cytometry assay.
-
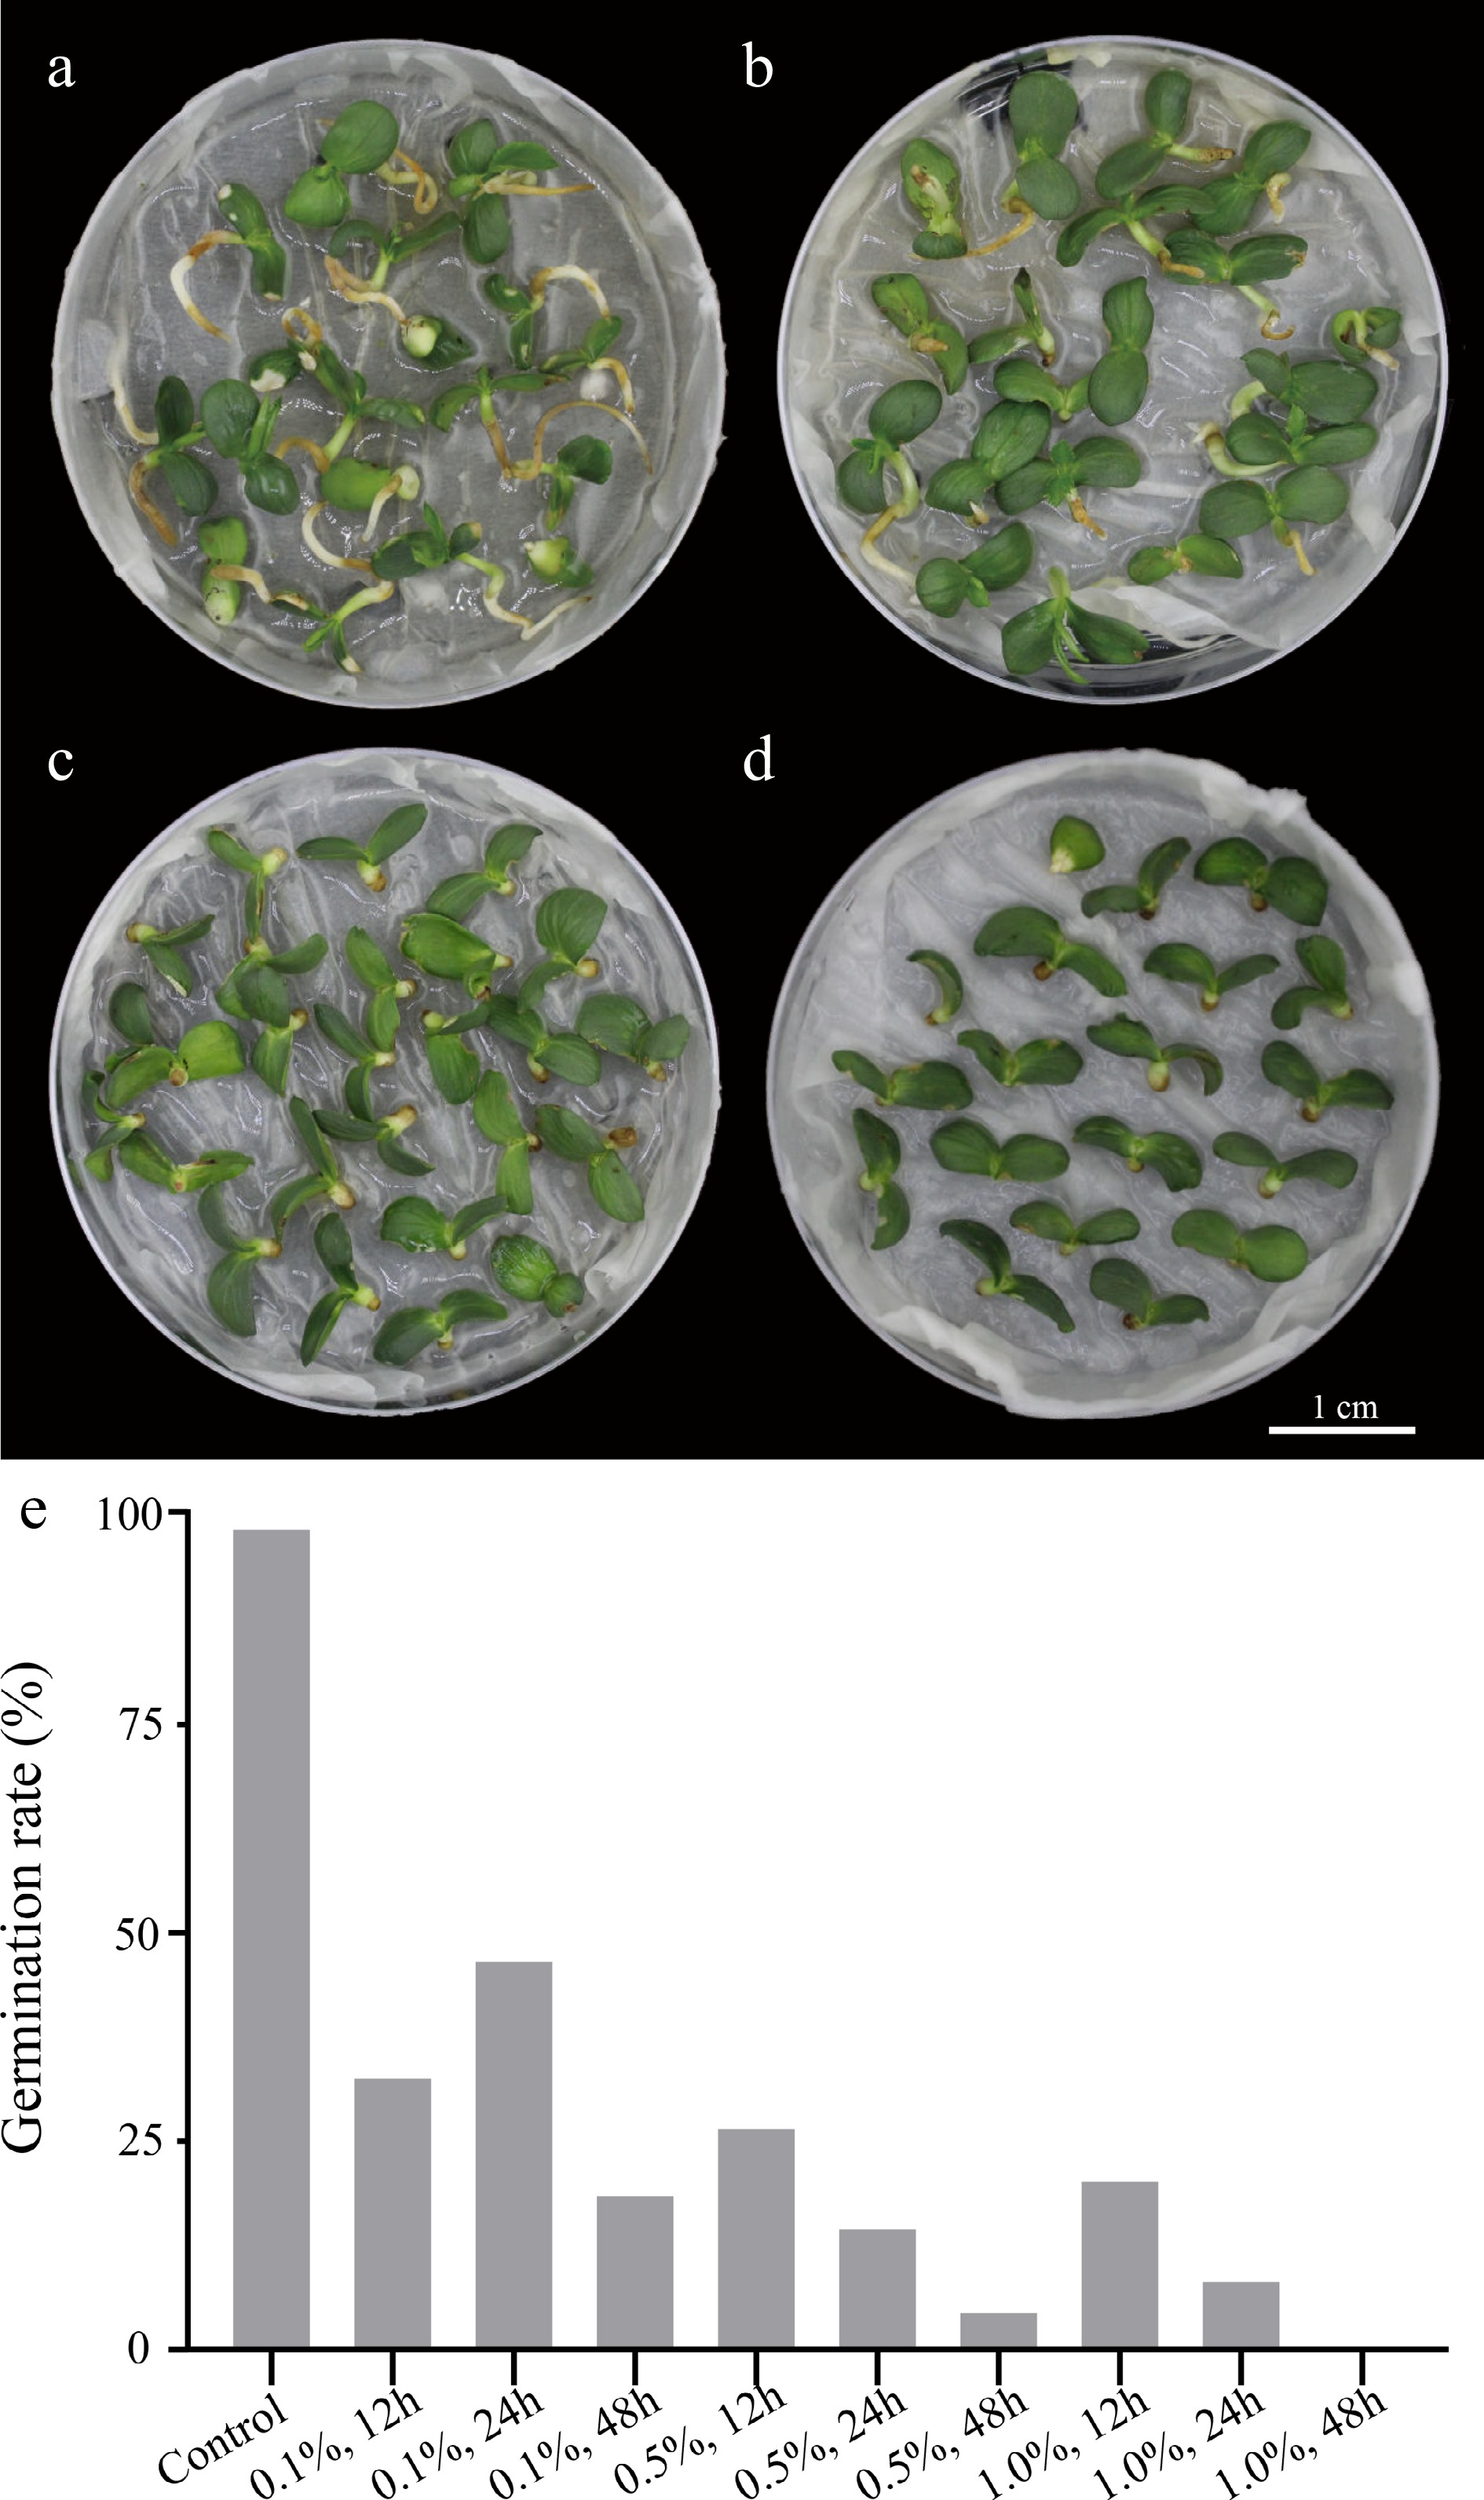
Figure 2.
Seed germination performance of Dangshansuli’ in control and colchicine treatment groups. (a) Control group treated with water for 24 h; (b) 0.1% colchicine treatment for 24 h; (c) 0.5% colchicine treatment for 24 h; (d) 1.0% colchicine treatment for 24 h; (e) germination rate of 'Dangshansuli' seeds treated with colchicine at different concentrations and times.
-
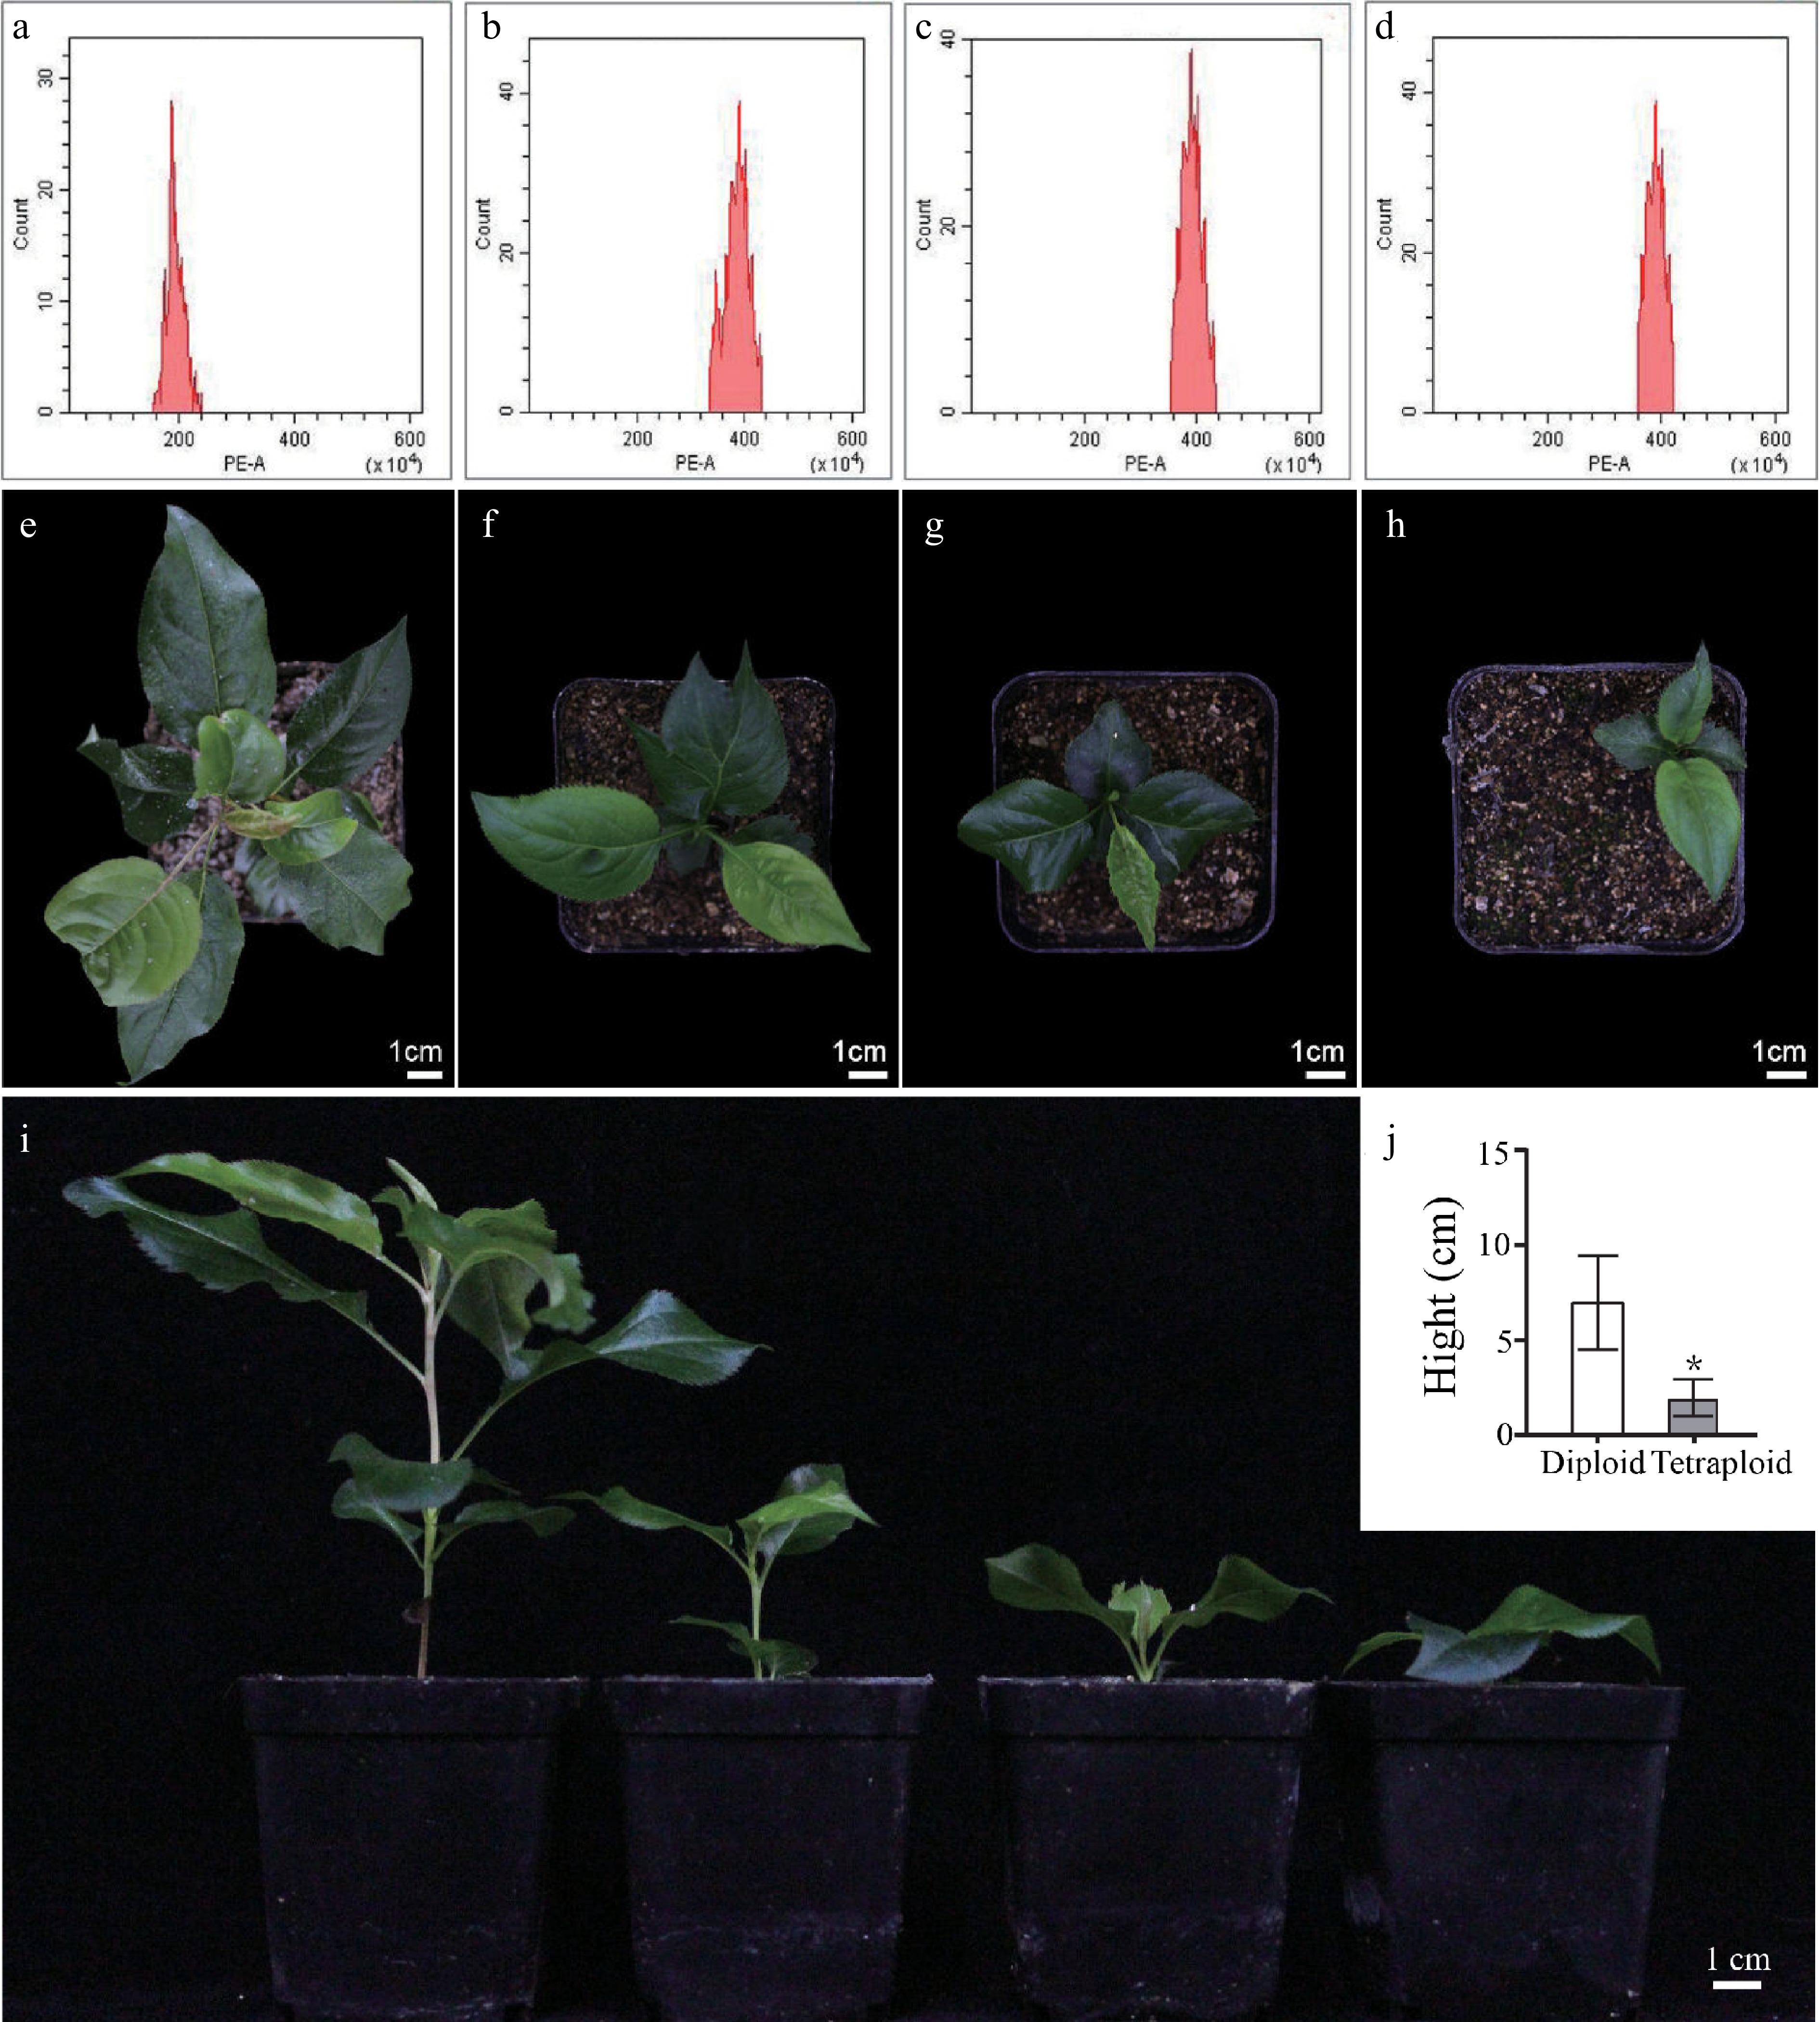
Figure 3.
Analysis of ploidy levels and growth morphology of 'Dangshansuli' pear. Flow cytometry histograms for (a) diploid and (b), (c), (d) tetraploids. Top view of phenotype of (e) diploid plants and (f), (g), (h) tetraploid plants planted in soil for 60 d. (i) Lateral view of phenotype of diploid plants (first from the left) and tetraploid plants (second to fourth from the left) planted in soil for 60 d. (j) Plant height in diploid and tetraploid 'Dangshansuli' seedlings.
-
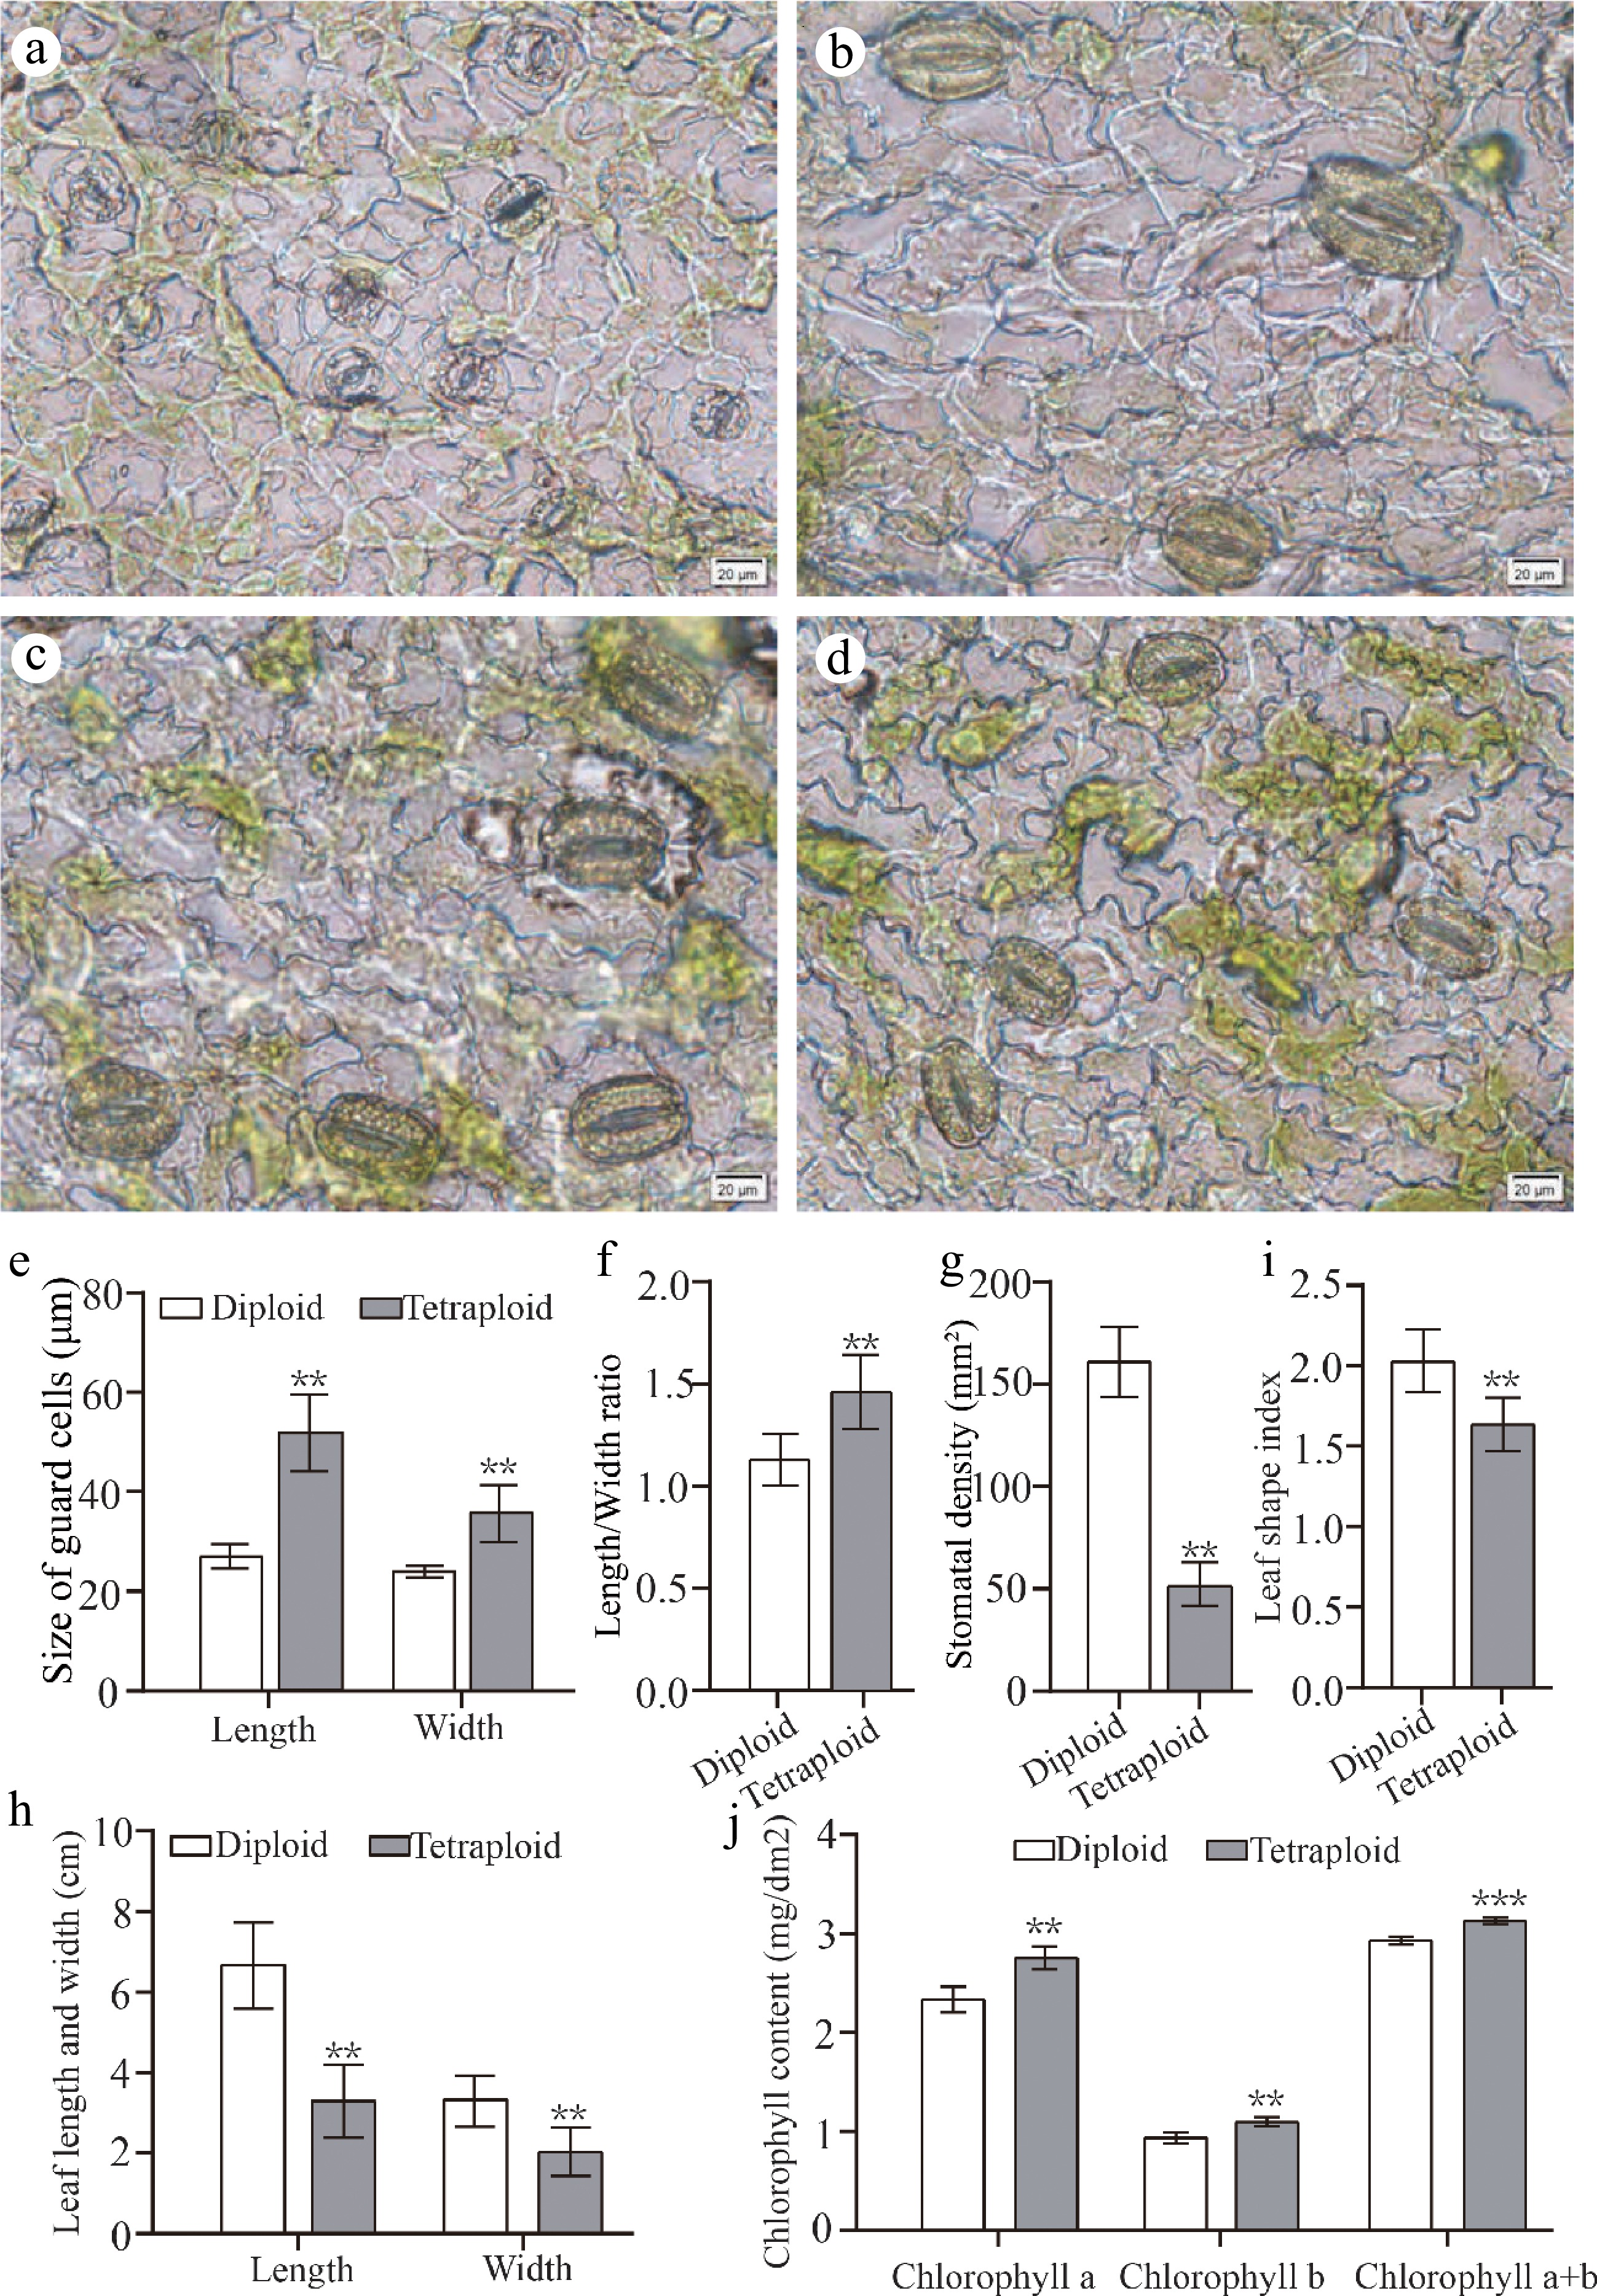
Figure 4.
Leaf morphology and stomatal characteristics of diploids and tetraploids 'Dangshansuli' seedlings. Abaxial stomata in leaves of (a) diploid and (b) − (d) tetraploid 'Dangshansuli' seedlings; (e) the length and width of guard cells in diploid and tetraploid 'Dangshansuli' seedlings; (f) length/width ratio in diploid and tetraploid 'Dangshansuli' seedlings; (g), stomatal density in diploid and tetraploid 'Dangshansuli' seedlings; (h) length and width of leaf in diploid and tetraploid 'Dangshansuli' seedlings; (i) leaf shape index in diploid and tetraploid 'Dangshansuli' seedlings; (j) chlorophyll content in diploid and tetraploid 'Dangshansuli' seedlings. Data are the means ± SD of three replicates. P values were determined by student's two-tailed t-test (***P < 0.001; **P < 0.01; *P < 0.05).
-
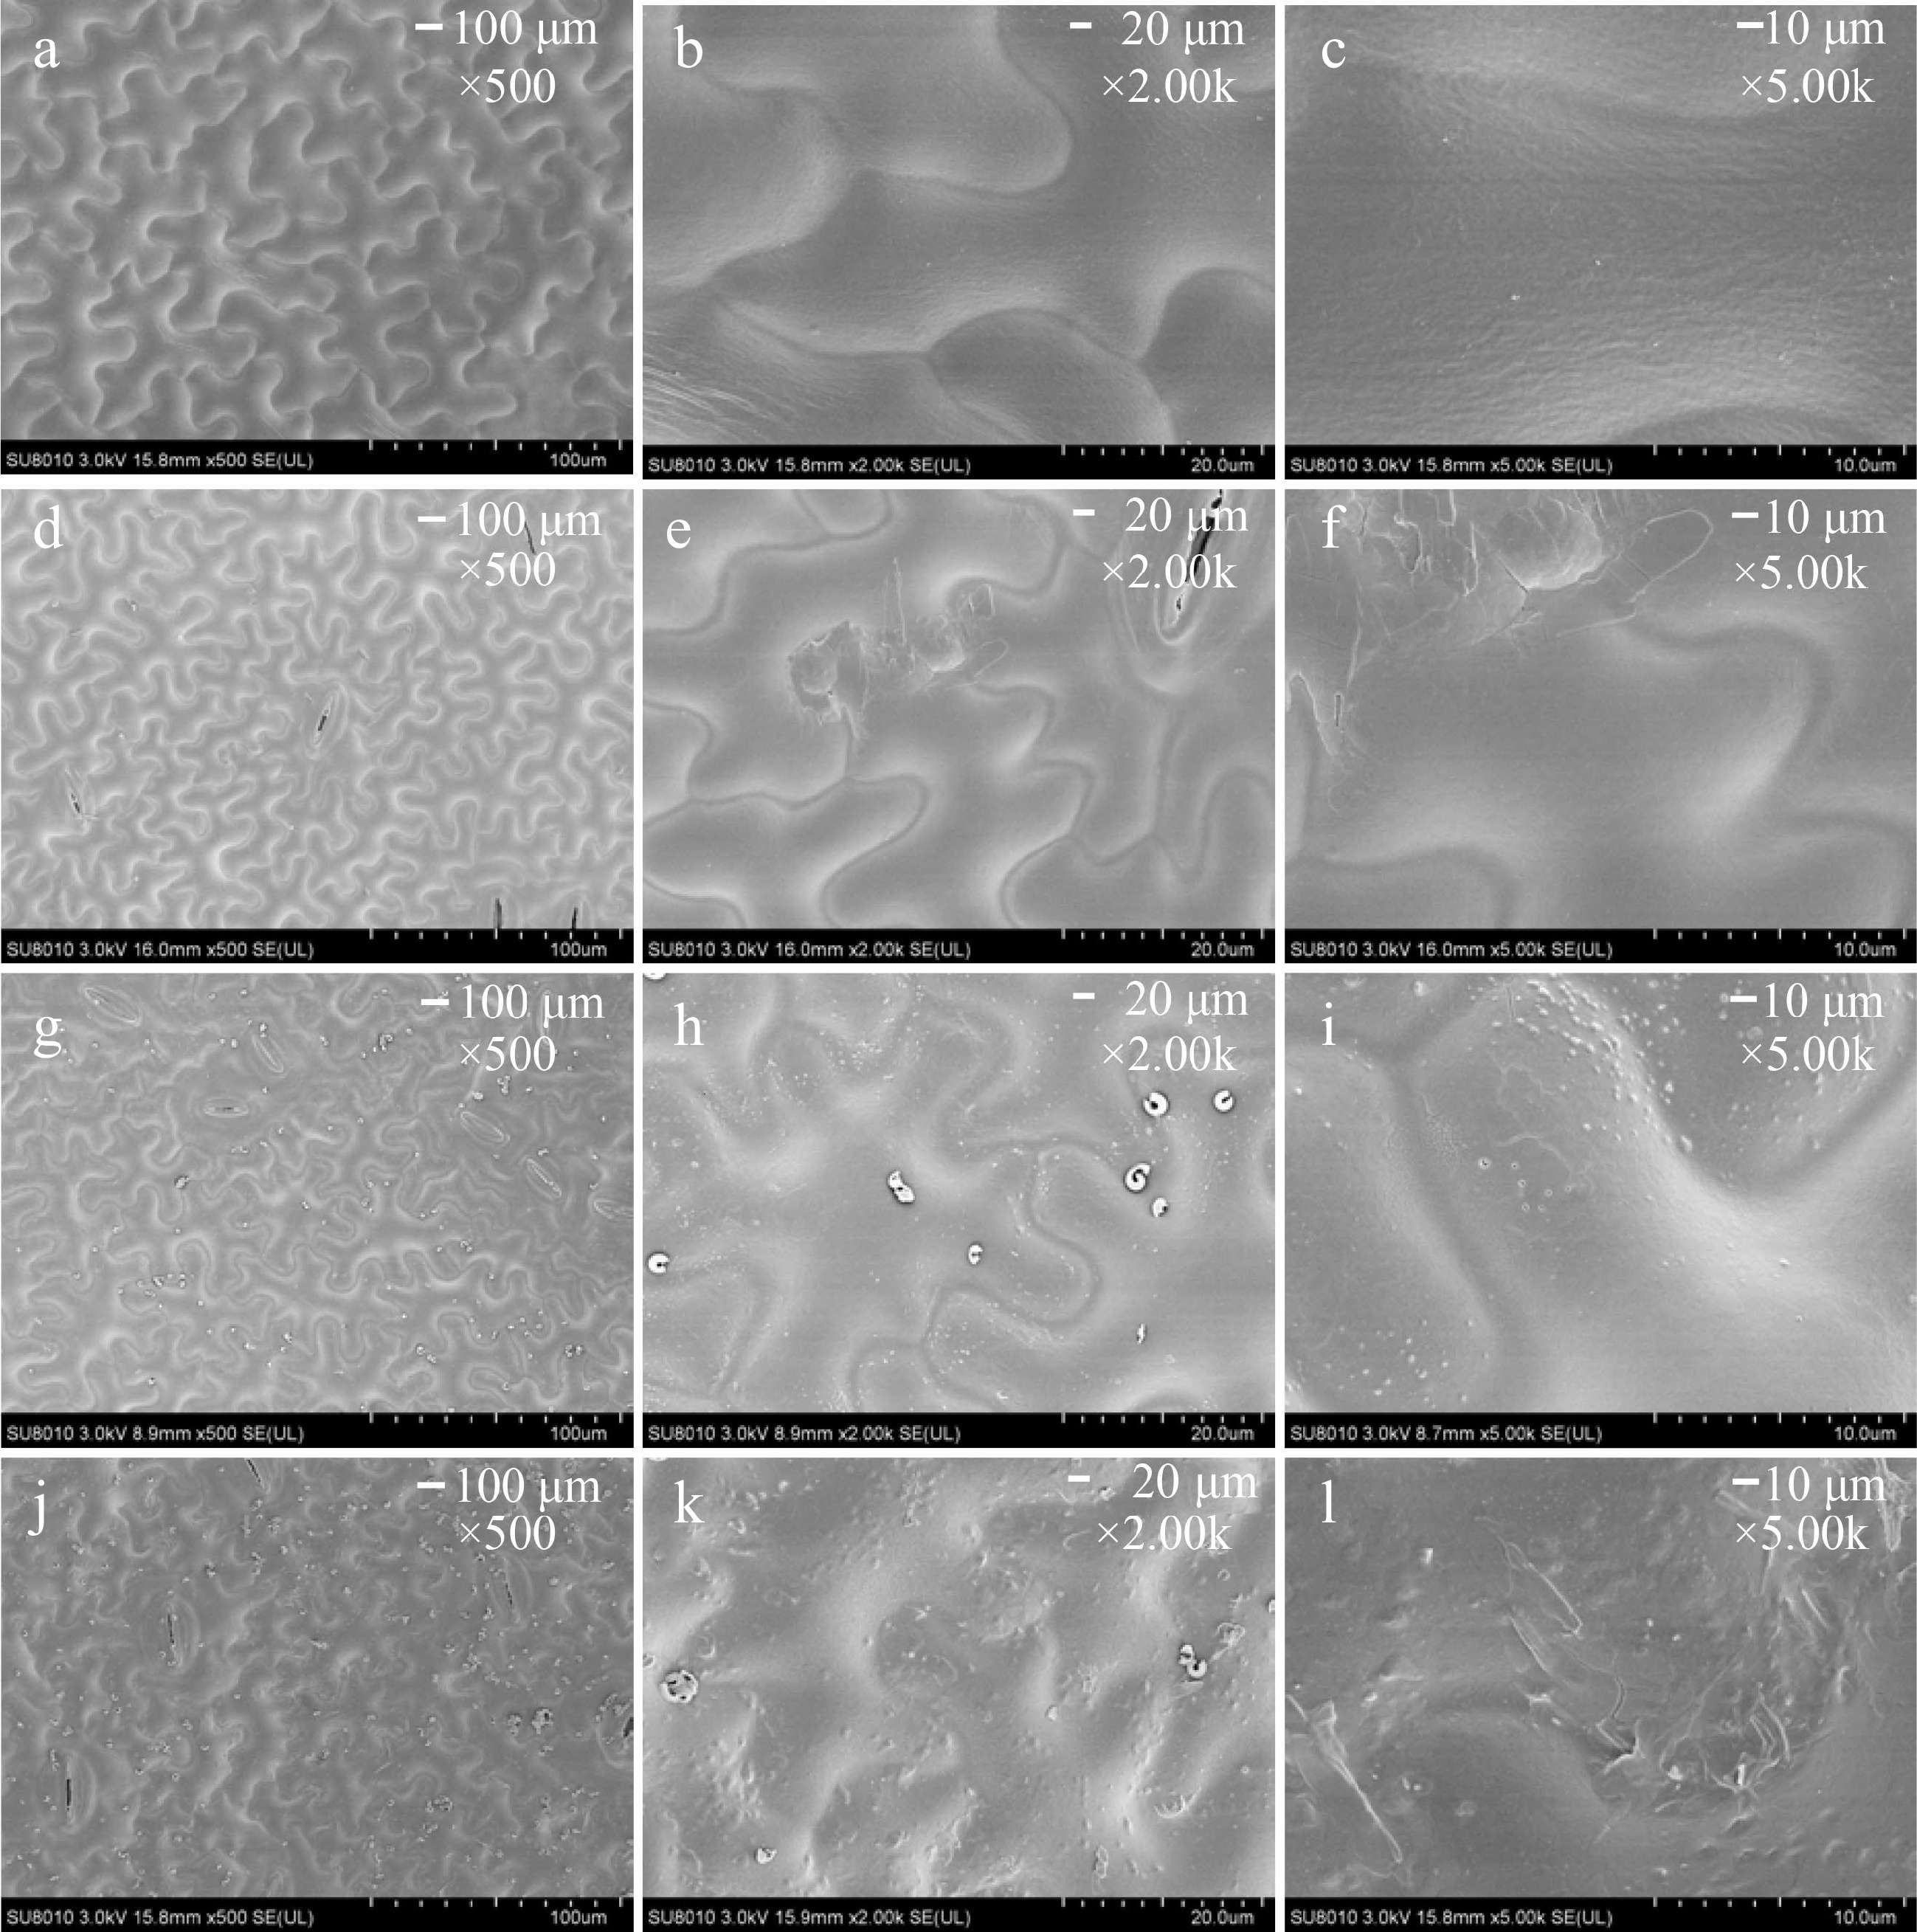
Figure 5.
The magnification series of the scanning electron microscope images of leaf morphology in (a) − (c) diploid and (d) − (f), (g) − (i), (j) − (k) tetraploid ‘Dangshansuli’ seedlings. Scale bars represent 100 μm (magnification 500×) in (a), (d), (g), (j), 20.0 μm (magnification 2.00 K×) in (b), (e), (h), (k) and 10.0 μm (magnification 5.00 K×) in (c), (f), (i), (l).
-
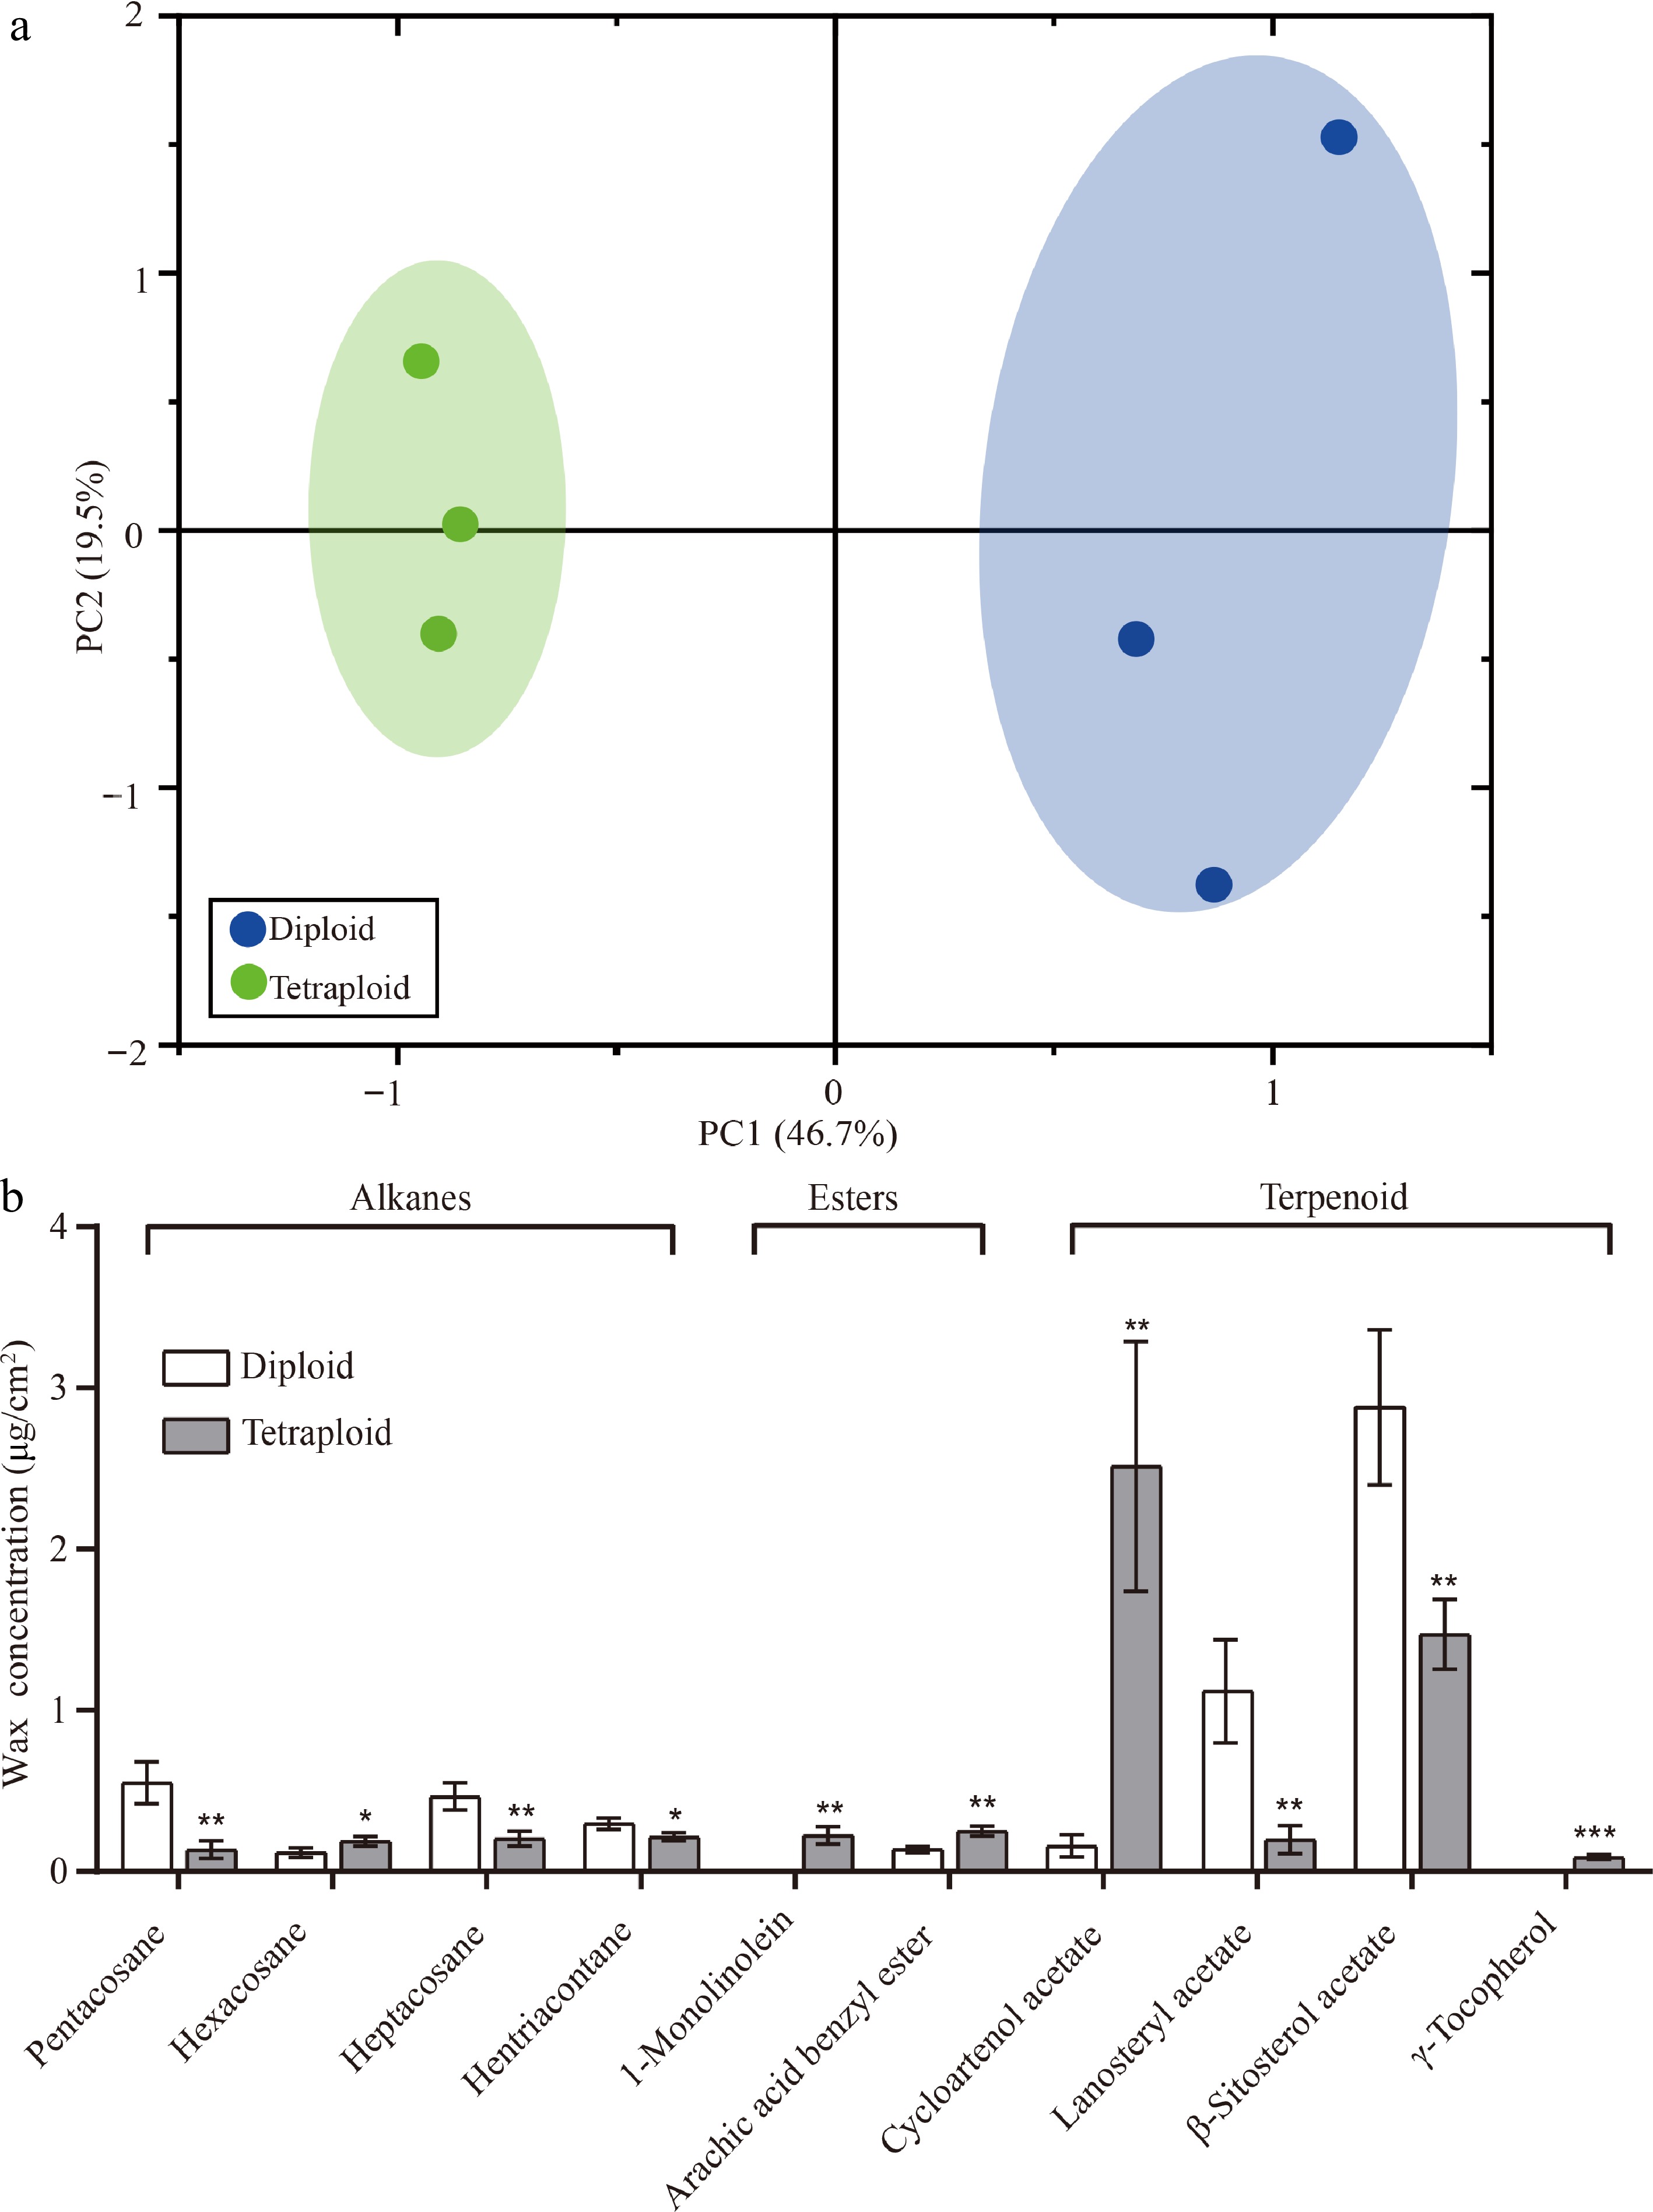
Figure 6.
PCA and 10 differentially expressed wax components in diploid and tetraploid 'Dangshansuli' seedlings. (a) PCA of the chemical compositions of the cuticular wax in diploid and tetraploid 'Dangshansuli' seedlings; (b) differentially expressed wax components in diploid and tetraploid 'Dangshansuli' seedlings. Data are the means ± SD of three replicates. P values were determined by student’s two-tailed t-test (***P < 0.001; **P < 0.01; *P < 0.05).
-
Concentration
(%)Number
of seedsTime
(h)Survival
rate (%)Plant
height/cmTrue leaf
numberNumber of tetraploid Tetraploid
rate (%)Control 50 48 86 6.25 ± 2.45a 8.00 ± 1.26a 0 0 0.1 50 12 28 5.20 ± 1.94a 5.83 ± 1.17b 3 6 50 24 40 6.65 ± 2.22a 7.83 ± 0.98a 0 0 50 48 16 3.28 ± 2.30b 4.00 ± 1.41cd 2 4 0.5 50 12 24 1.72 ± 0.42b 3.83 ± 1.17cd 1 2 50 24 8 2.75 ± 0.96b 4.50 ± 1.29c 1 2 50 48 4 1.20 ± 0.20b 2.33 ± 0.58e 0 0 1 50 12 18 1.38 ± 0.32b 3.33 ± 0.82cde 2 4 50 24 8 2.23 ± 1.21b 3.00 ± 1.41de 1 2 50 48 0 0 0 0 0 Note: Statistical significance was determined using Student's t-test. Different letters indicate significant differences at the 5% level. Control: control group treated with water solution. Table 1.
Mutagenic effect of colchicine concentration and treatment time on ‘Dangshansuli’ seeds with seed coat removed.
Figures
(6)
Tables
(1)