-
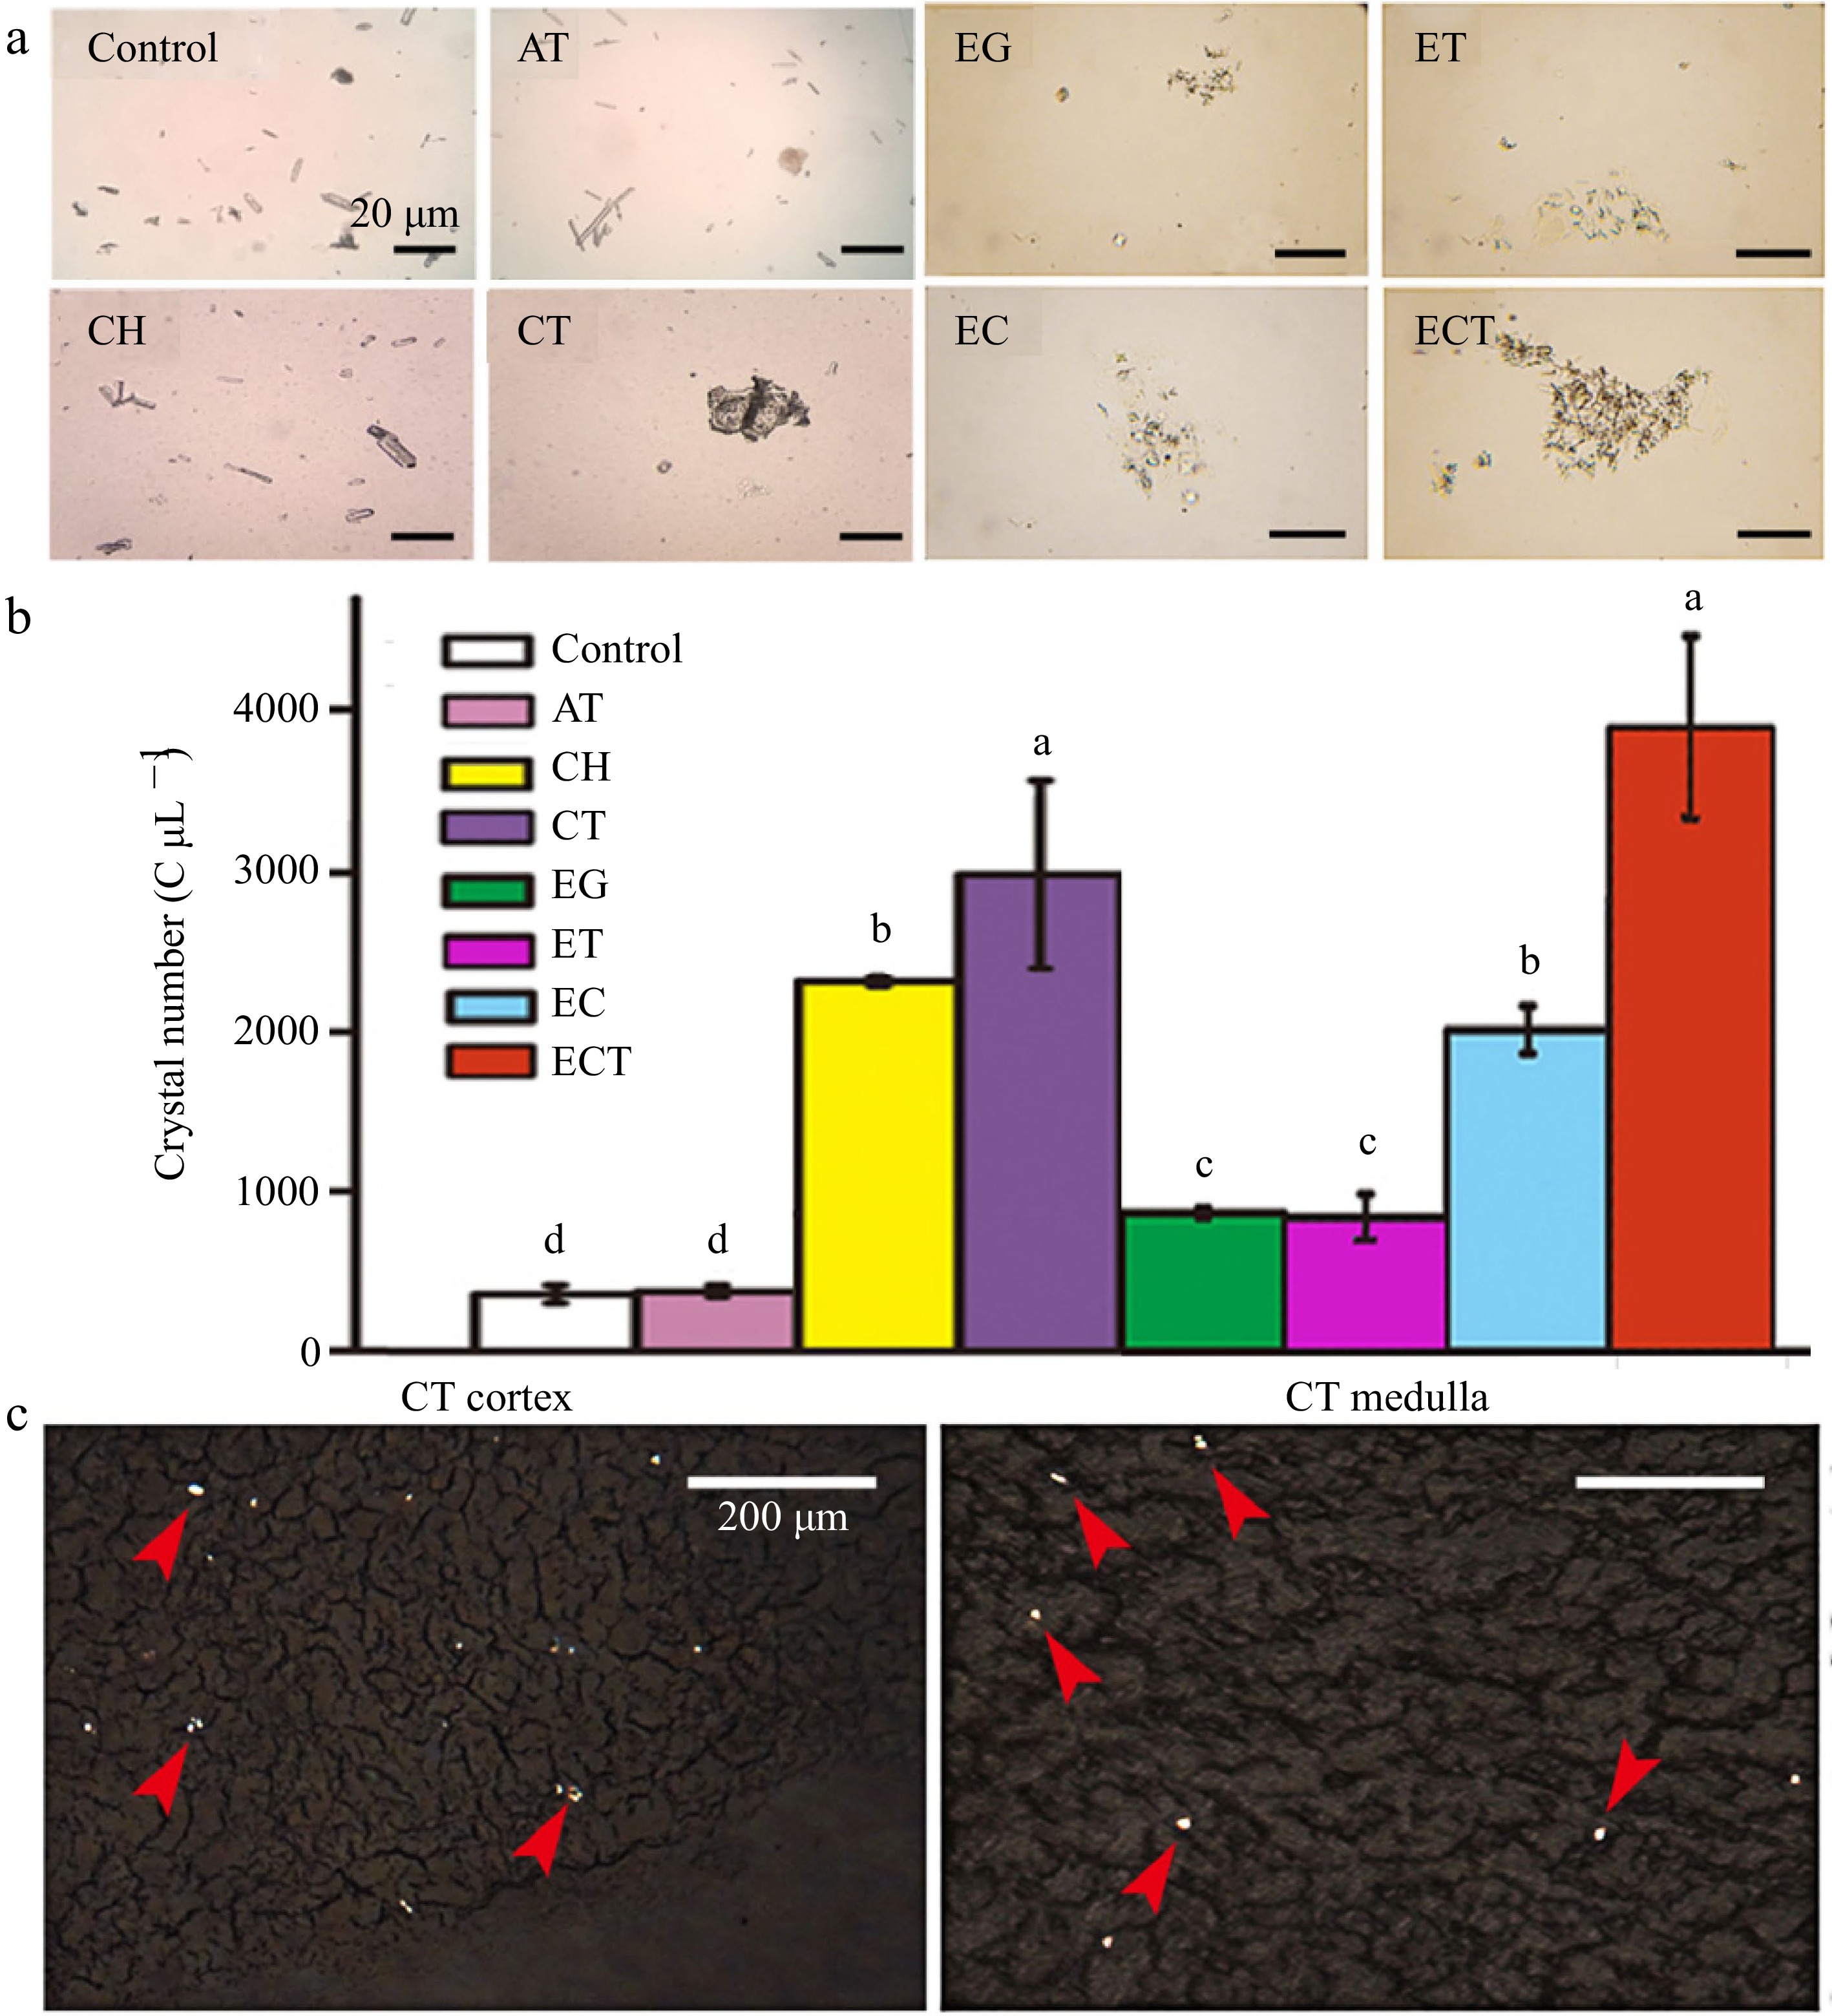
Figure 1.
(a) Microphotography, (b) crystal numbers of urine and the (c) frozen kidney sections. Urine was collected after the mice gavaged with AT, CH, CT, EG, ET, EC or ECT for 3 d. Frozen kidney sections of the mice gavaged with CT were observed under polarized microscope, the red arrows indicate the crystals induced by the treatment of CT. The crystal numbers in different groups were about 432, 456, 2,336, 2,984, 952, 904, 2,080, 3,928 C μL−1, respectively. Vertical bars on data in the columnar graph represented standard deviation; values with different letters are significantly different at p < 0.05.
-
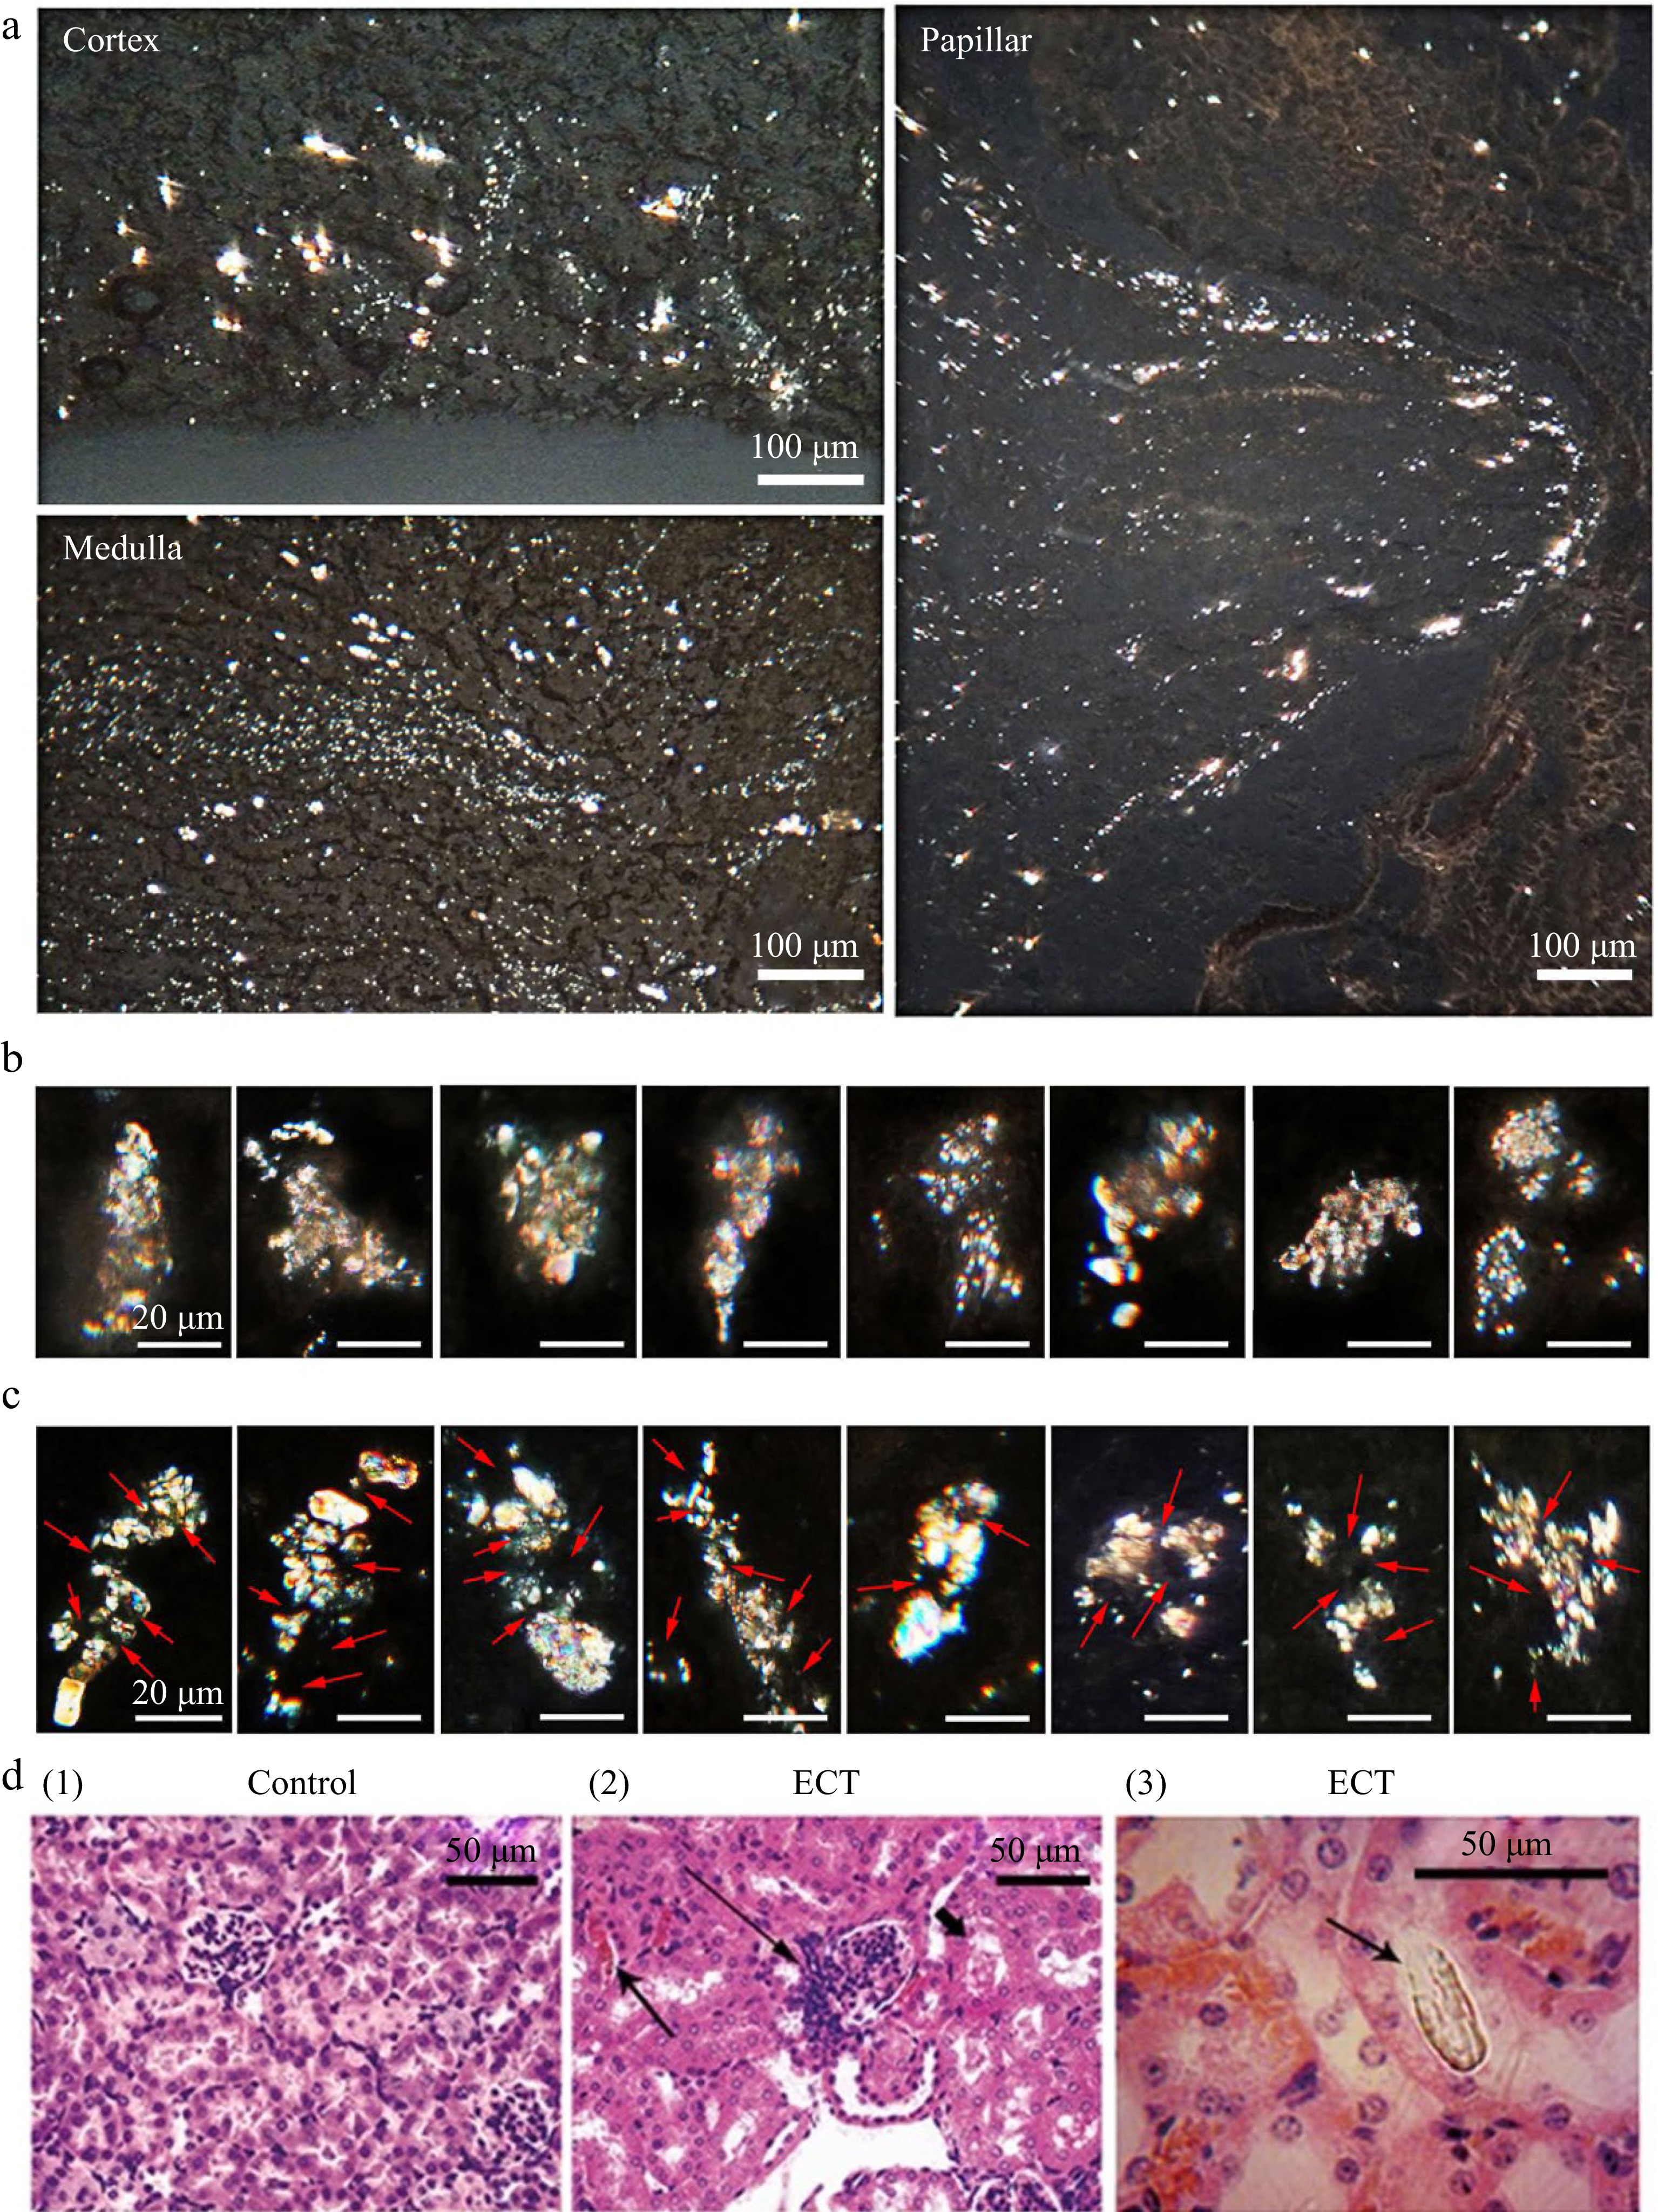
Figure 2.
Frozen kidney sections of ECT-mice observed under polarized microscope and HE section of kidney. (a) Crystallization in kidney observed under polarized microscope after the mice gavaged with ECT for 3 d. (b) Filter cake shaped crystal grains (microstones) in kidneys of ECT-mice. (c) Multiple nuclei (arrow) crystal grains (microstones) in kidneys of ECT-mice. Each of the groups contained 12 mice. (d) HE stained kidney sections of (1) the control and (2) ECT-mice observed under optical microscope; prominent hyperplasia of the juxtaglomerular apparatus (long arrow), eosinophilic casts (arrow) and marked vascular stasis within the interstitial capillary lumina (short arrow); (3) the HE section observed under polarized microscope, arrow indicates a distinct crystal.
-
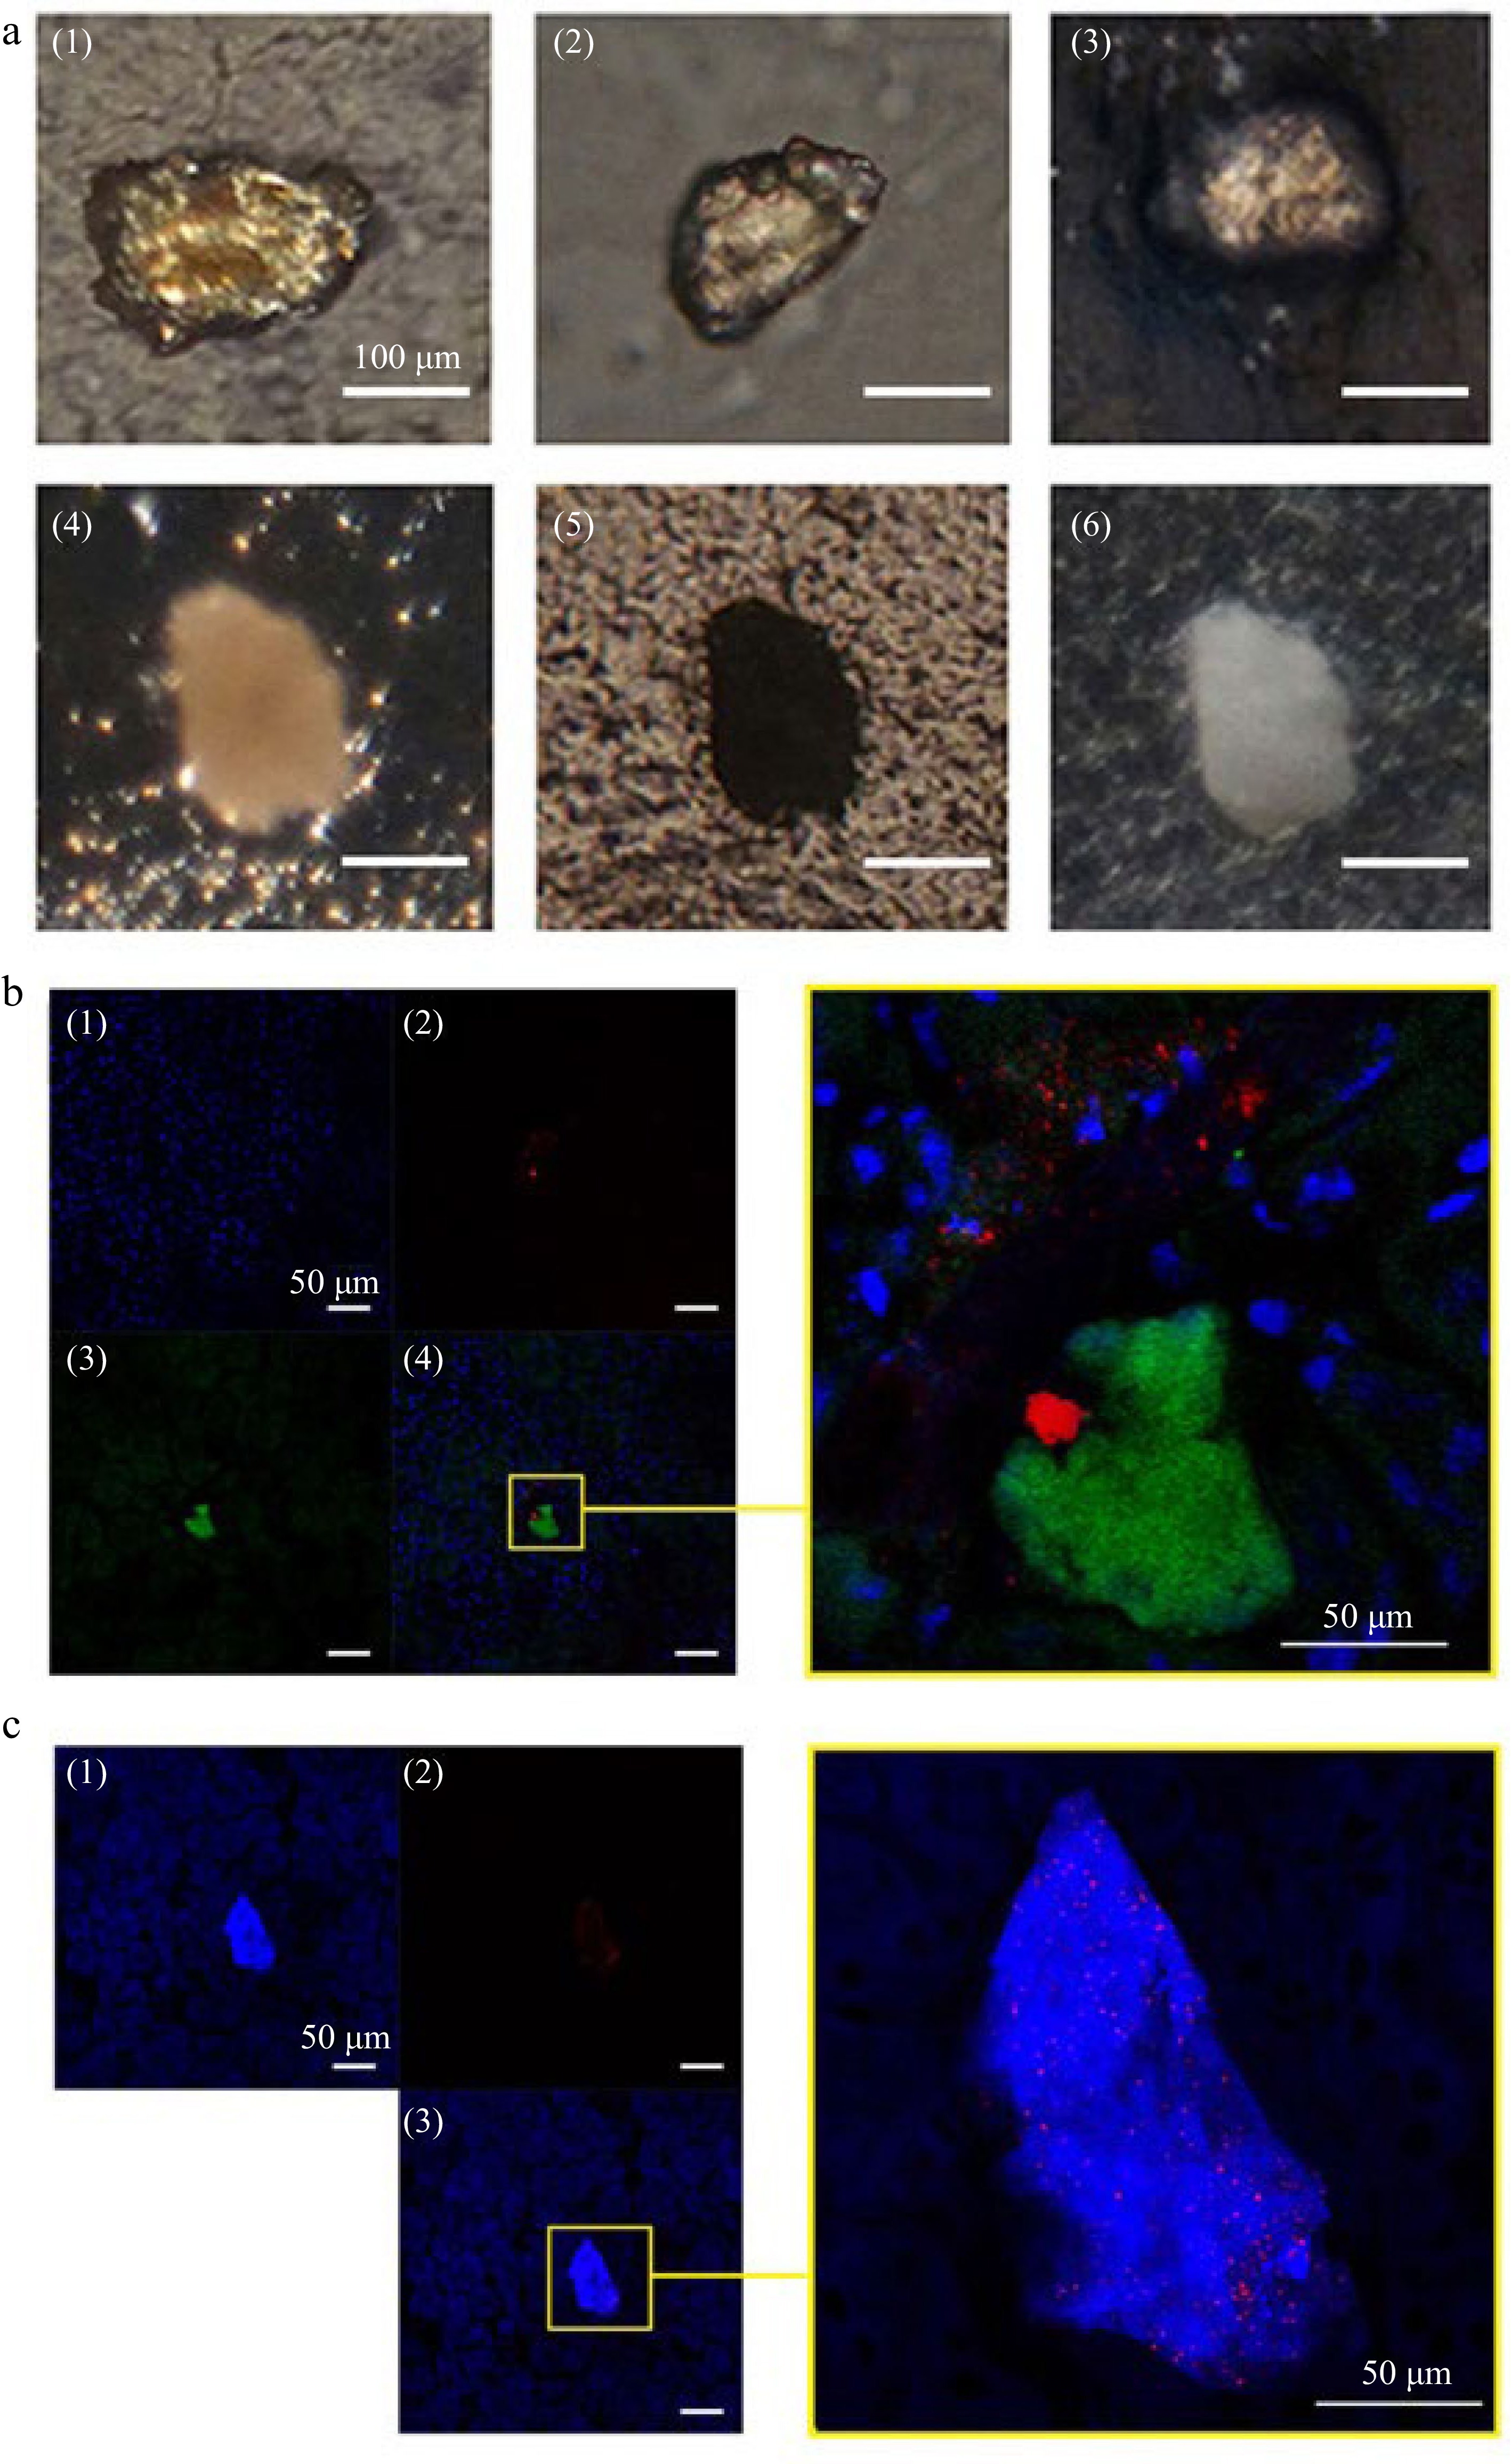
Figure 3.
Stone like grains and CLSM observation on AT or CH deposits and crystal distribution in kidney of mice gavaged with ECT. (a) Stone like crystalline grains in kidney of mice gavaged with ECT 3 times (1)−(4) under polarized microscope; (5) under transmitted light microscope; (6) under reflected light microscope. (b) (1) Cell nuclei (blue) were stained with DAPI and (2) AT (green) was immunolocalized with antibody against the tannins and visualized with FITC-phalloidin; (3) crystals (red) was visualized by reflecting light at λ633 nm of Kr–laser; the right, a local part magnification in (4). (c) (1) Total cholesterol (blue) were stained with Filipin and (2) crystals (red) were visualized by reflecting the light at λ633 nm of Kr–laser; the right, a local part magnification in (3).
-
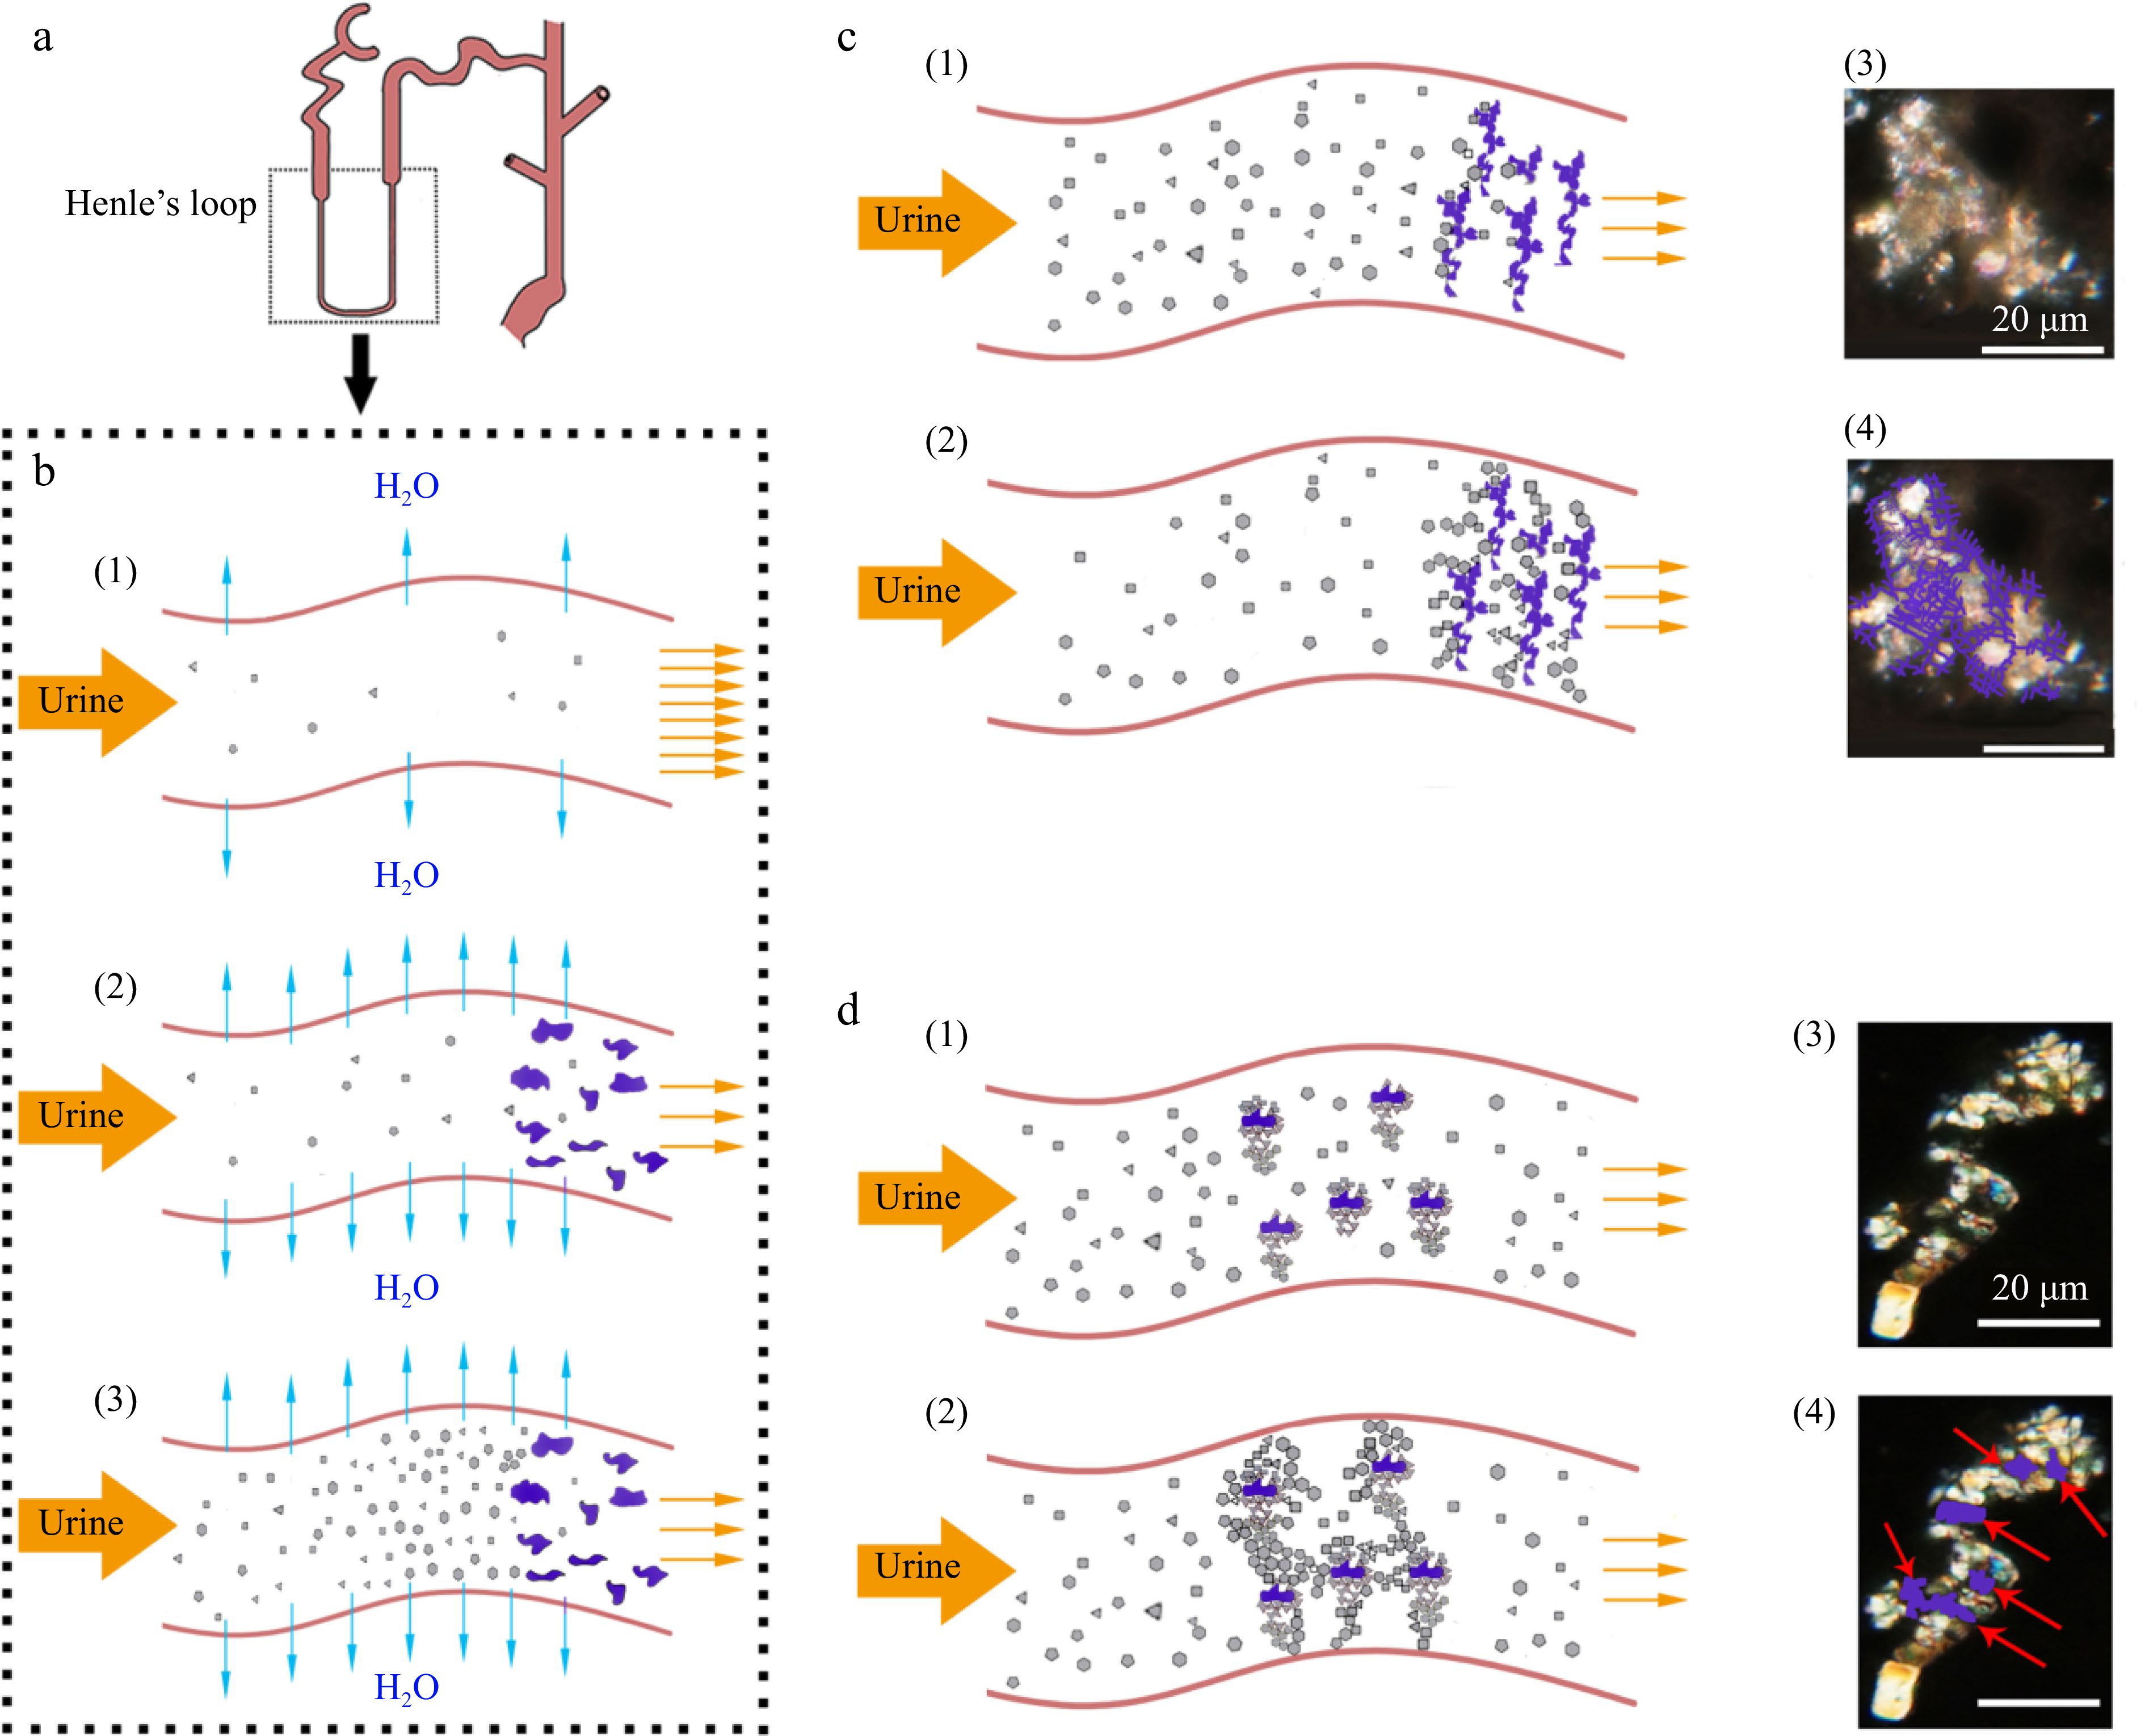
Figure 4.
Proposed model of synergistic action of cholesterol with tannins (SACT) causing formation of renal stones. (a) Diagrammatic structure of the renal tube. (b) (1) Urine normal flow in the renal tube; (2) cholesterol with tannins co-precipitating in the renal tube; (3) supersaturation of urine solutes caused by SACT. (c) (1), (2) SACT caused formation of filter cake shaped crystal grains (microstone) in the renal tube; (3), (4) similar case observed in kidney sections of ECT-mice under polarized microscope, purple lines indicating the amorphous deposits. (d) (1), (2) SACT caused formation of multiple nuclei crystal grains in the renal tube; (3), (4) multiple nuclei crystal grains observed in kidney sections of ECT-mice under polarized microscope, red arrows indicating the amorphous nuclei (the purple loci).
Figures
(4)
Tables
(0)