-
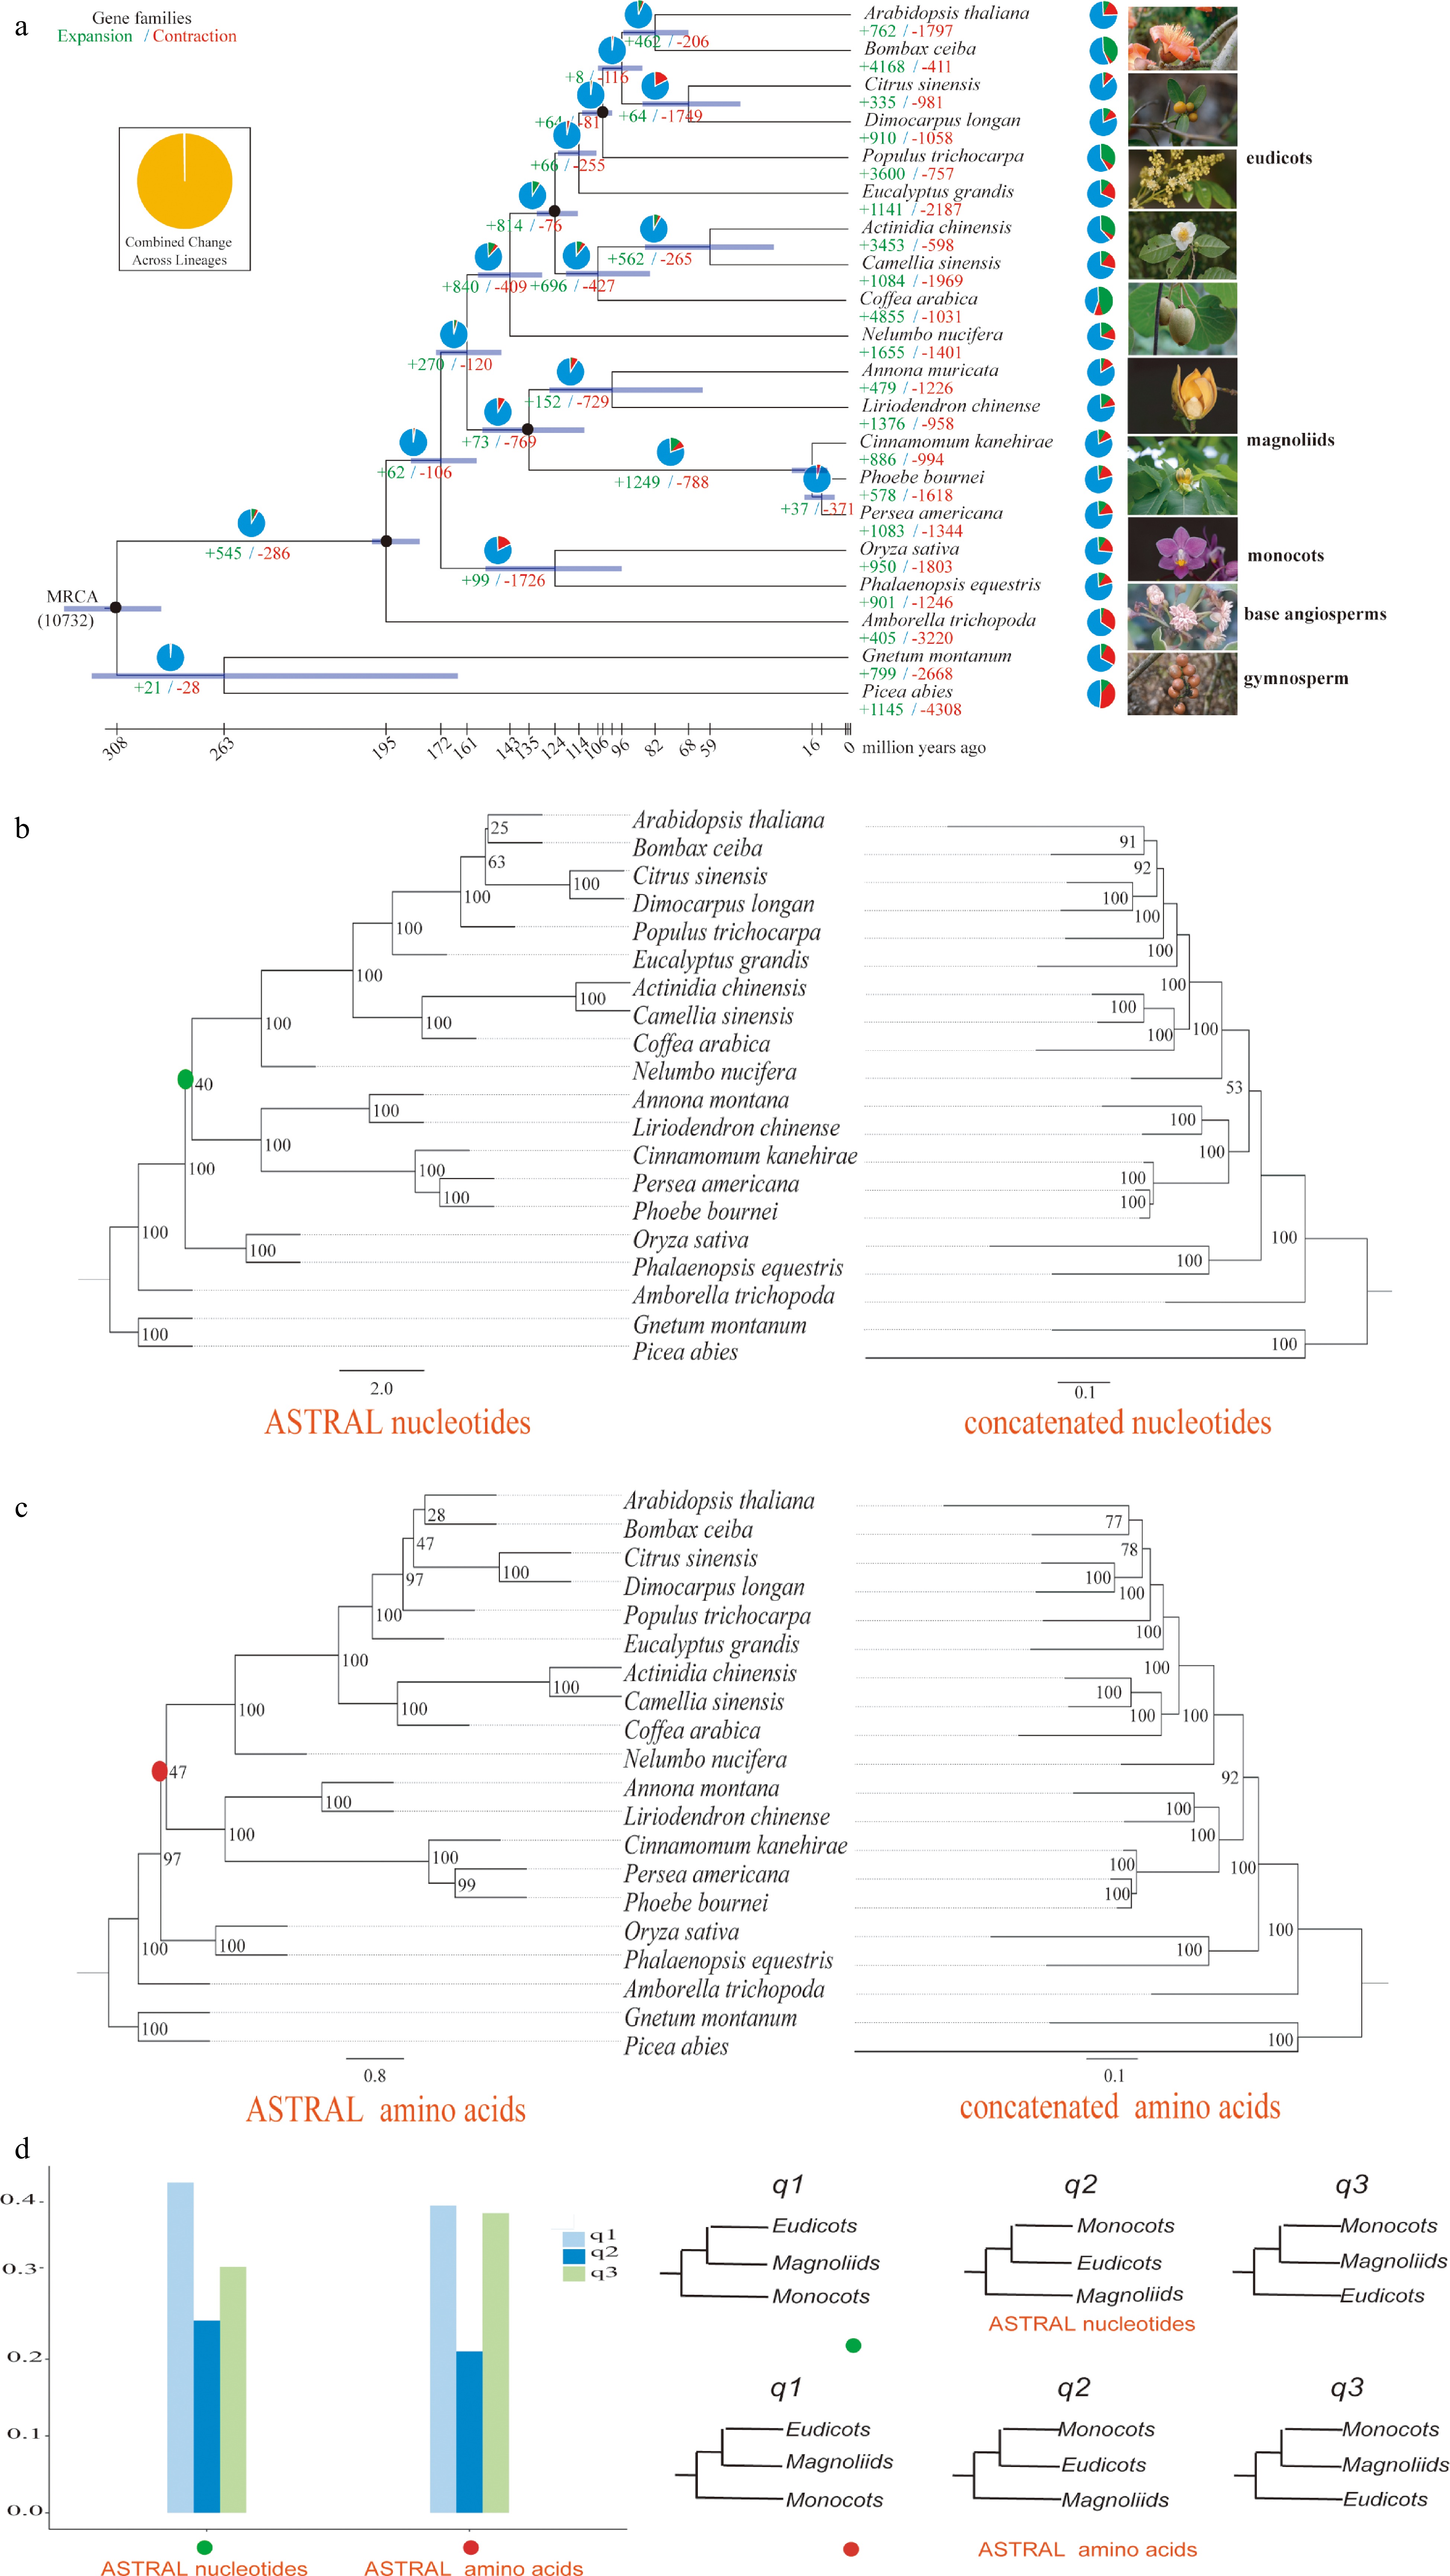
Figure 1.
Phylogenetic tree, concatenated and ASTRAL trees of A. montana. (a) Phylogenetic tree based on the Bayesian method. (b) ASTRAL (left) and concatenated (right) trees constructed based on nucleotide sequences. (c) ASTRAL (left) and concatenated (right) trees constructed based on amino acid sequences. (d) Comparison of q-values of ASTRAL trees based on nucleotide and amino acids sequences.
-

Figure 2.
Whole genome duplication (WGD) analysis. (a) Ks distribution in A. montana and L. chinense. (b) Ks distribution in L. chinense and C. kanehirae. (c) Collinear relationship between L. chinense and C. kanehirae. From (c), we found several collinearity regions that satisfy L. chinense: C. kanehirae = 2:4, which indicates that L. chinense underwent WGD once and C. kanehirae underwent WGD twice after diverging.
-
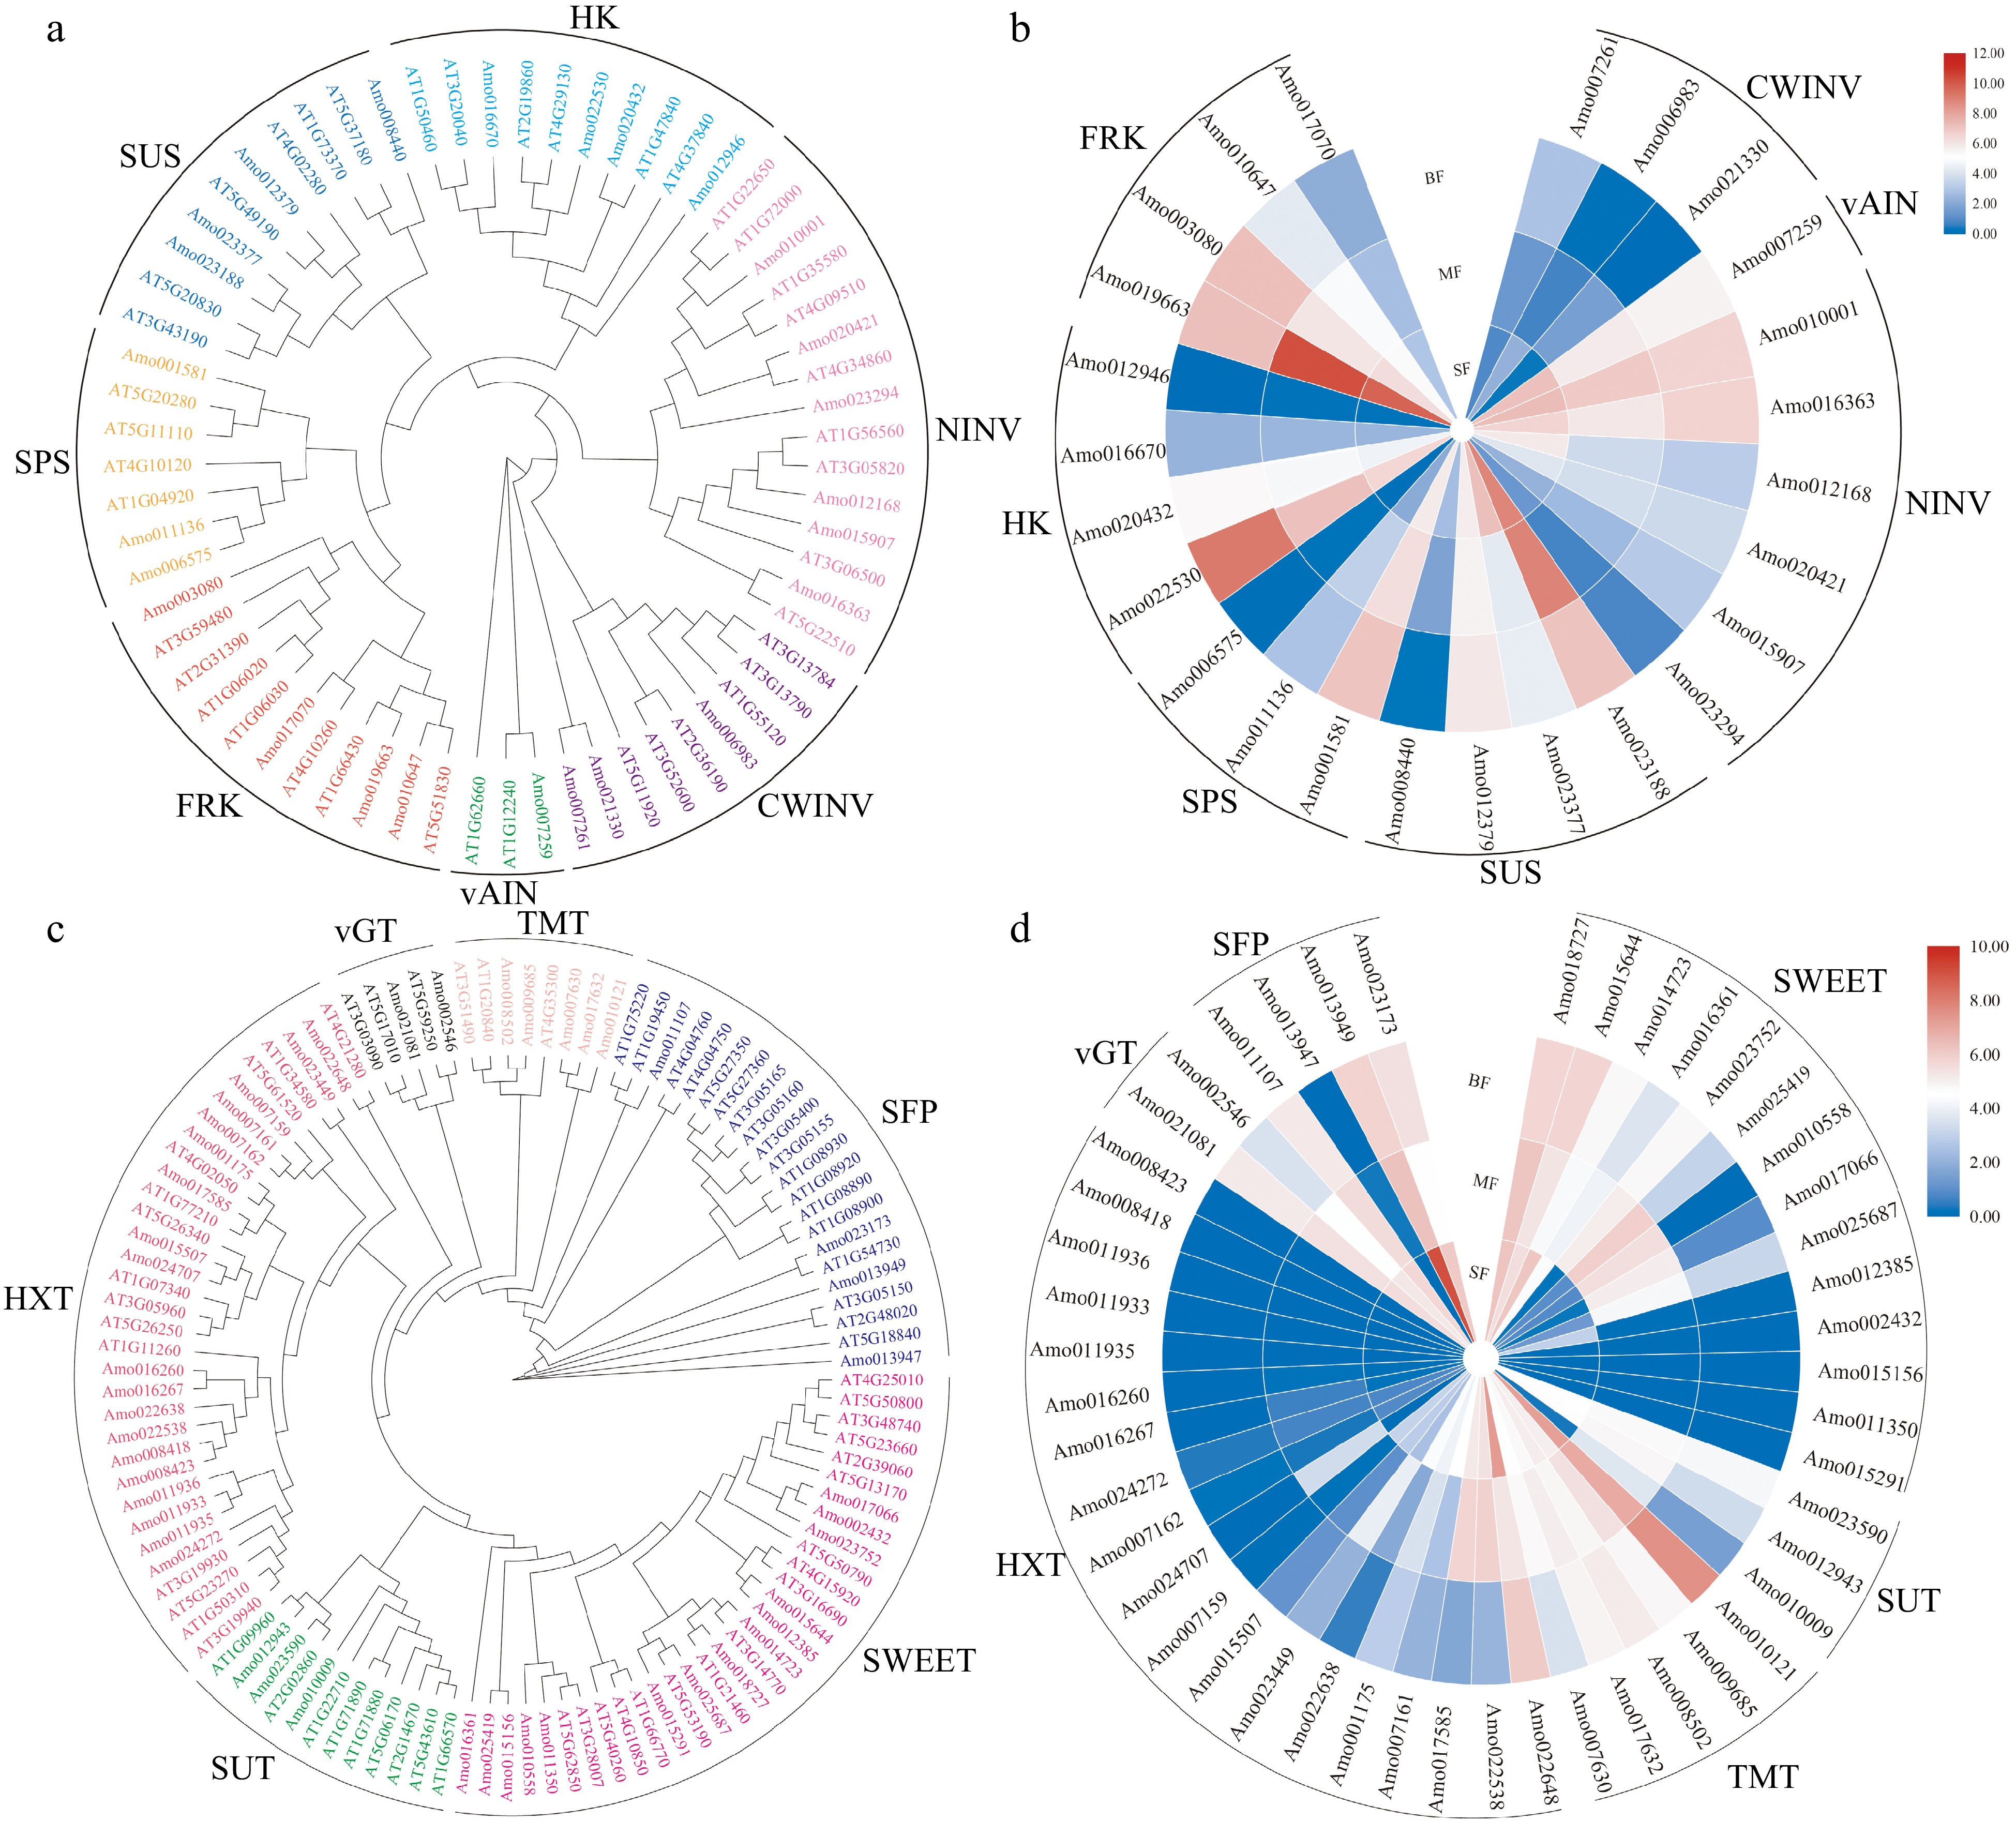
Figure 3.
Analysis of genes related to sugar metabolism and accumulation in A. montana fruit development. (a) Phylogenetic analysis of genes related to sugar metabolism. (b) Expression pattern of key enzyme genes involved in sugar metabolism. (c) Phylogenetic analysis of genes related to sugar transporters. (d) Expression pattern of sugar transporters. 'SF' represents the small fruit stage, 'MF' represents medium fruit stage, 'BF' represents big fruit stage.
-
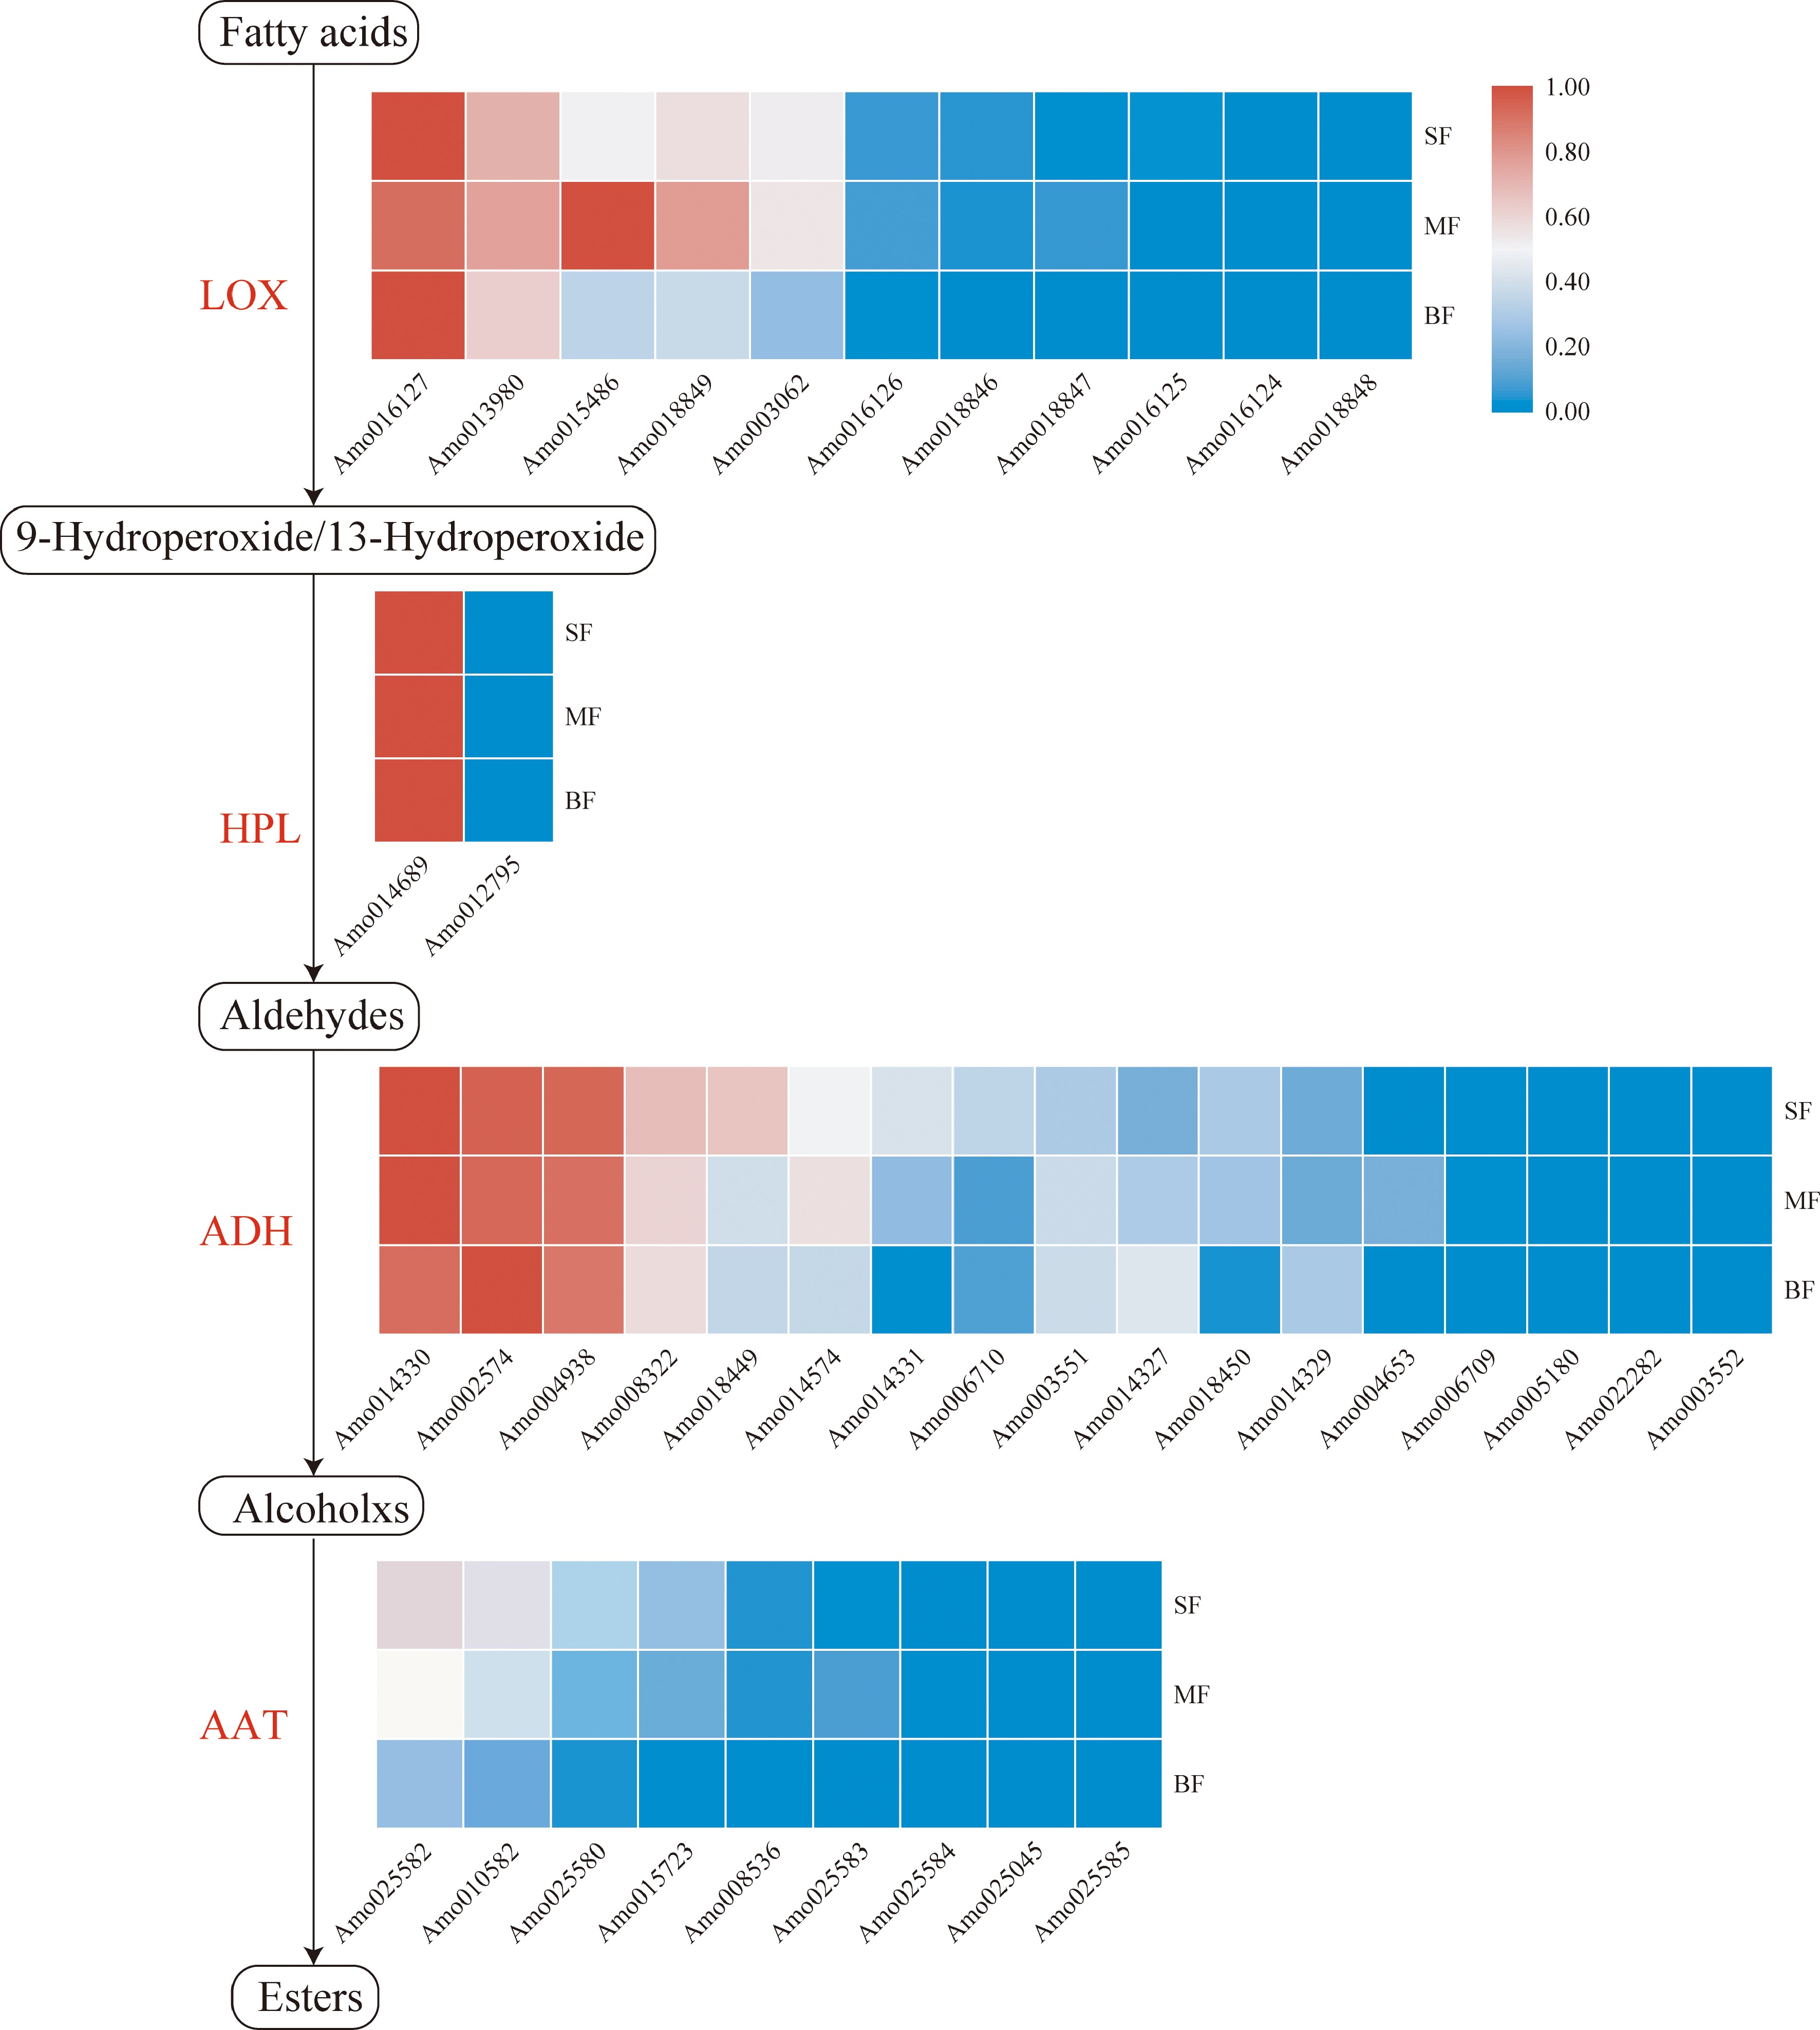
Figure 4.
Fatty acid pathway in A. montana fruit. Tissue-specific relative expression profiles (red-blue scale) of genes implicated in fatty acid pathway (heat map). Intermediates are shown in black, and the enzymes (Supplemental Table S18) involved at each step are shown in red. 'SF' represents the small fruit stage, 'MF' represents medium fruit stage, 'BF' represents big fruit stage.
-
Category A. thaliana P. bournei A. montana Type II (Total) 46 34 33 MIKC 40 28 28 MIKC* 6 6 5 Mδ 0 0 0 Type I (Total) 62 30 13 Ma 25 23 7 Mβ 21 4 7 Mγ 16 3 2 Total 108 64 46 Table 1.
MADS-box genes in A. montana, A. thaliana, P. bournei.
Figures
(4)
Tables
(1)