-
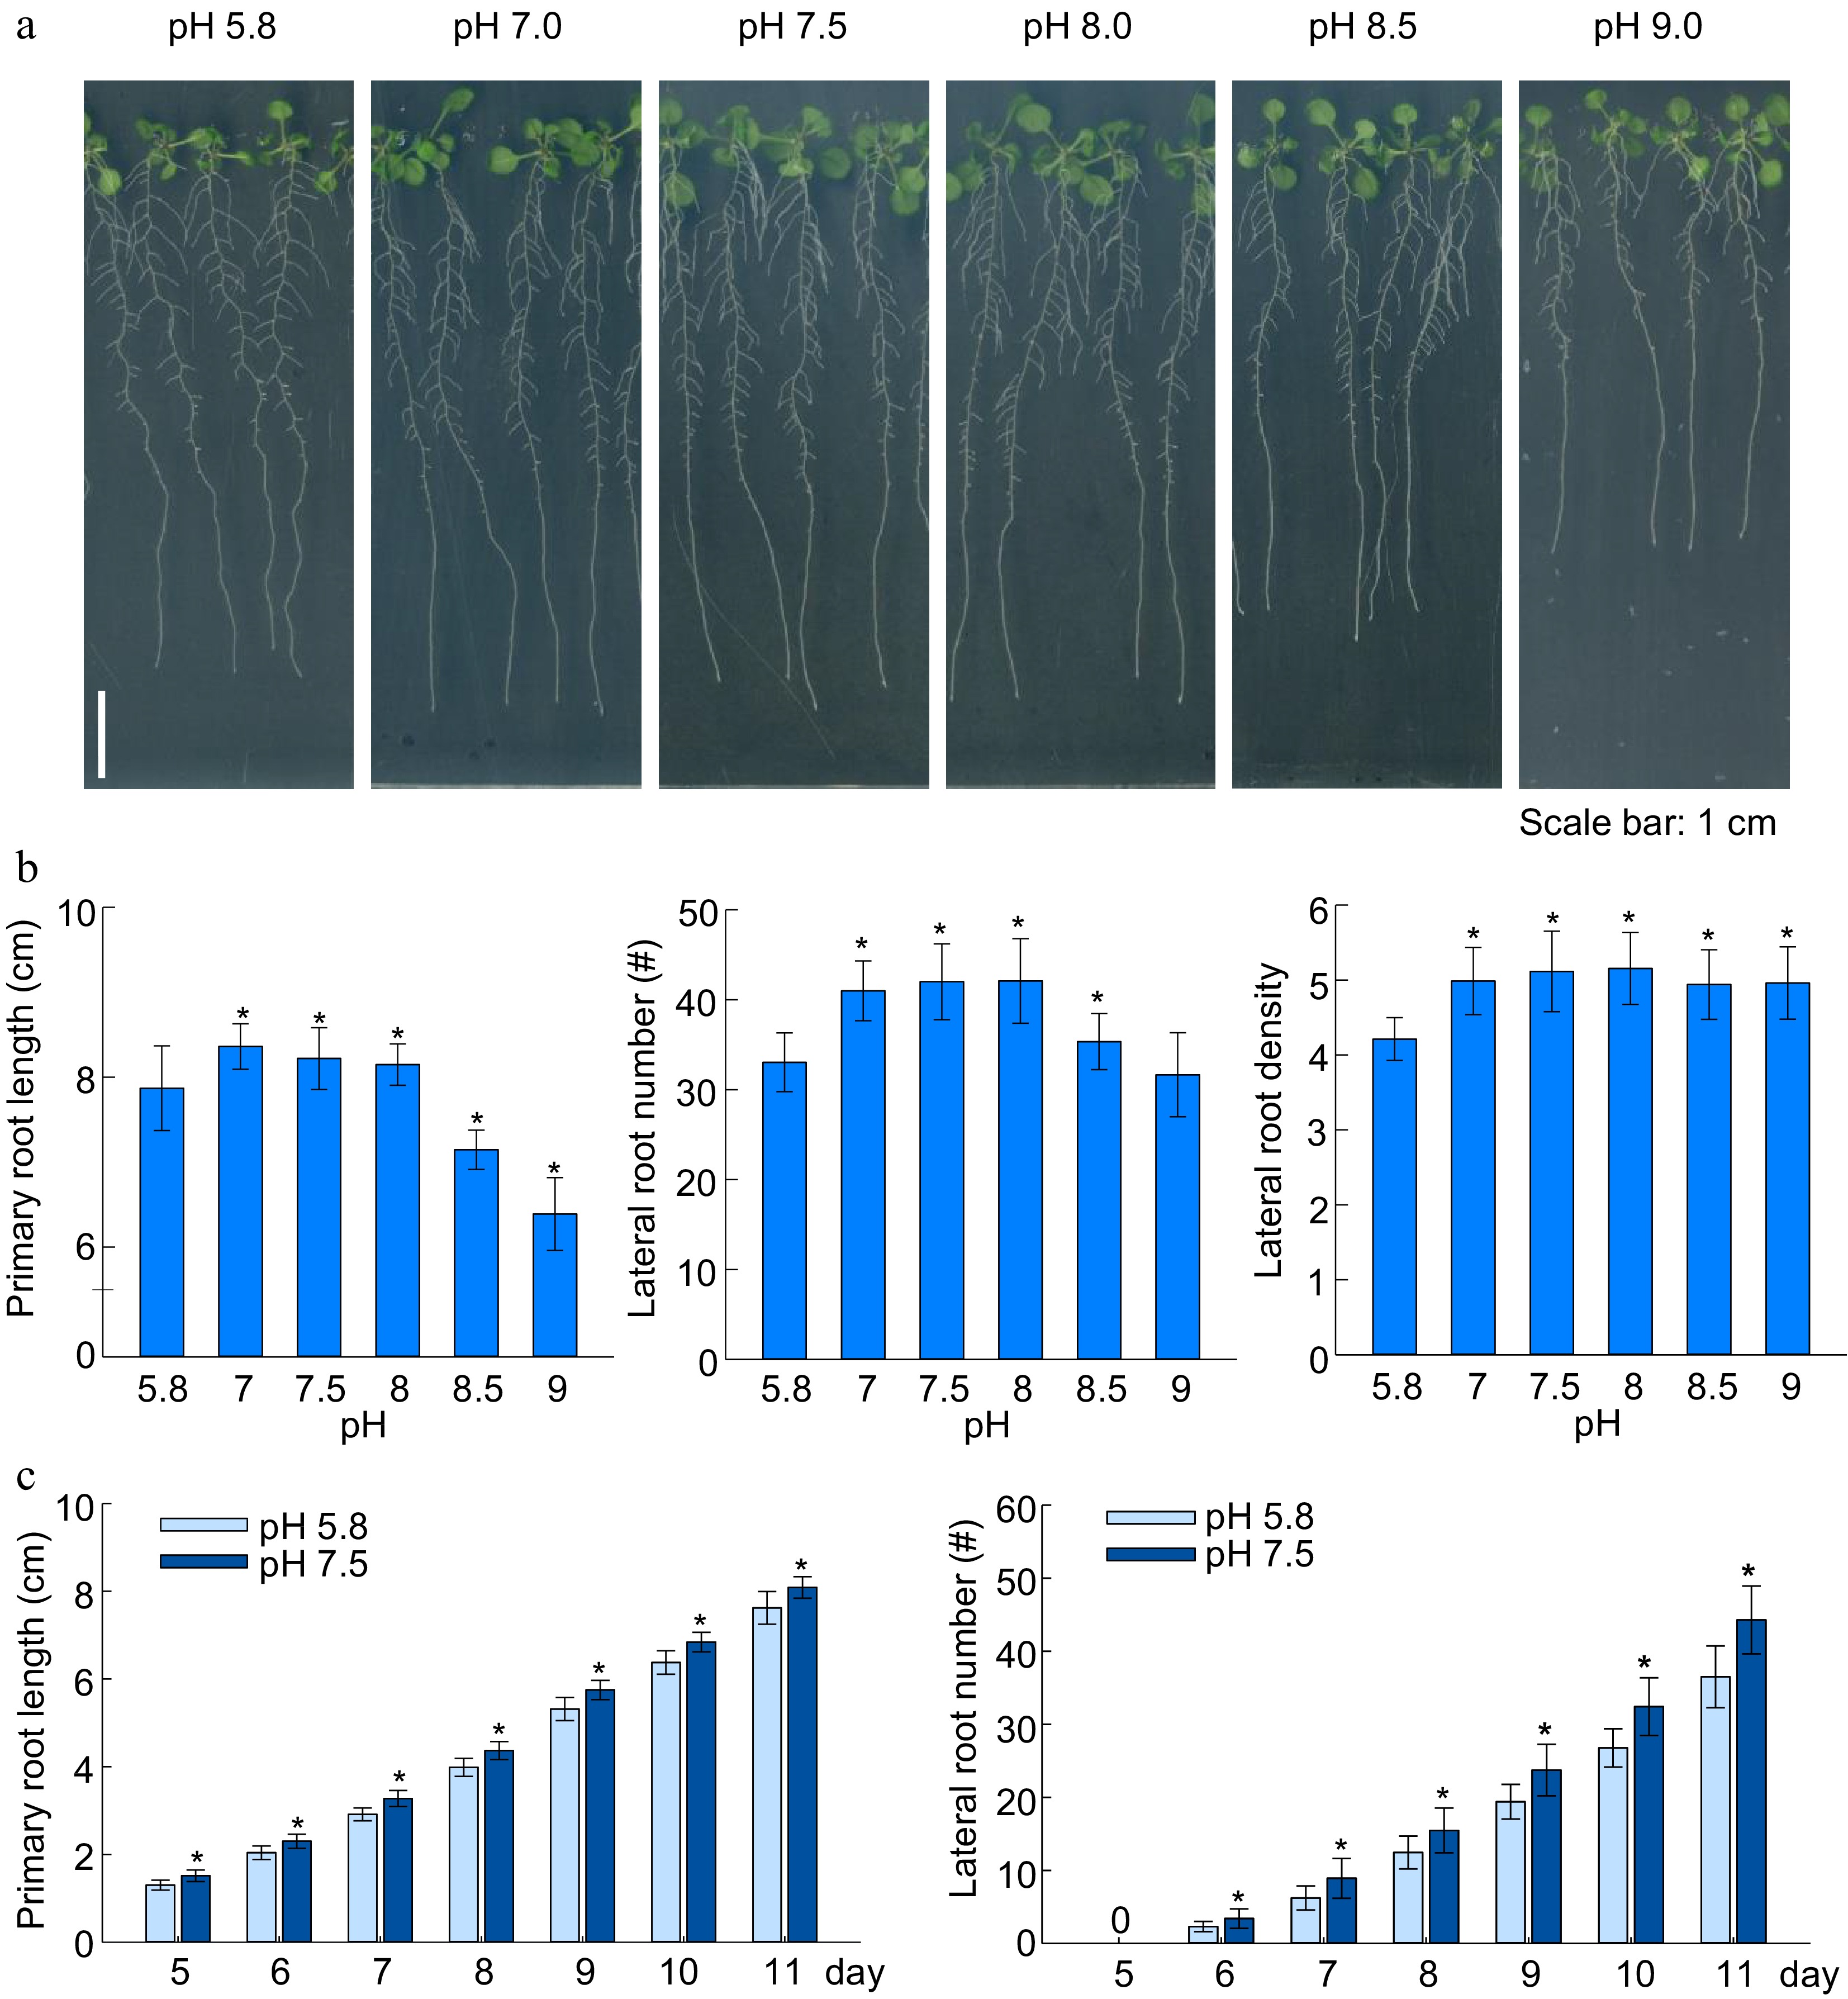
Figure 1.
Effects of alkaline and acidic pH on plant root growth. (a) Plant growth status, (b) primary root length, lateral root number, lateral root density; (c) dynamic changes of root growth of Arabidopsis under slightly alkaline (7.5) and the standard (5.8) pH cultivation. (means ± SD, asterisks denote significant differences compared with control condition pH 5.8, * p < 0.05; ** p < 0.01, n ≥ 8) (Student t-test, Bar = 1 cm).
-
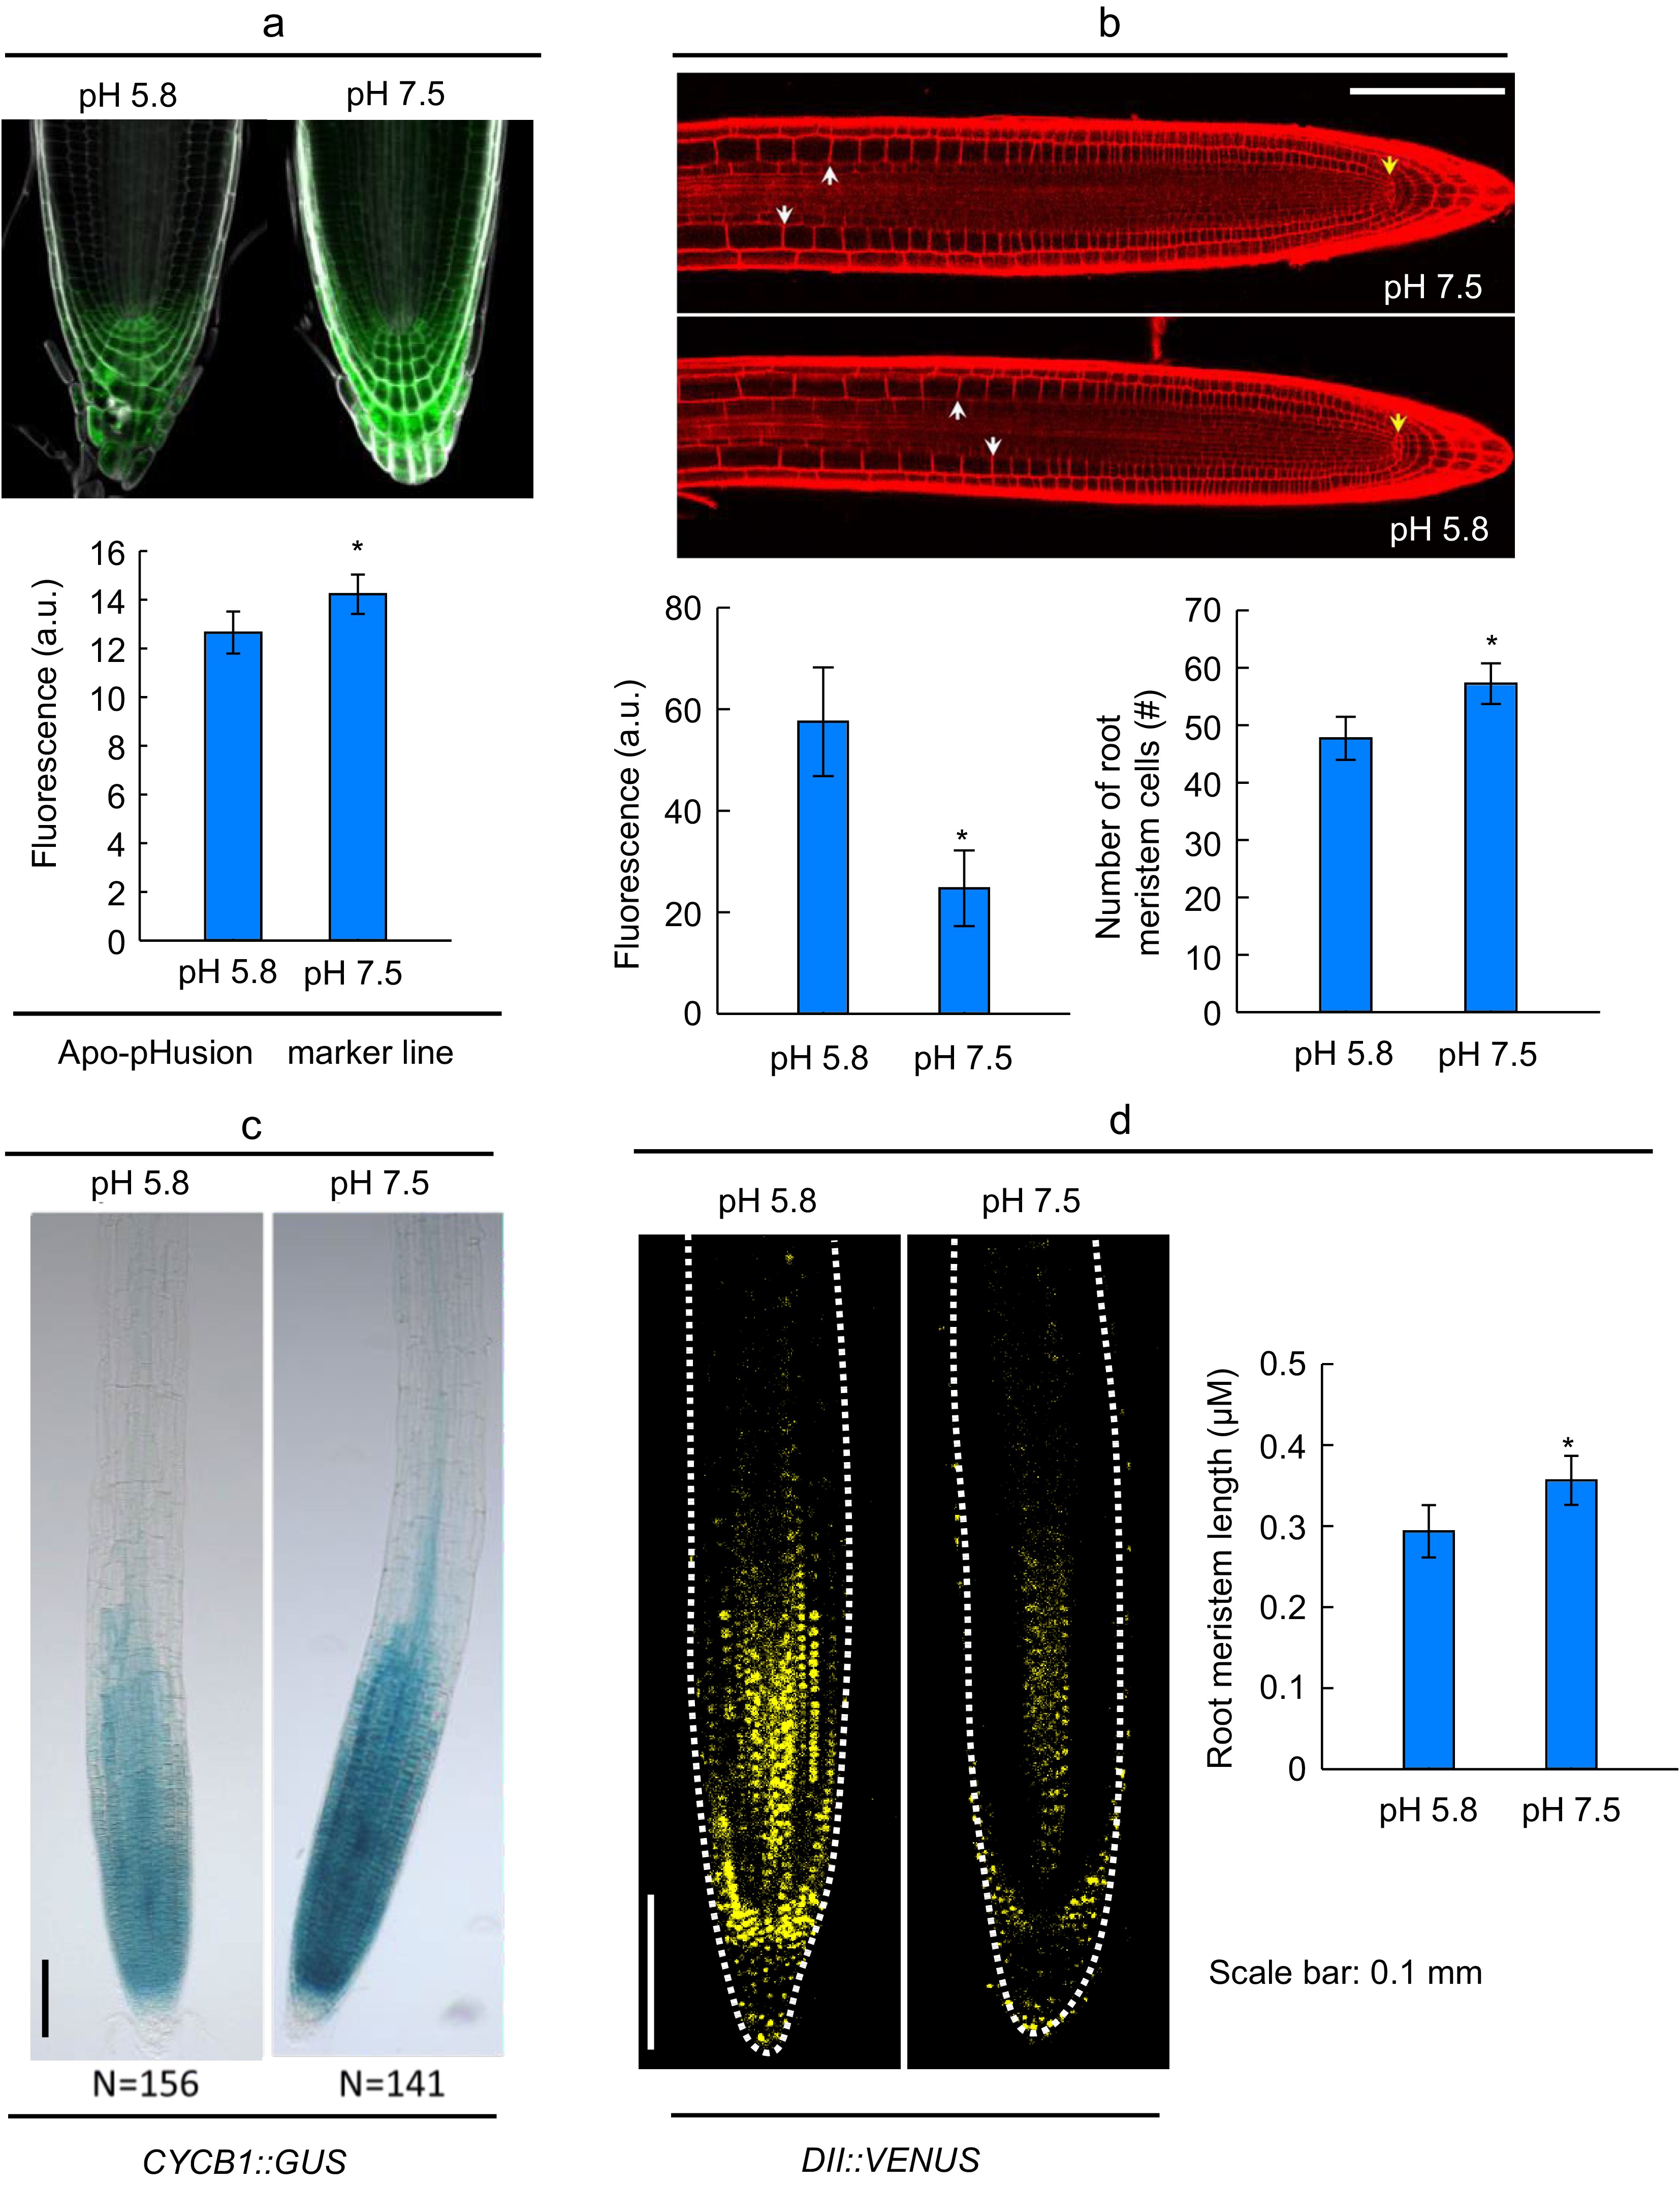
Figure 2.
Effect of slightly alkaline pH on apoplast alkalinization, auxin signal, number of stem cells, and cell cycle in primary root apex. (a), (b) Localization and quantifications of apoplastic pH in the apo-pHusion marker line in the root meristem zone of light-grown Col-0 seedlings. (c), (d) the status of the meristem of primary root apex, yellow arrows indicate quiescent center, white arrows indicate the boundary between meristem zone and elongation zone, and the column charts showed the number of root meristem cells, root meristem length. (e) GUS staining showed the expression of CYCB1 in primary root apex. (f) Fluorescent protein in root apex of DII:VENUS. Bar = 0.1 mm, and the quantitative fluorescence strength were showed in the chart, n ≥ 8. (Means ± SD, asterisks denote significant differences between columns at * p < 0.05; ** p < 0.01, n ≥ 8). (Student t-test, Bar = 0.1 mm).
-
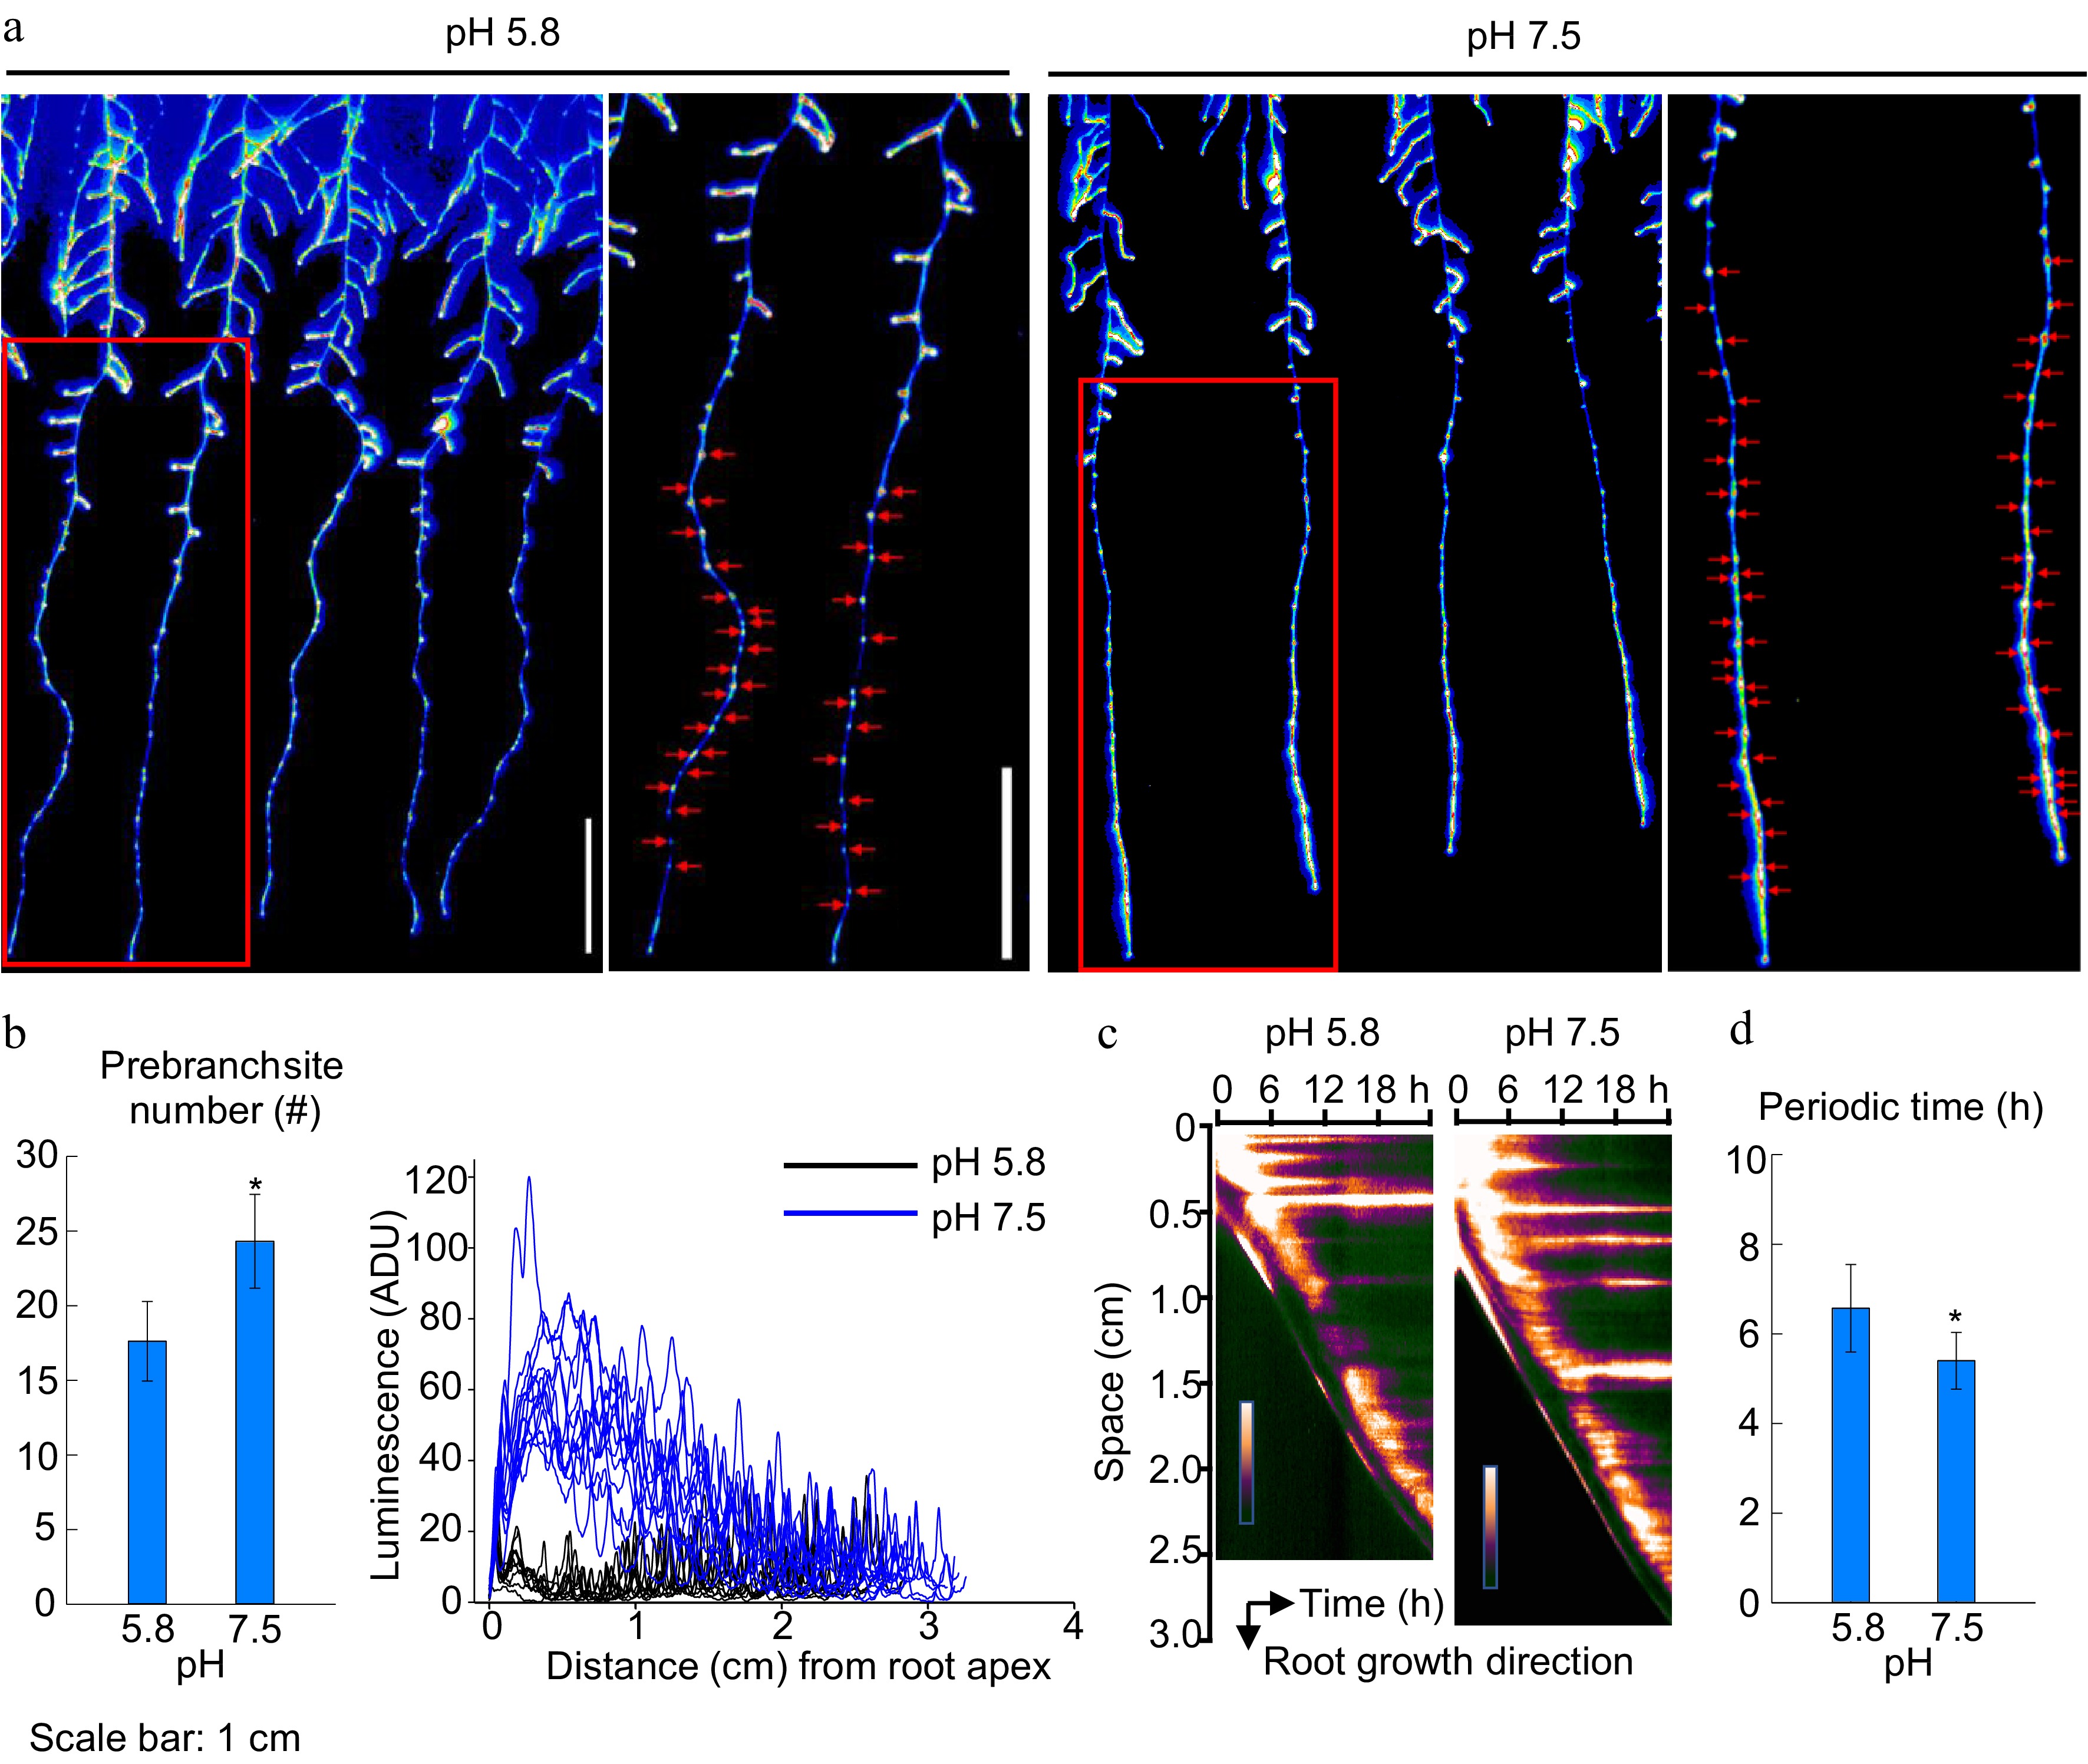
Figure 3.
Expression of Luciferase, prebranch sites and signal frequency in Arabidopsis DR5:Luciferase root. (a) Expression of Luciferase, red arrows indicate prebranch sites, (b) prebranch site number and luminescence, (c), (d) position of oscillation region signal and the cycle of biological clock signals. (Means ± SD, asterisks denote significant differences between columns at * p < 0.05; ** p < 0.01, n ≥ 8). (Student t-test, Bar = 1 cm).
-
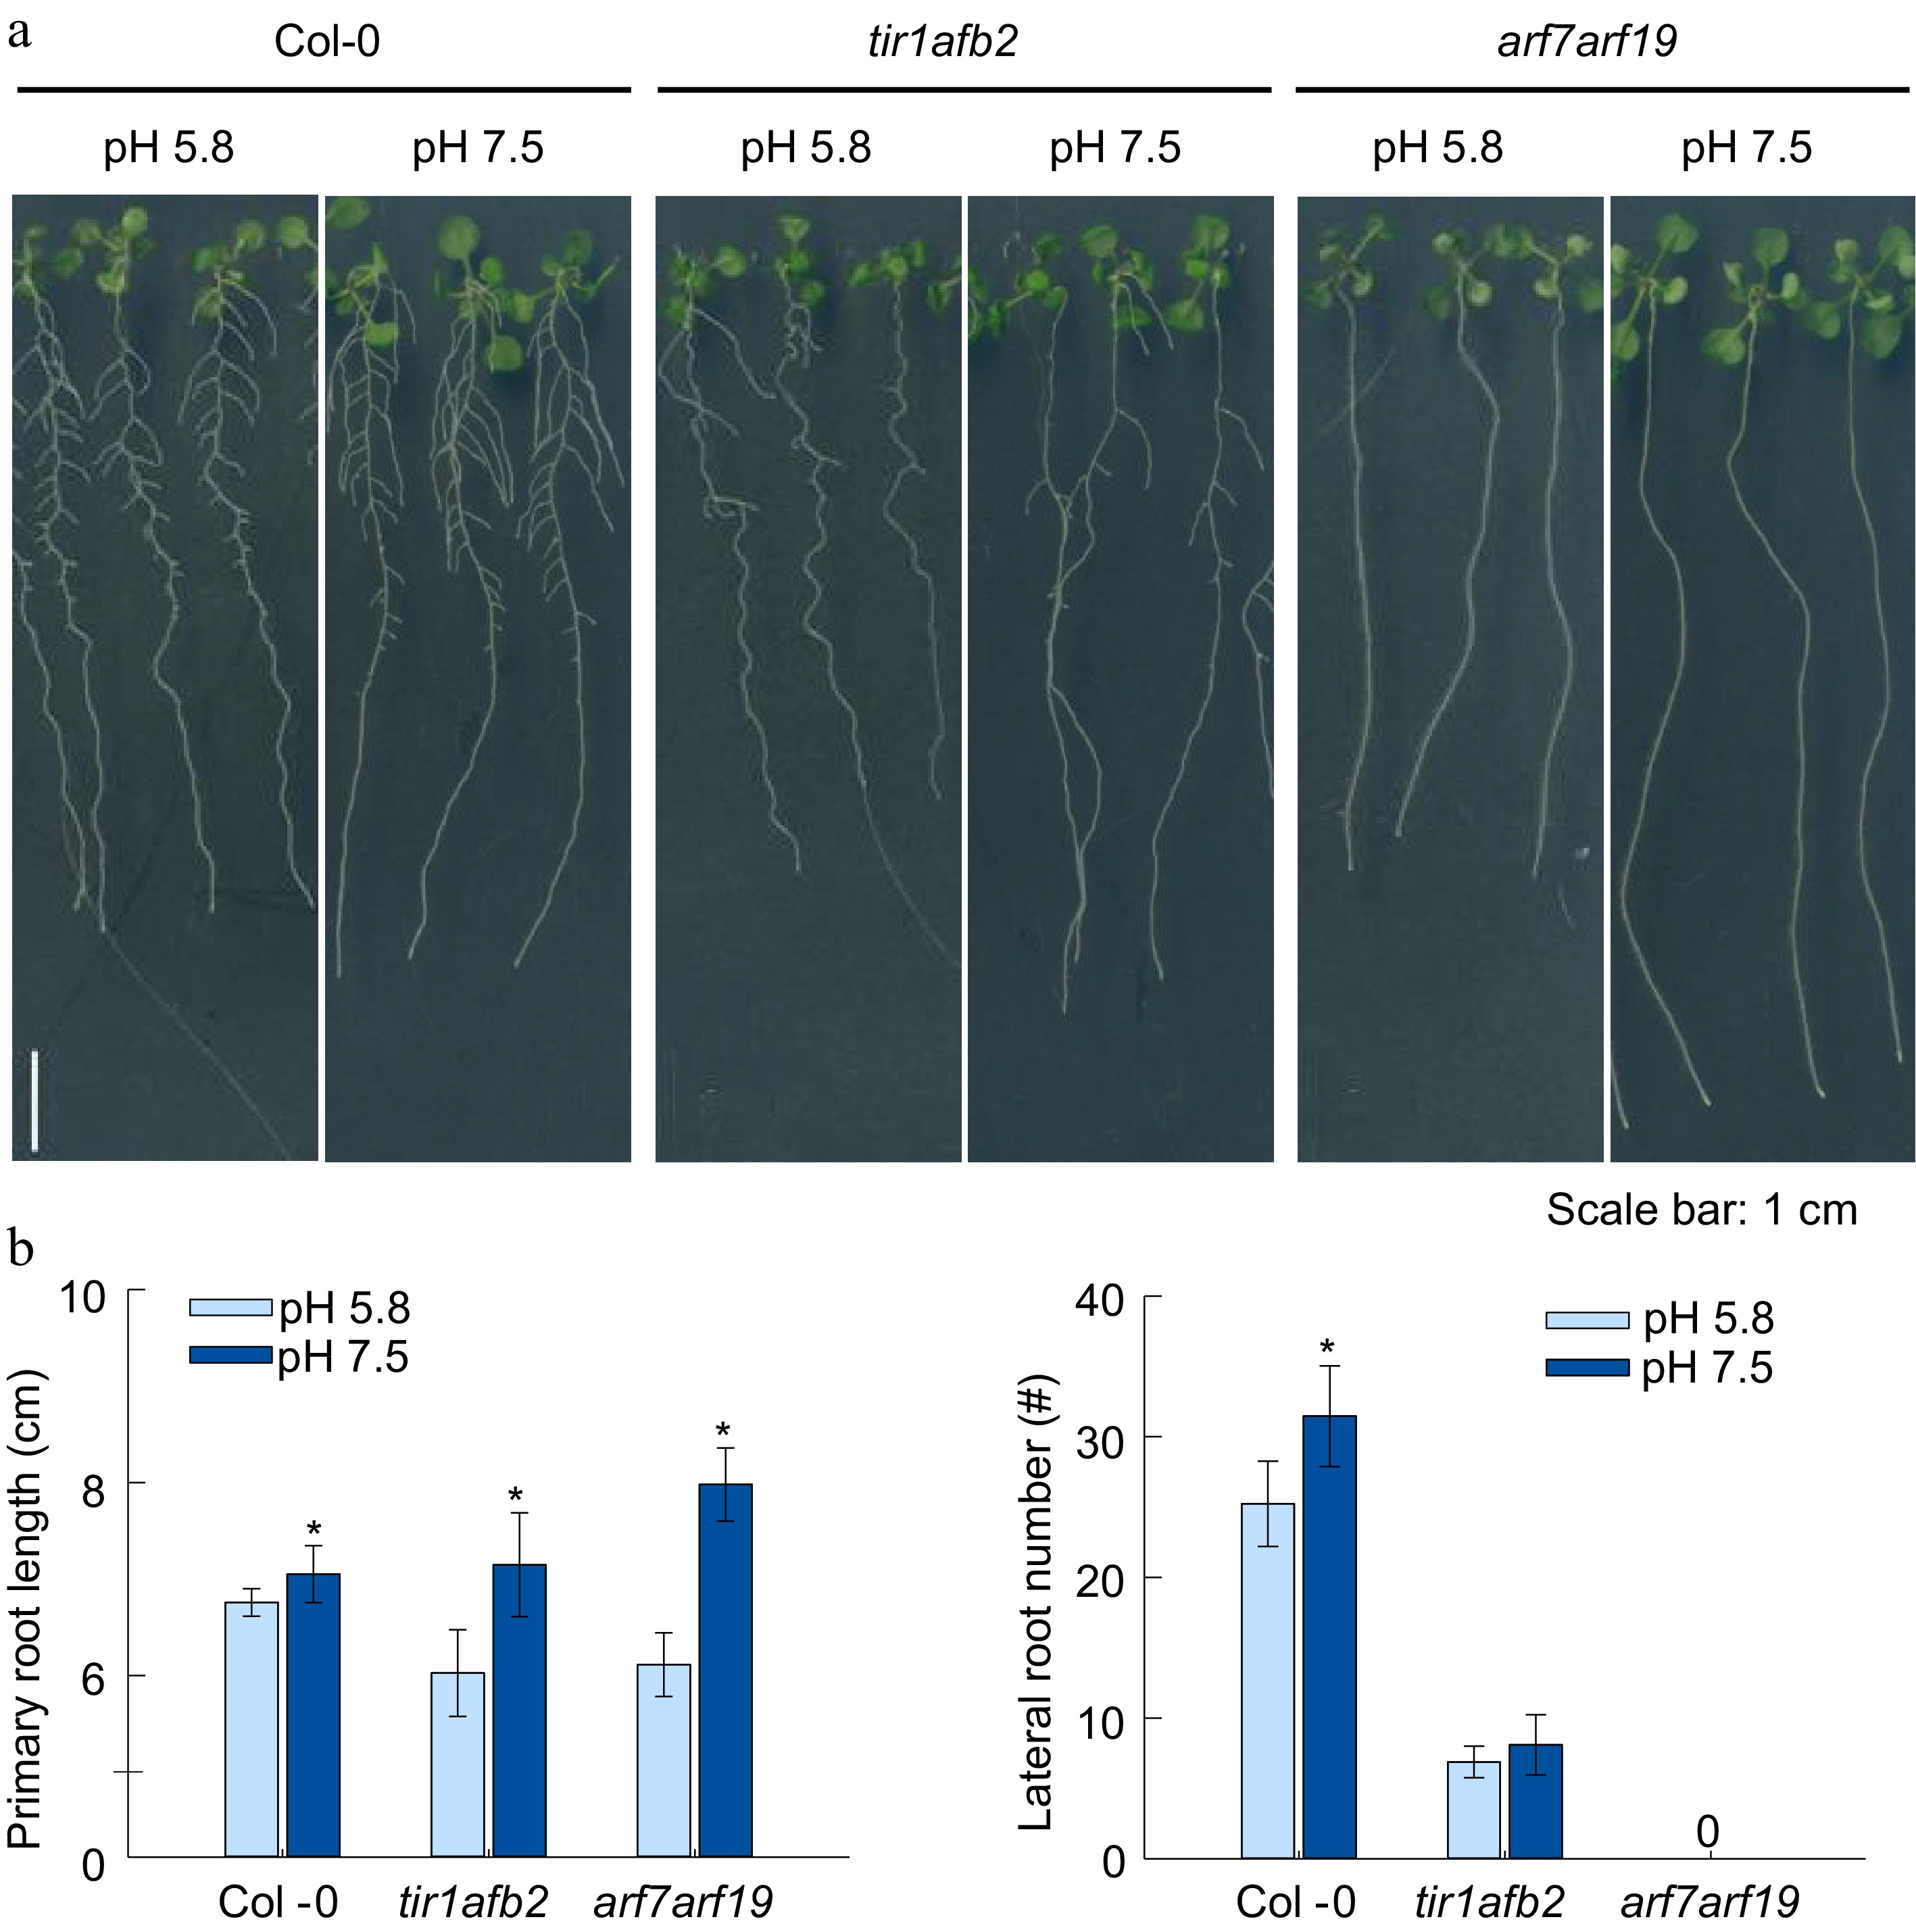
Figure 4.
Effects of alkaline conditions on the root growth of arabidopsis mutants tir1afb2 and arf7arf19. (a) Plant growth status, (b) primary root length, lateral root number. (Means ± SD, asterisks denote significant differences compared with control condition (pH 5.8) at * p < 0.05; ** p < 0.01, n ≥ 8, n.d., not detected). (Student t-test, Bar = 1 cm ).
-
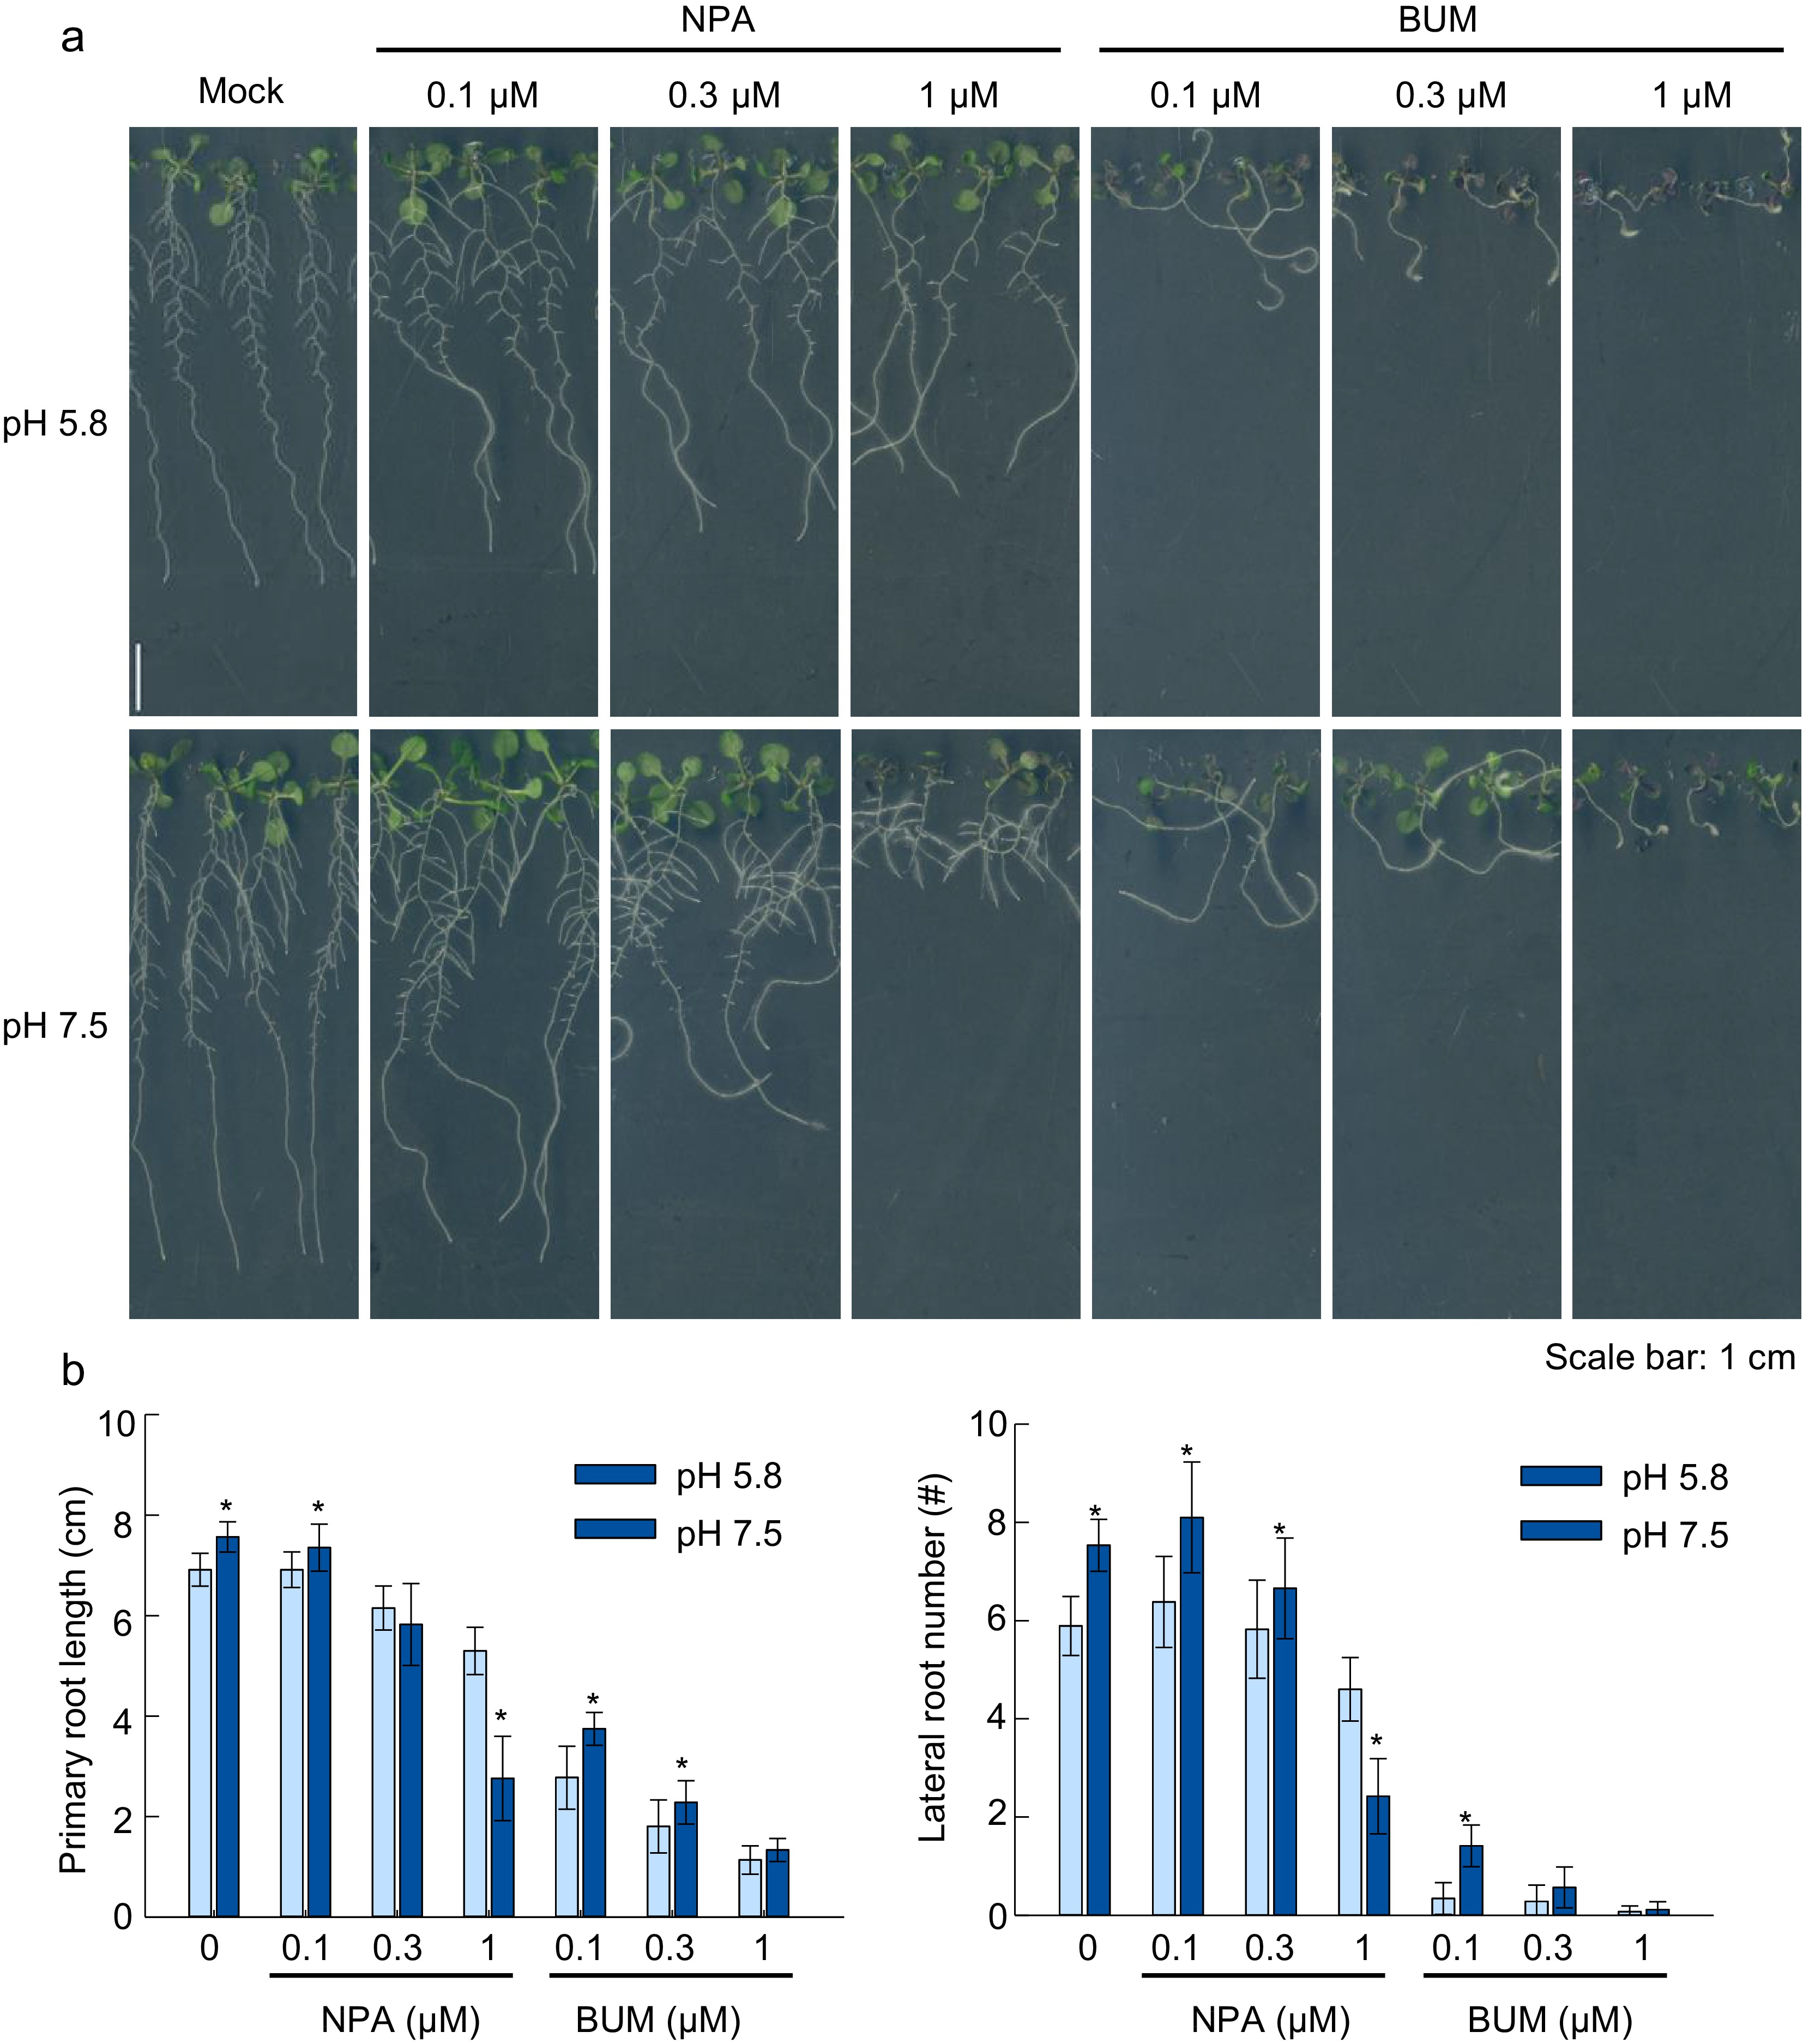
Figure 5.
Effects of auxin transport inhibitors NPA and BUM on root growth under alkaline conditions. (a) Plant growth status, (b) primary root length, lateral root number. (Means ± SD, asterisks denote significant differences compared with control conditions (pH 5.8) at * p < 0.05; ** p < 0.01, n ≥ 8). (Student t-test, Bar = 1 cm ).
-
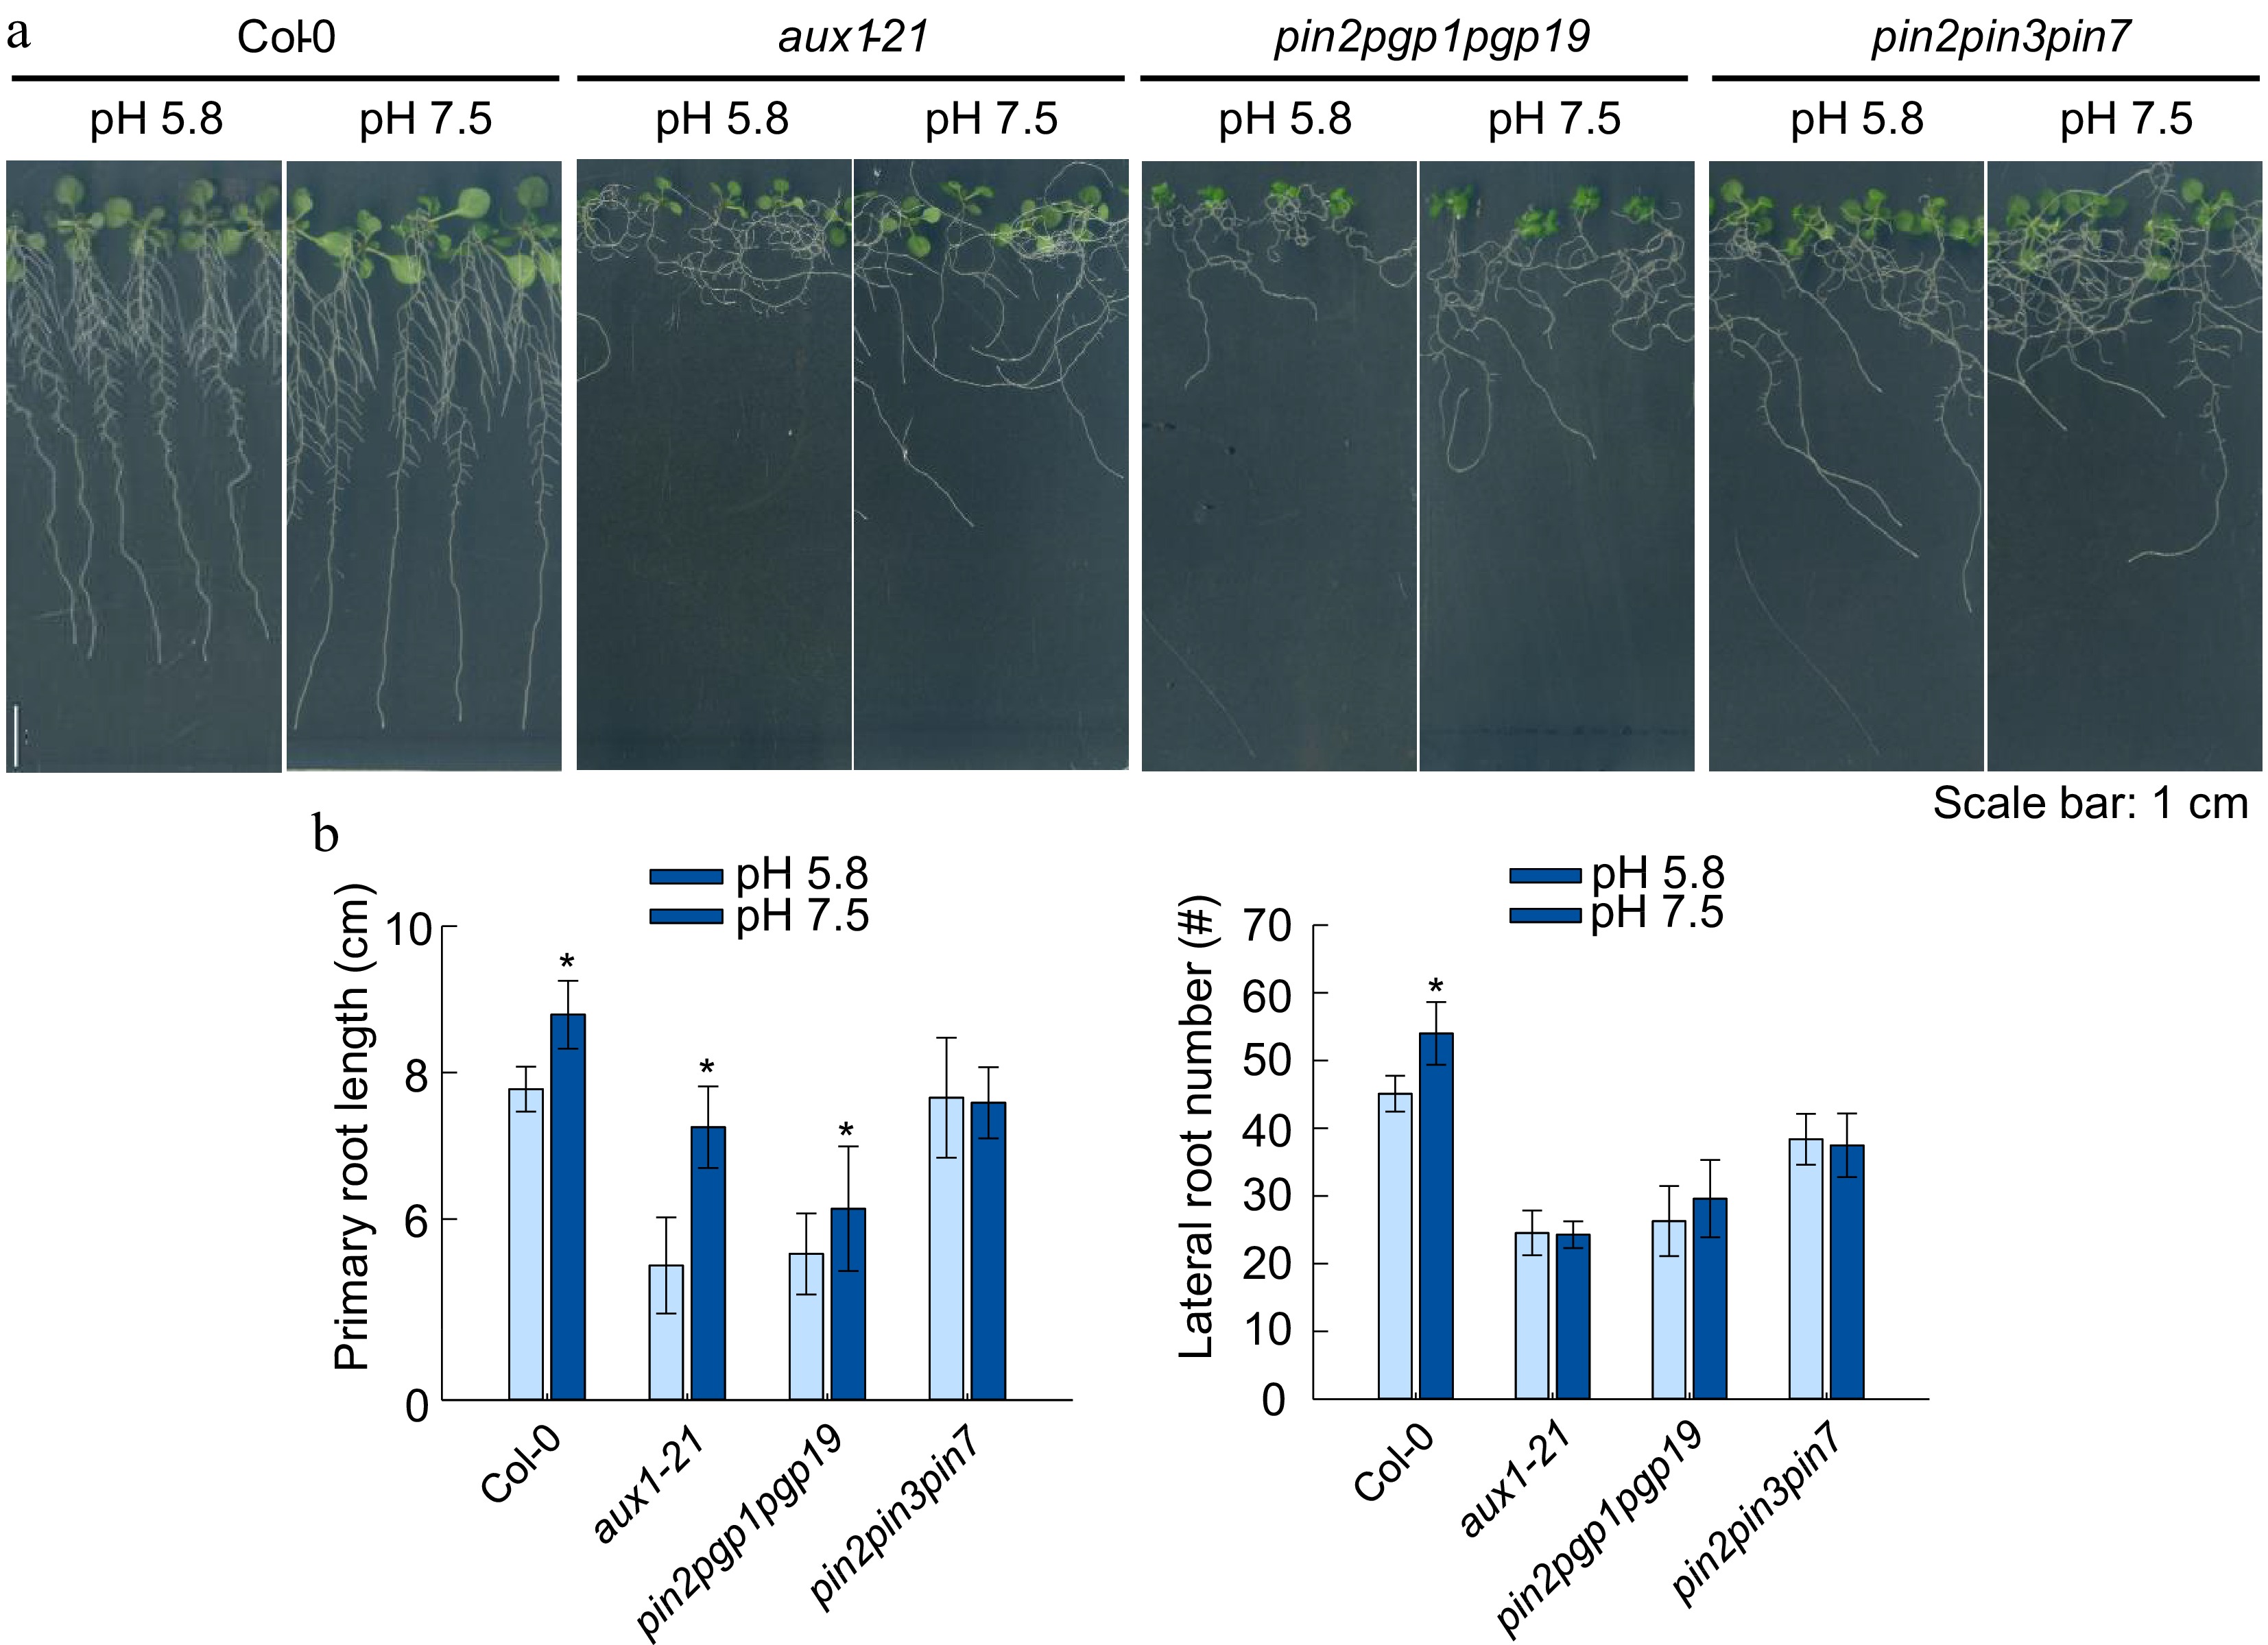
Figure 6.
Effects of alkaline conditions on the root growth of Arabidopsis mutants aux1-21, pin2pgp1pgp19, pin2pin3pin7. (a) Plant growth status, (b) primary root length, lateral root number. (Means ± SD, asterisks denote significant differences compared with control condition (pH 5.8) at * p < 0.05; ** p < 0.01, n ≥ 8). (Student t-test, Bar =1 cm ).
-
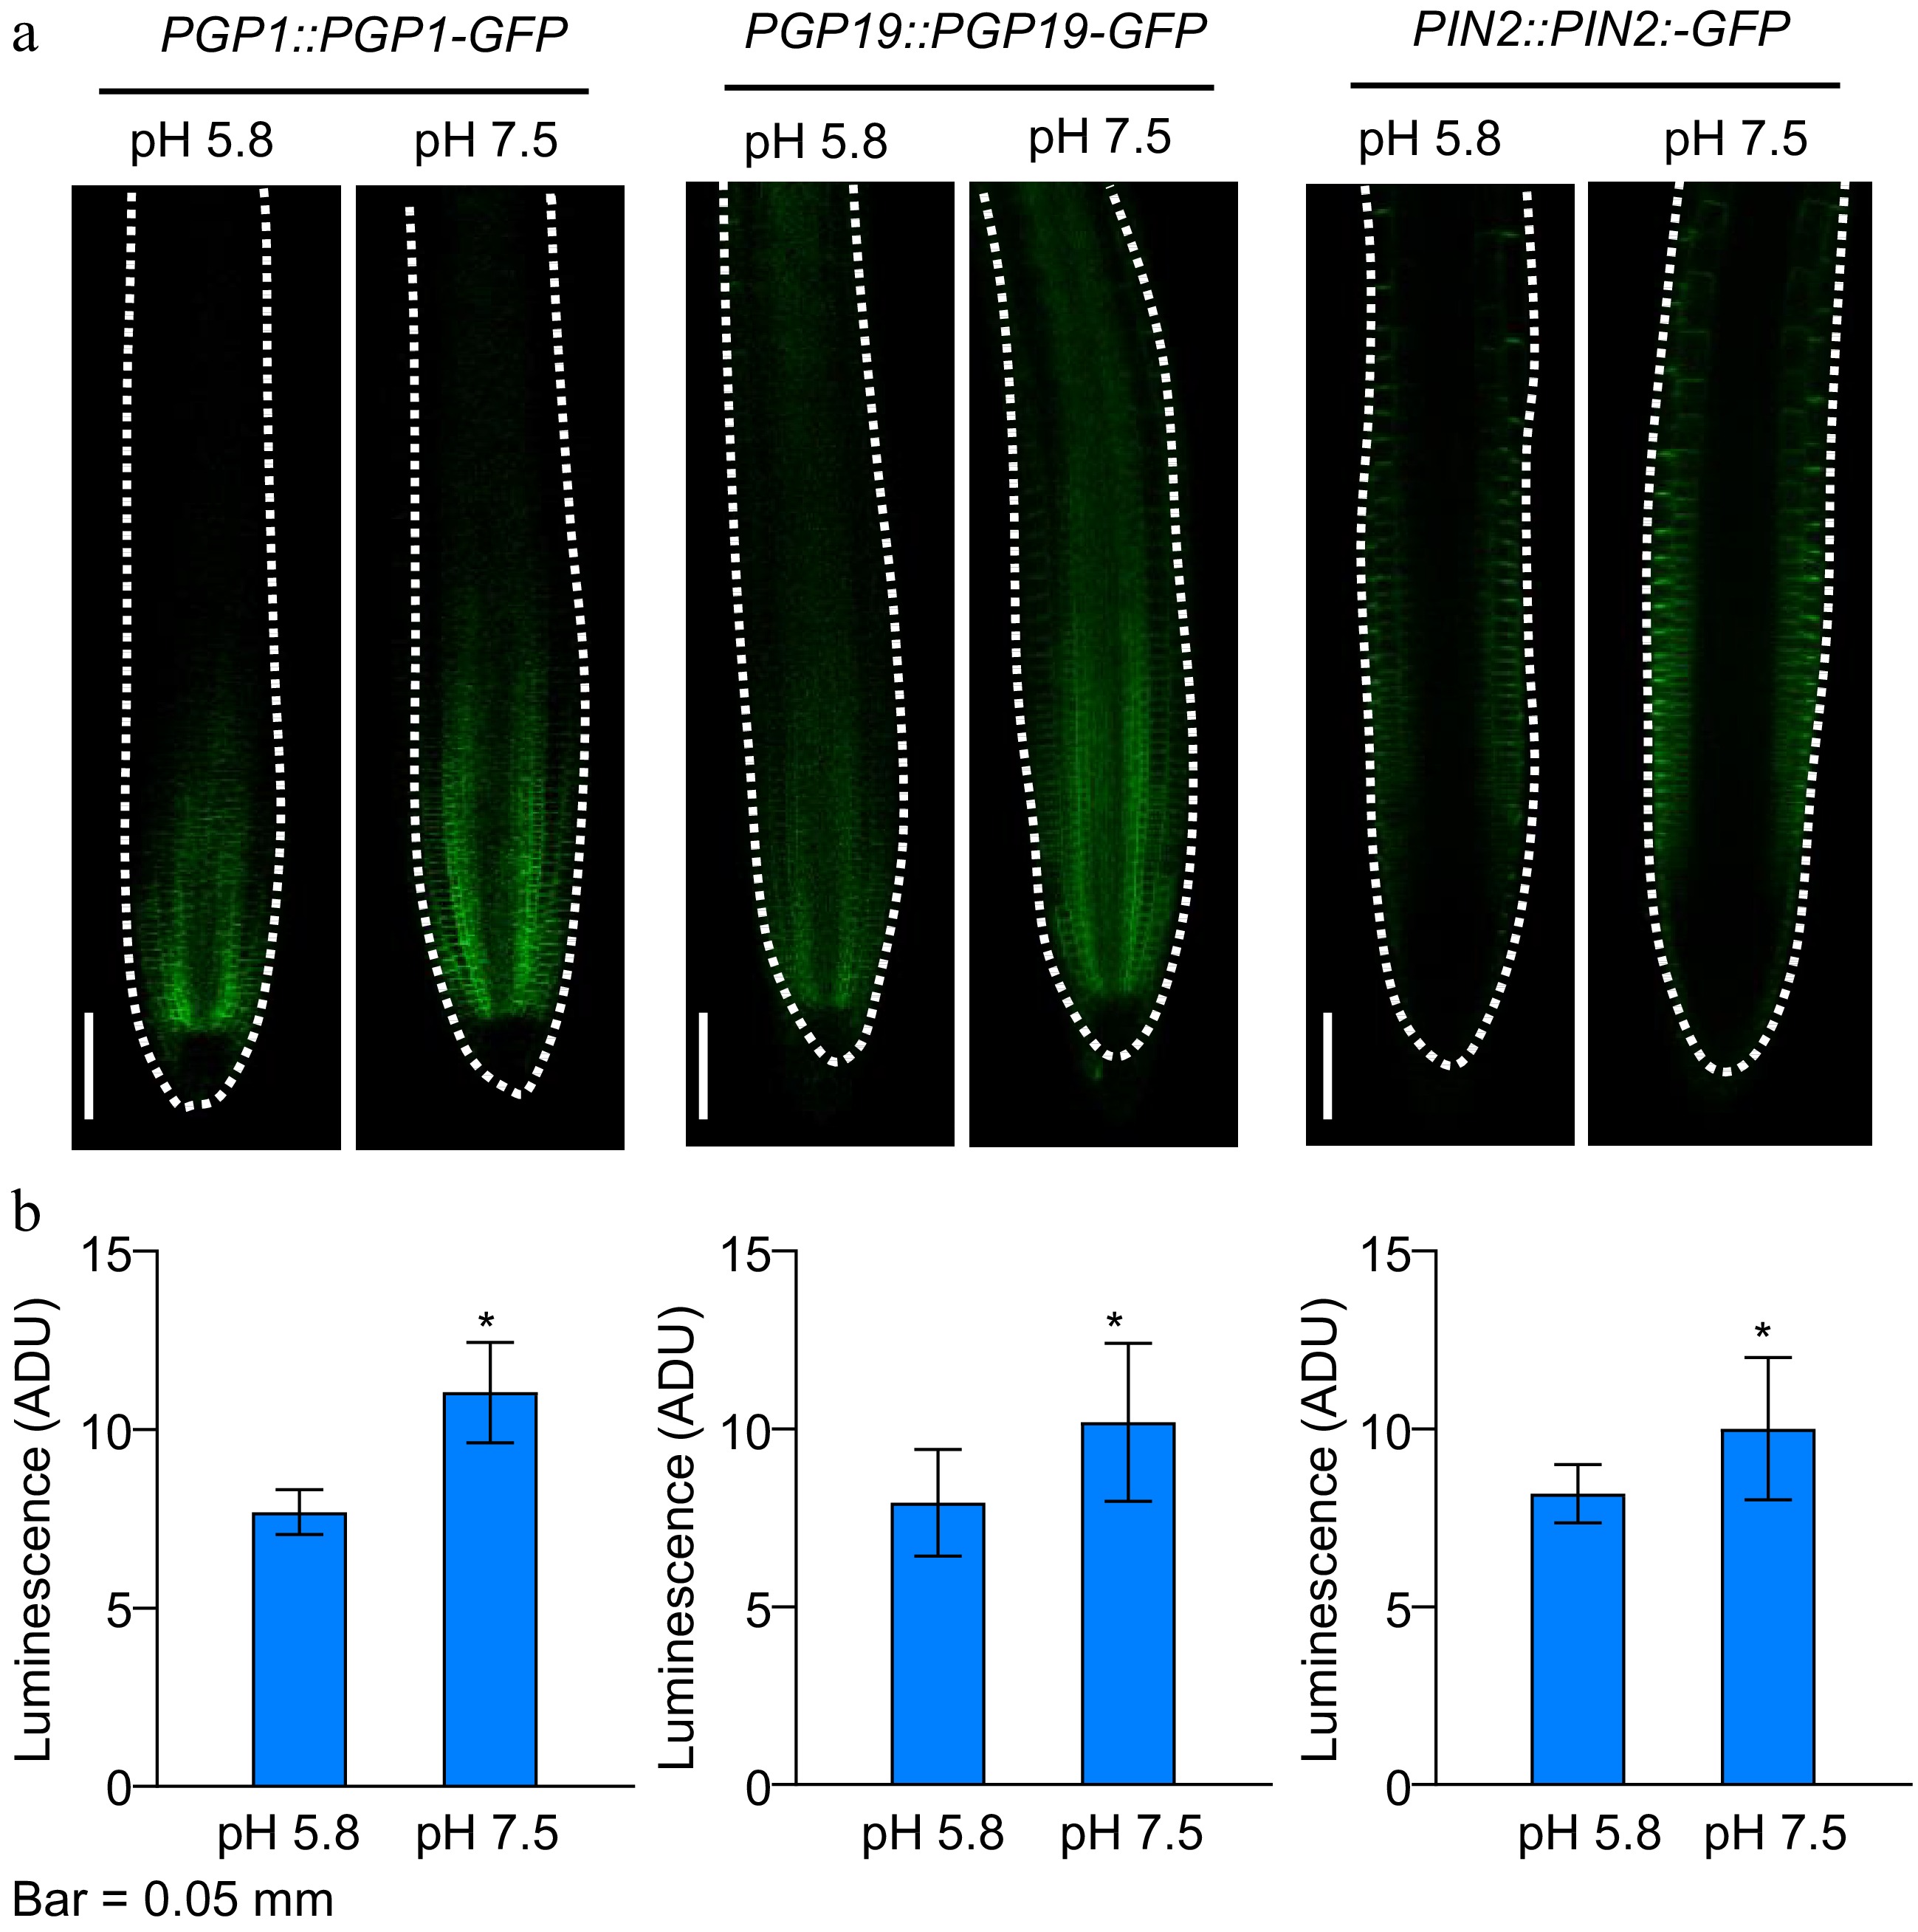
Figure 7.
Effect of slightly alkaline conditions on polar auxin transport in Arabidopsis. (a), (b) Localization and quantifications of PGP1-GFP, PGP19-GFP and PIN2-GFP signal in the root meristem zone of light-grown Col-0 seedlings. (Means ± SD, asterisks denote significant differences compared with control condition pH 5.8, * p < 0.05; ** p < 0.01, n ≥ 8). (Student t-test, Bar = 50 μm).
-
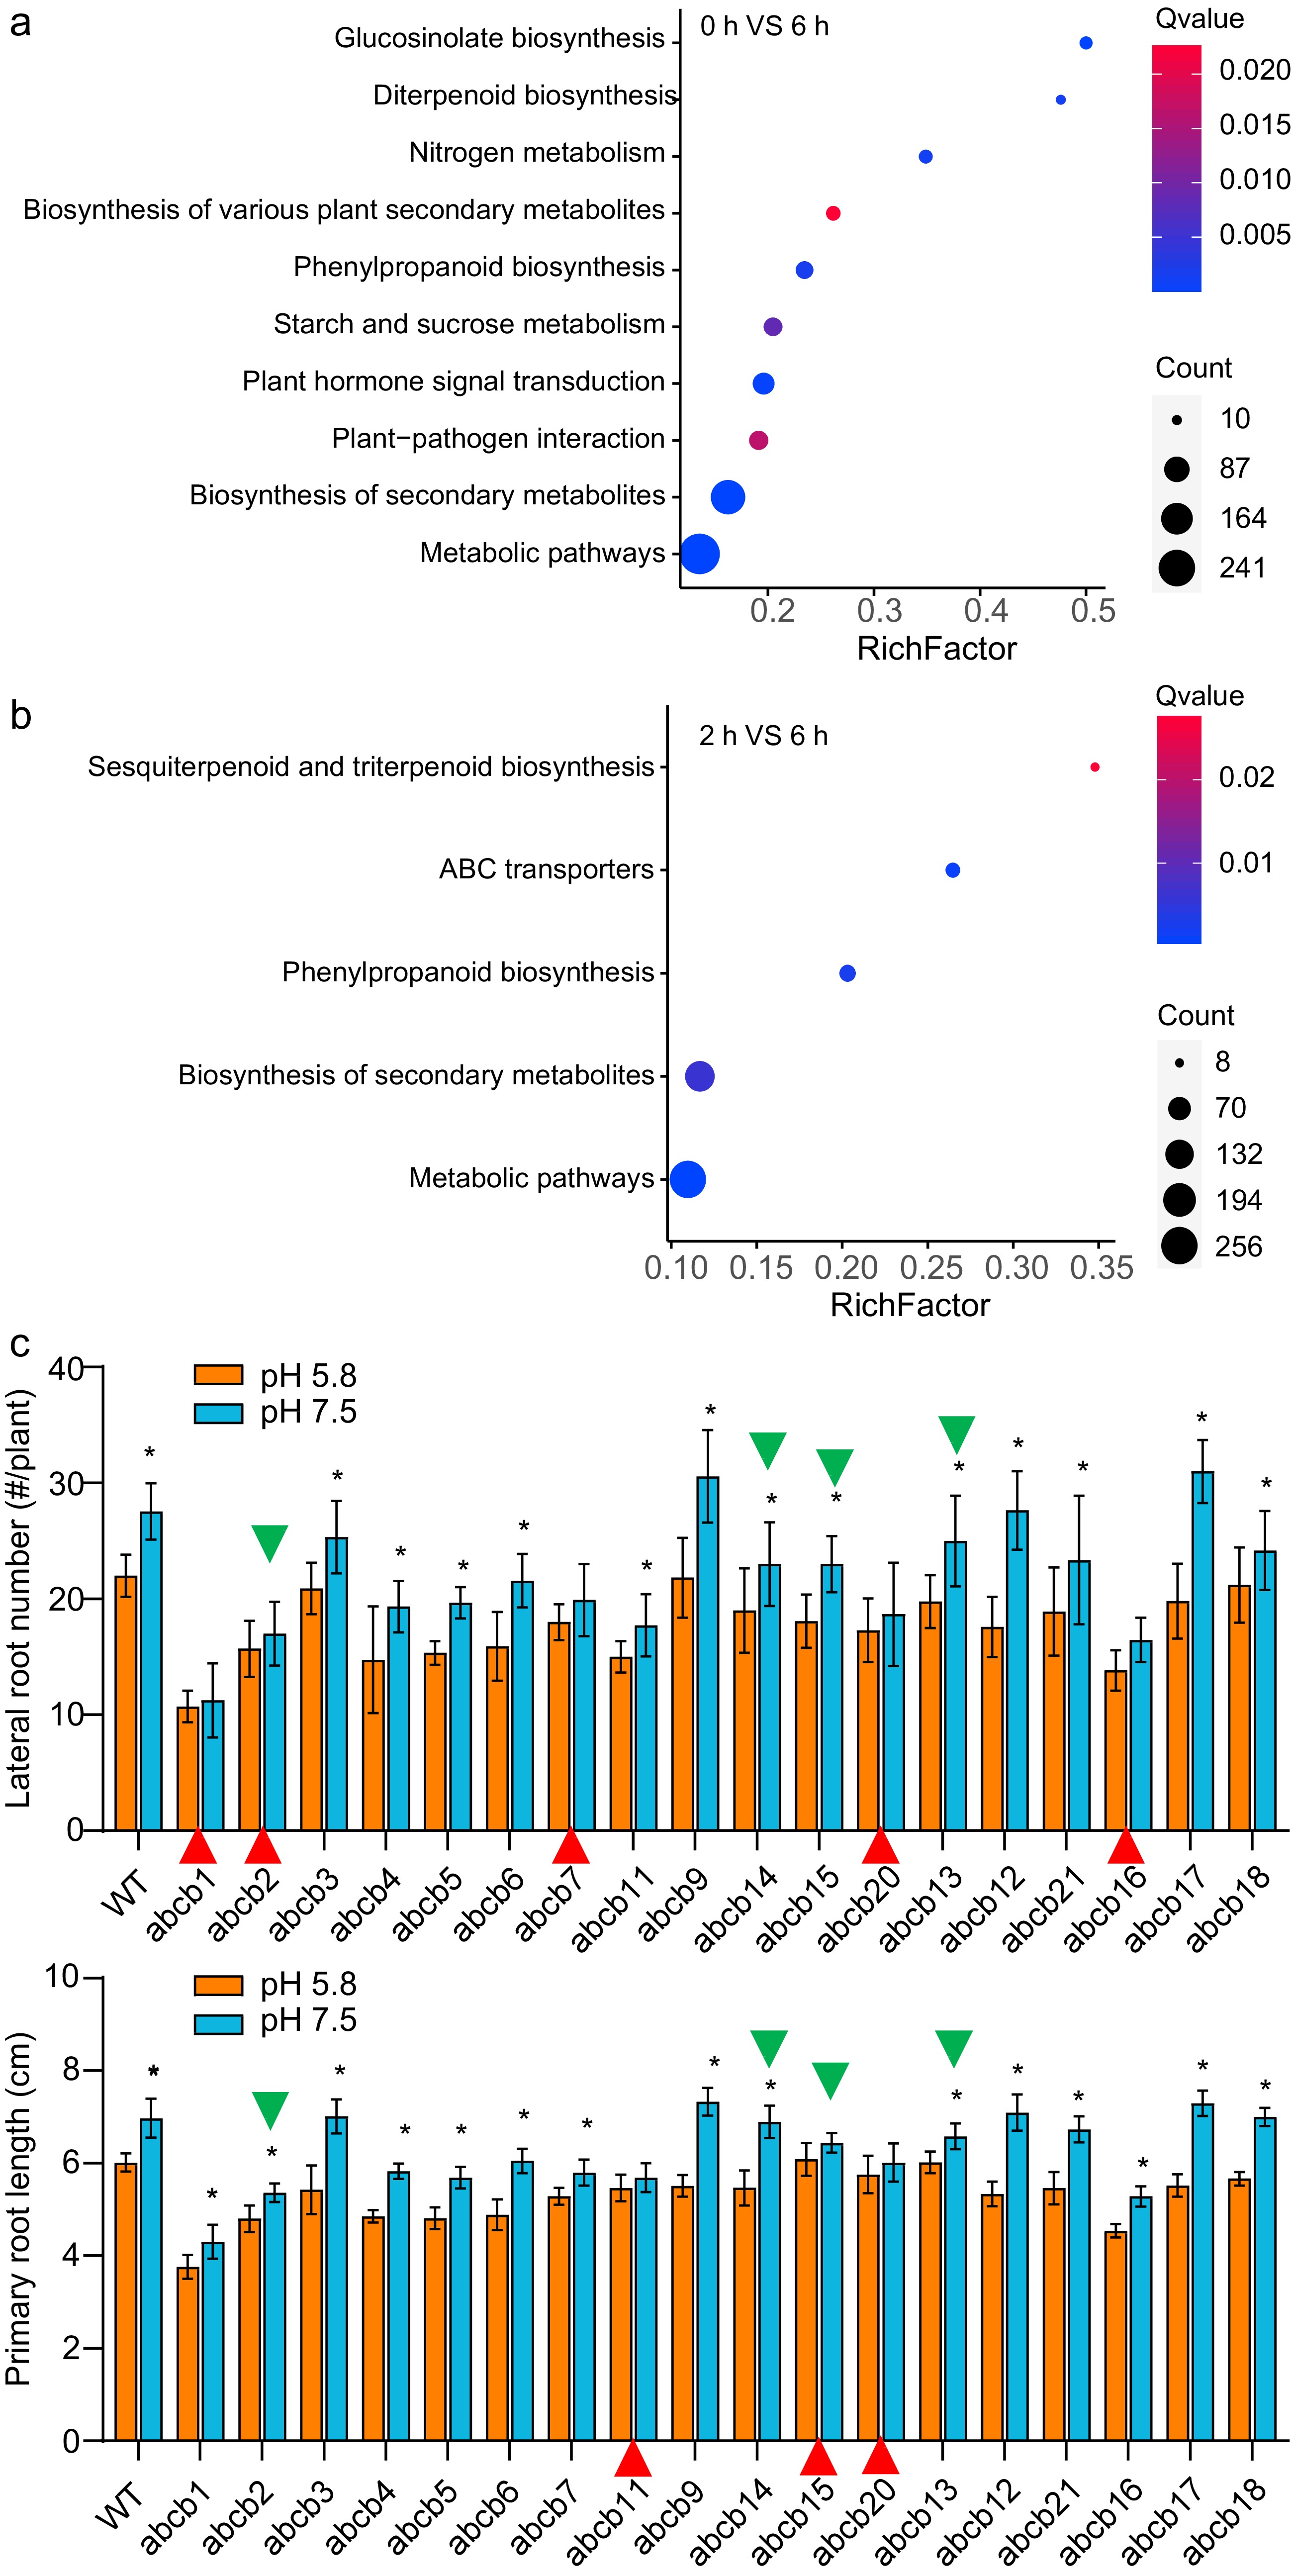
Figure 8.
Dynamic transcriptomic analysis on root tissue cultivated in pH 7.5 conditions. (a), (b), and the phenotype of ABC transporter gene mutants responding to (c) differing pH-value conditions. In (c), the green triangles showed the genes were DEGs of the 2h-VS-6h; the red triangles showed the mutants of which their primary root length or lateral root number did not response to pH 7.5.
Figures
(8)
Tables
(0)