-
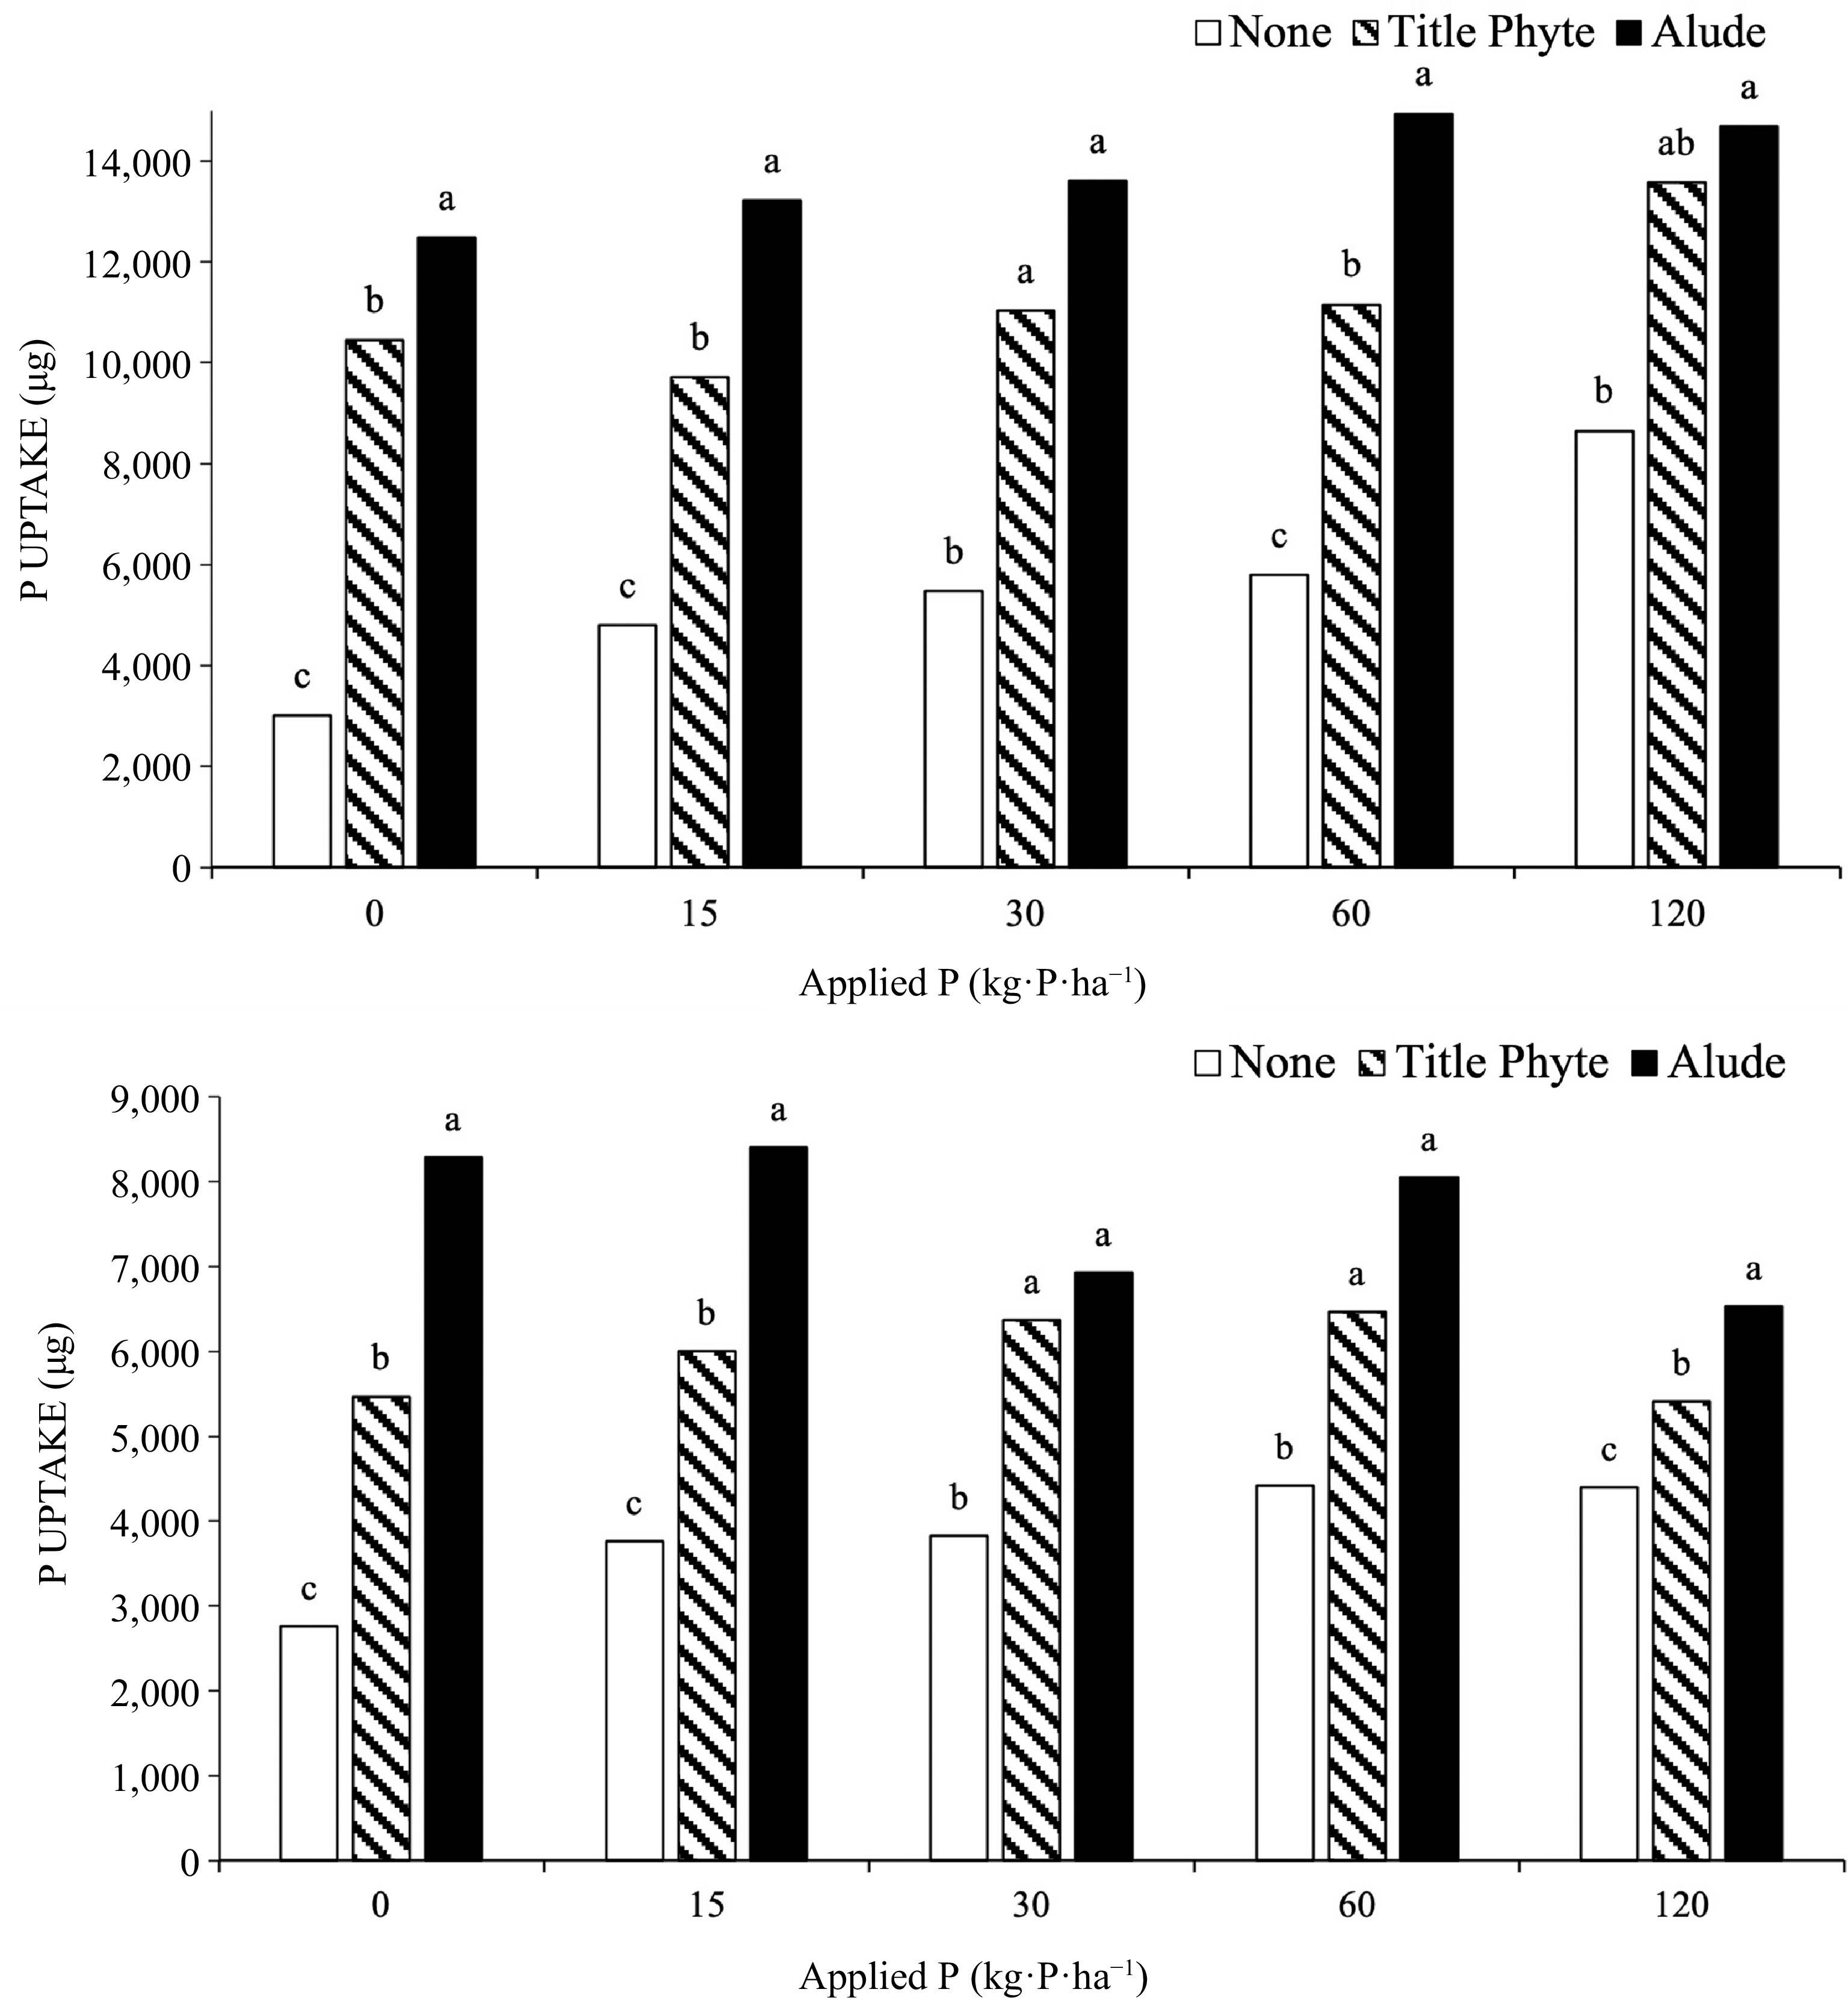
Figure 1.
Effect of P rate (provided through TSP) and phosphite products on P uptake by creeping bentgrass, Run 1 (top) and Run 2 (bottom). Treatments with the same letter above the bars are not significantly different (α = 0.05) within an experiment and each rate of P fertilization.
-
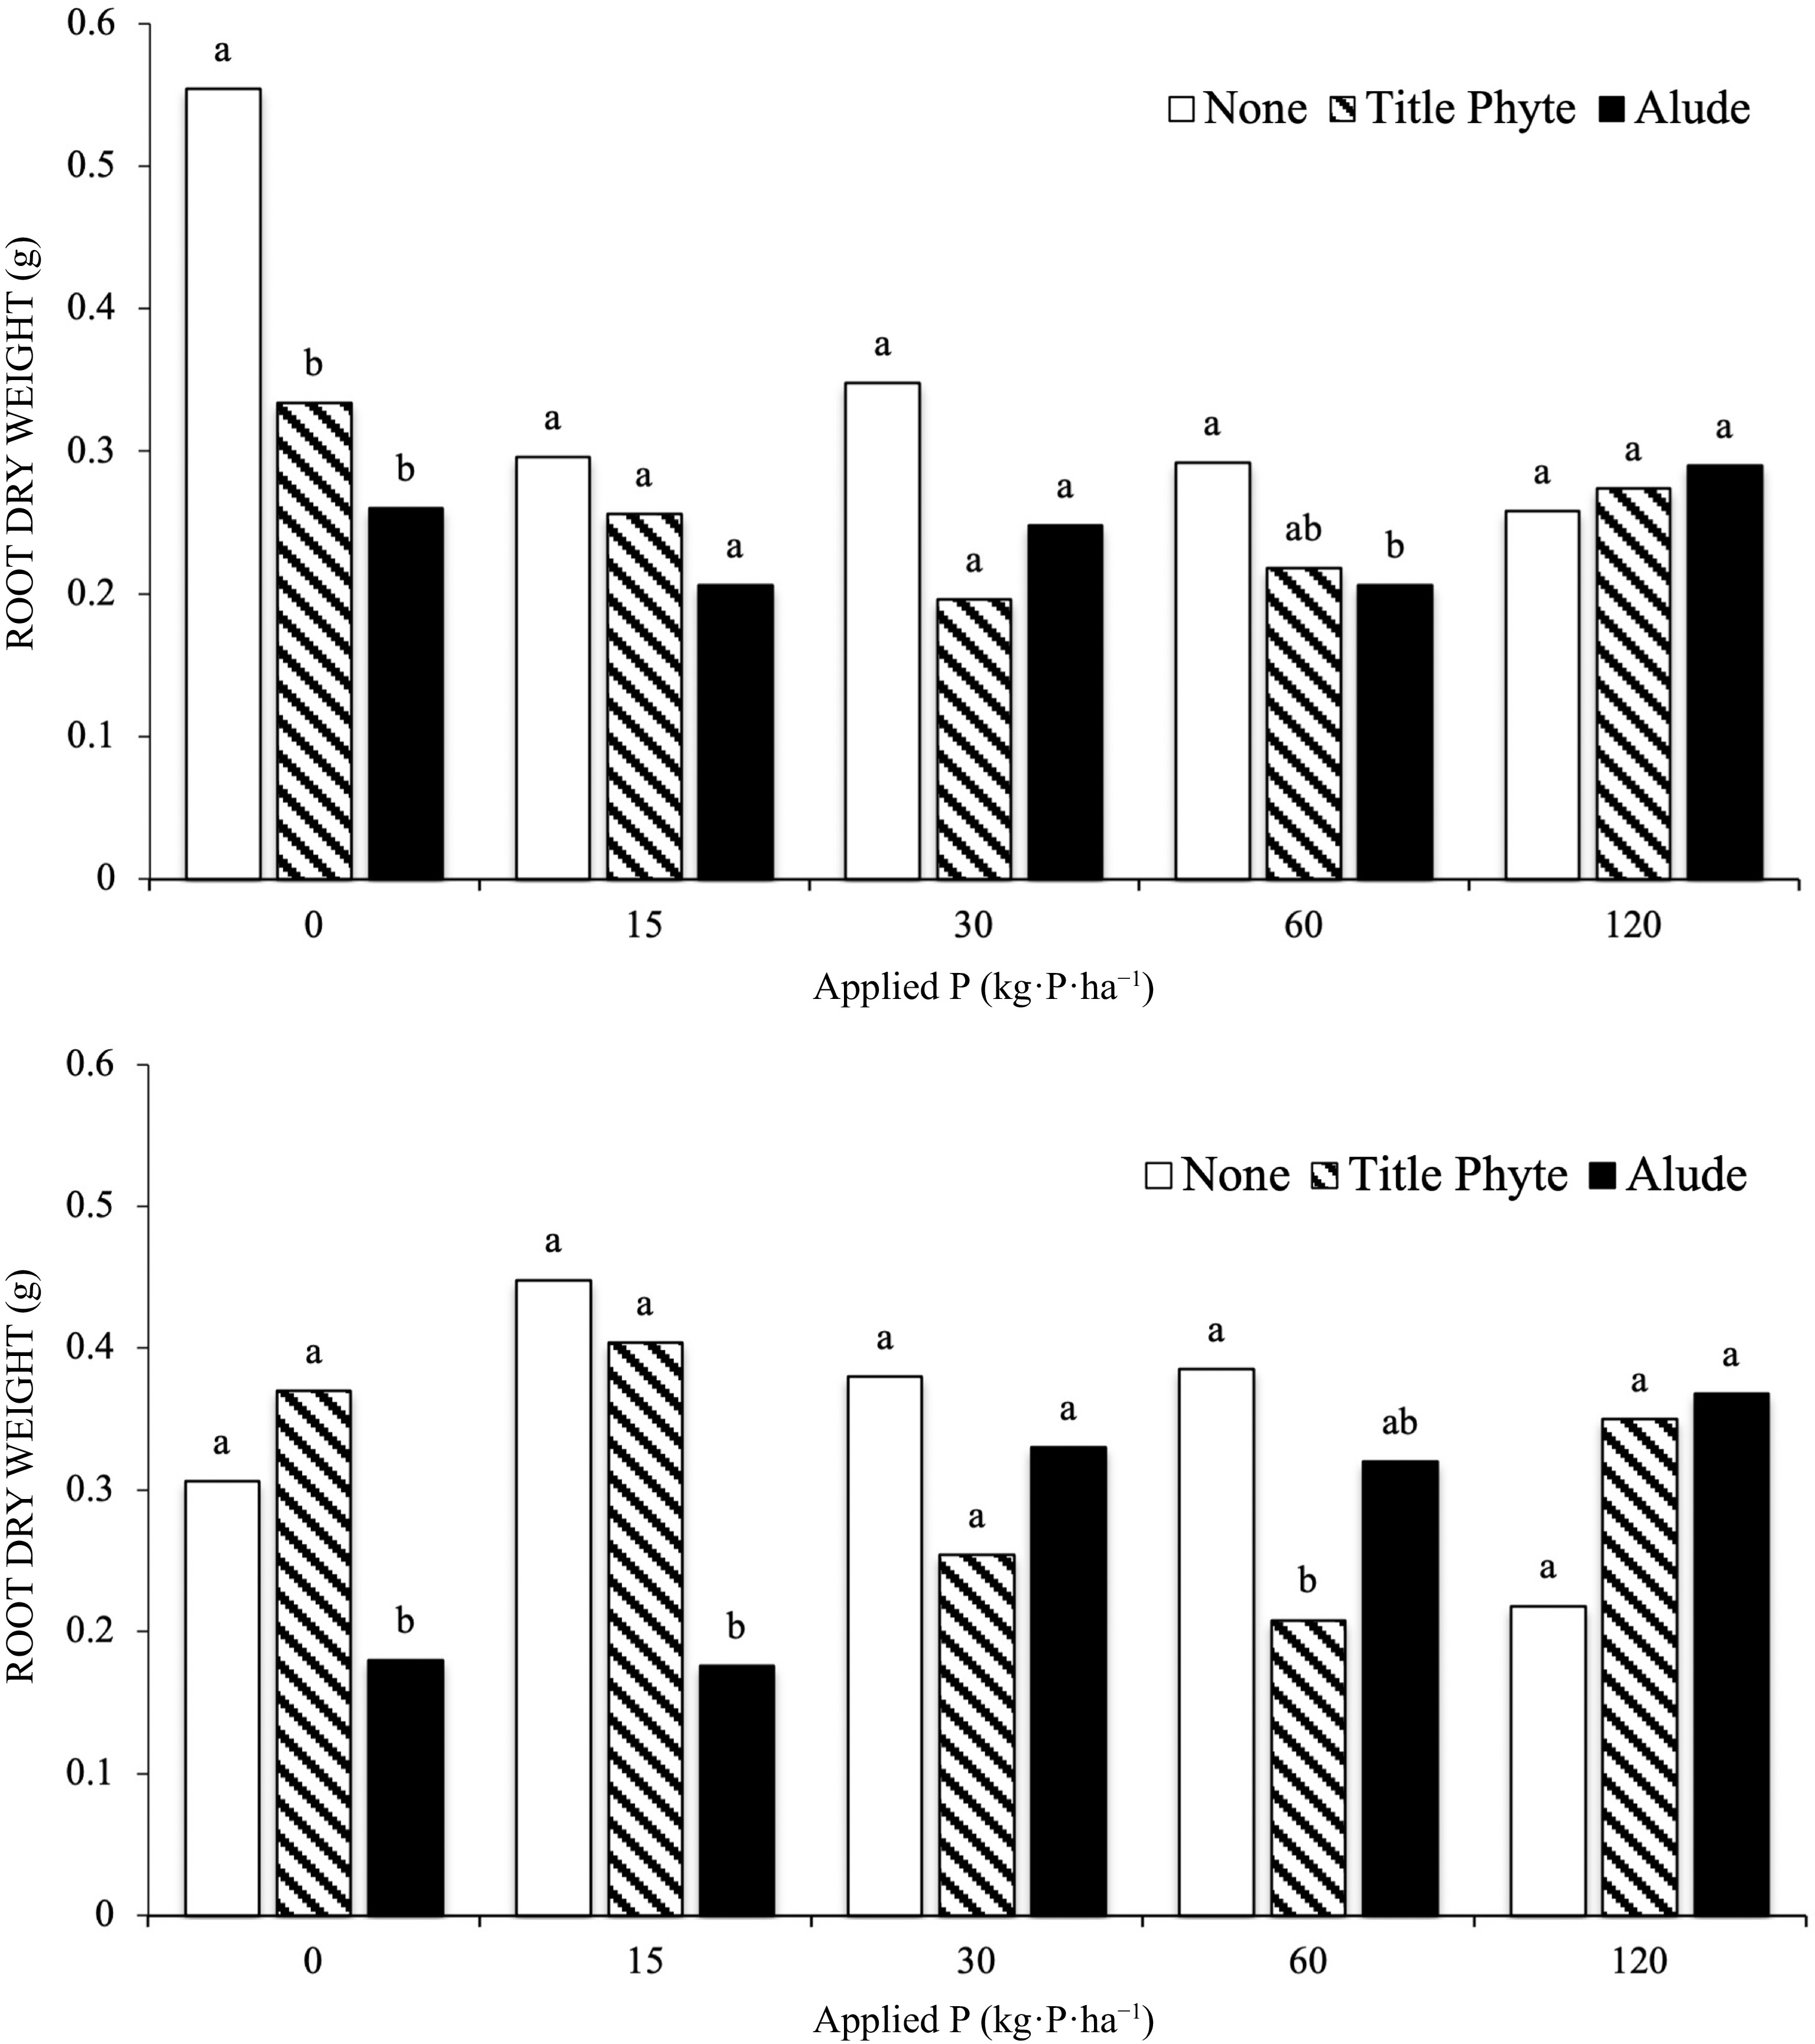
Figure 2.
Effect of P rate (provided through TSP) and phosphite products on creeping bentgrass root dry weight, Run 1 (top) and Run 2 (bottom). Treatments with the same letter above the bars are not significantly different (α = 0.05) within an experiment and each rate of P fertilization.
-
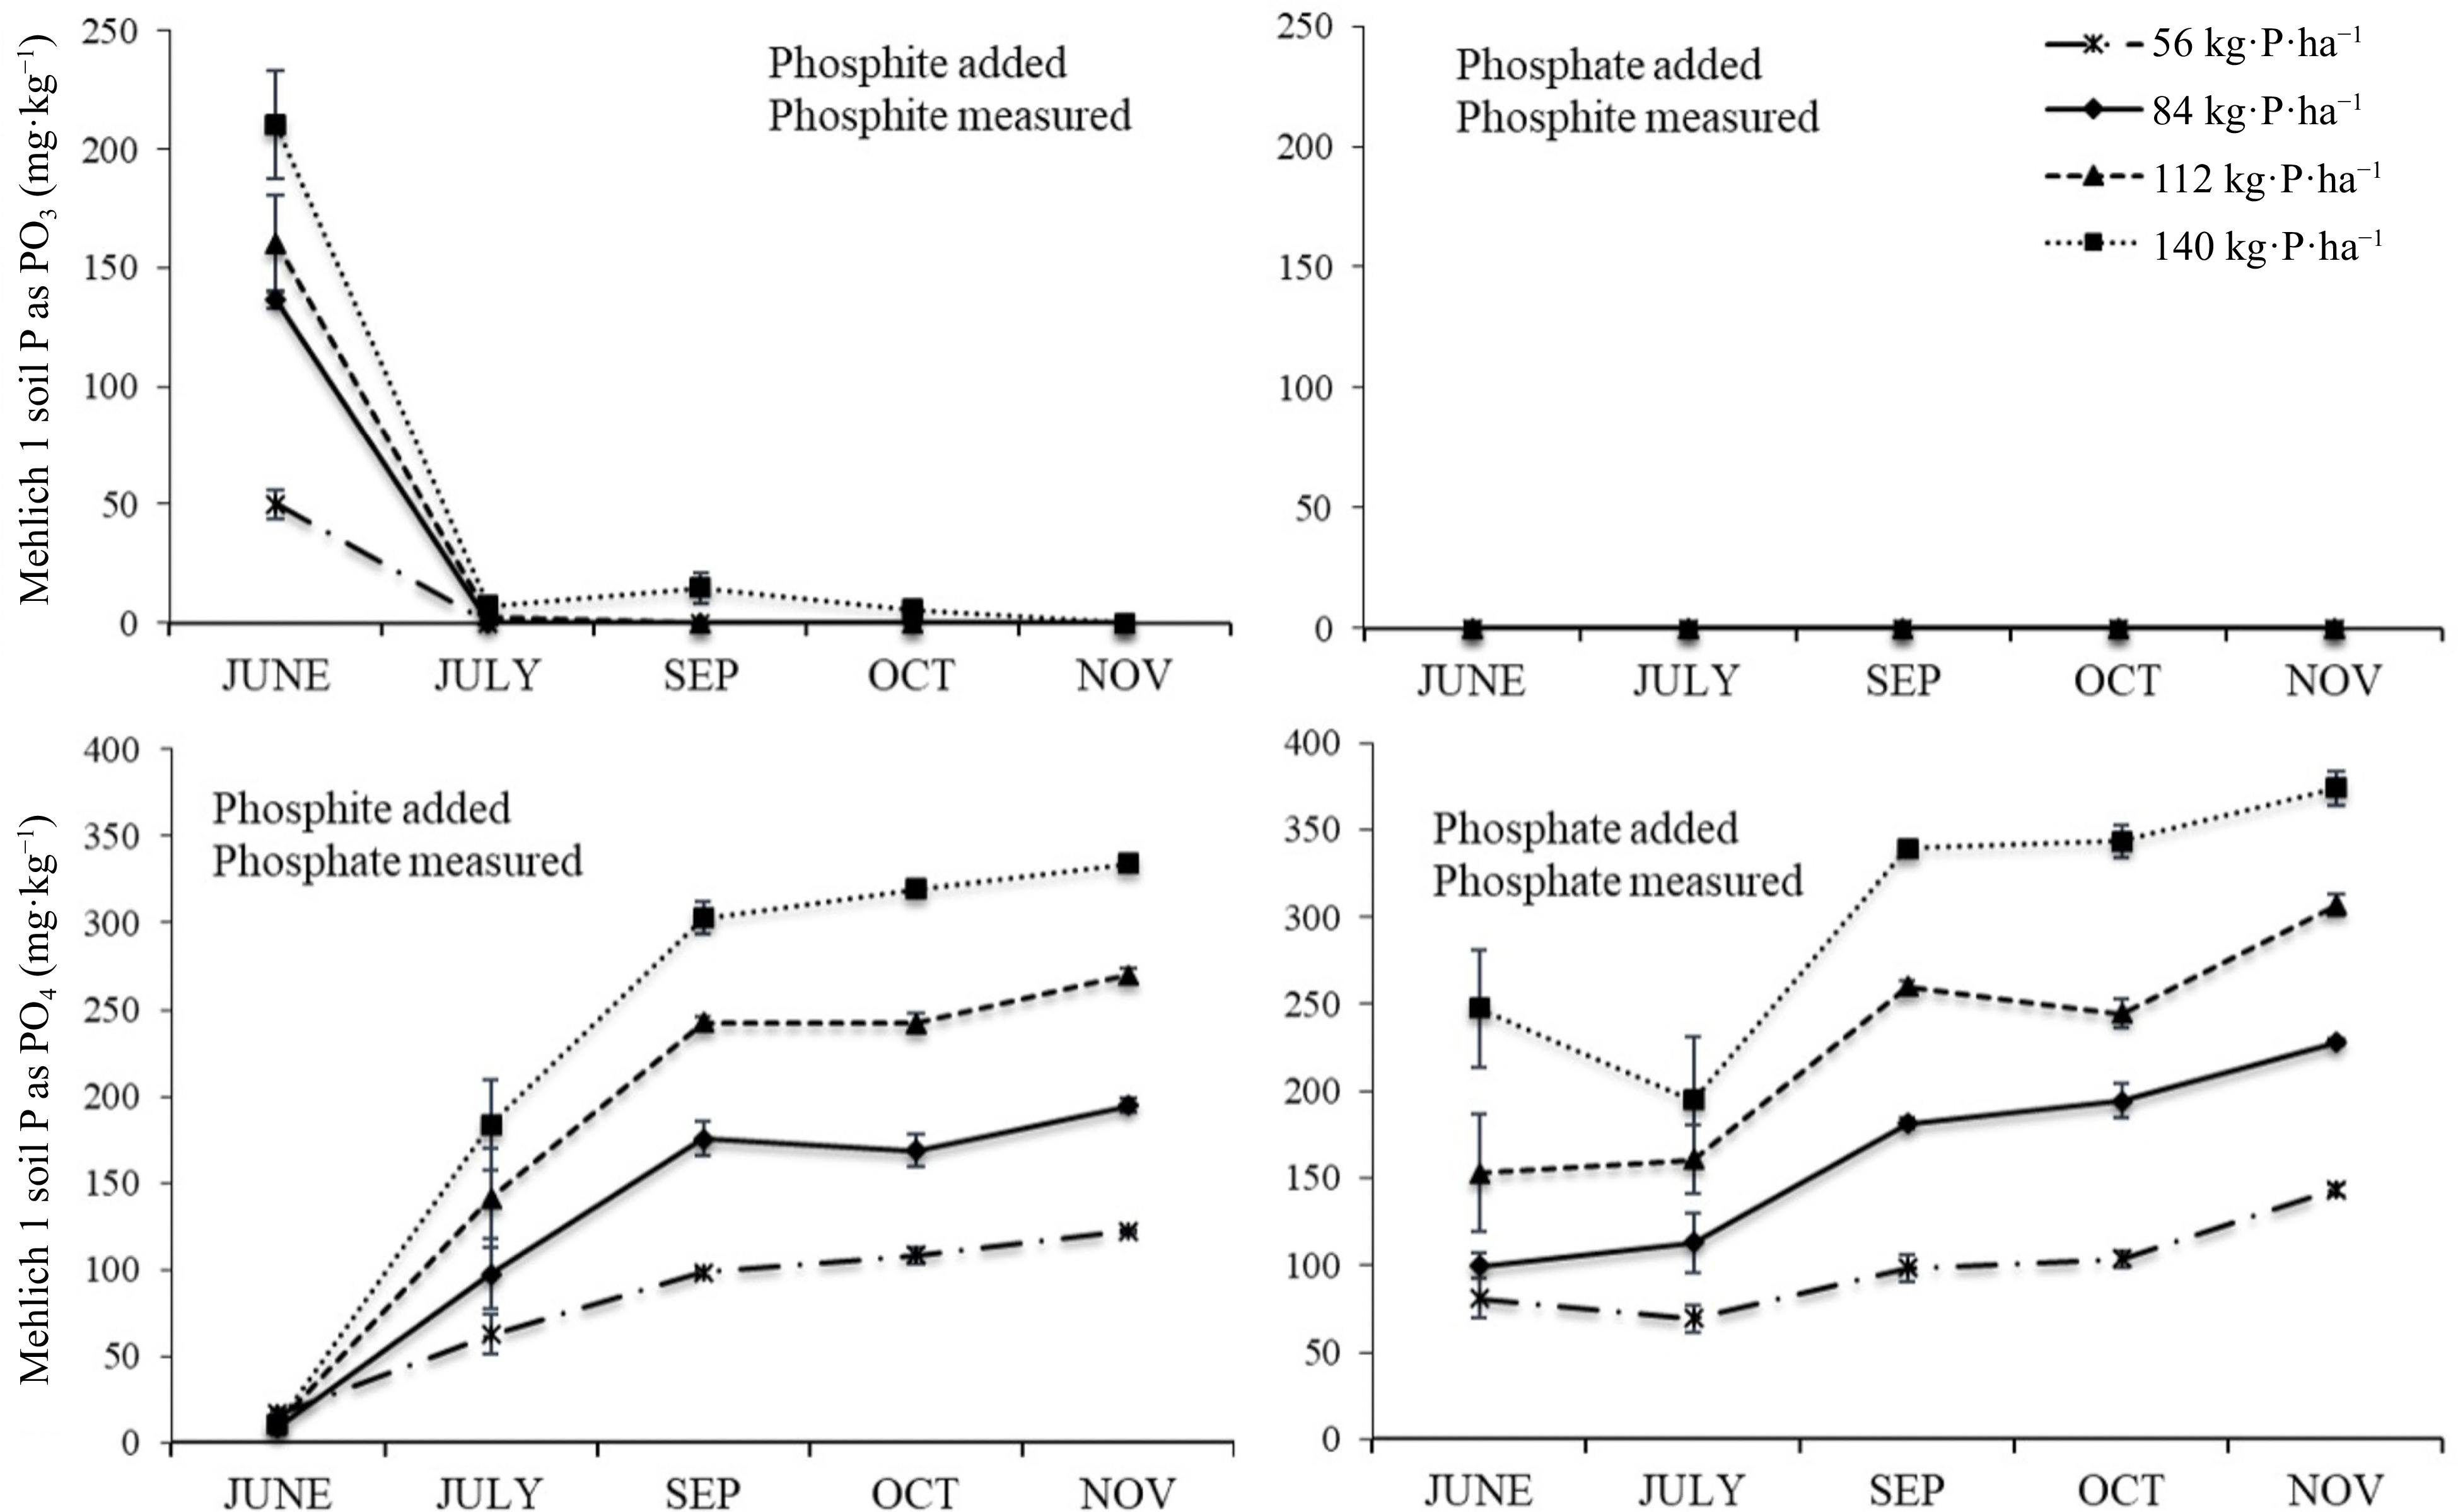
Figure 3.
Mehlich-1 extractable phosphite (top) and phosphate (bottom) as affected by the addition of phosphite supplied as TKO (left) or phosphate supplied as TSP (right) at four rates of P.
-
mg·kg−1 pH P K Ca Mg greenhouse-ryegras Run 1 0 2.5 28 2 7.4 Run 2 19 42 70.5 18.5 5.7 greenhouse- bentgrass Run 1 2 9 73.5 23.5 4.9 Run 2 2 10.5 110.5 31.5 4.7 laboratory incubation Marvyn
loamy sand2 36.5 464 35.5 6.5 †Mehlich 1 soil test extraction. Table 1.
Initial soil-test results† for all soil used in greenhouse and laboratory experiments.
-
Commercial trade name Manufacturer Formulated from Percent P Percent
from PO3Percent
from PO4%N-P-K Studies Used Turfite Headland Amenity Ltd. Cambourne, Cambridgeshire, UK Phosphoric acid
Ammonium phosphate
Ammonium citrate8.9 75.9 24.1 8-9-0† ryegrass TKO Growth Products. White Plains, NY 10603, USA Phosphorous acid
Potassium hydroxide29.6 100 0 0-0-22† ryegrass soil Title Phyte Harrell's. Lakeland, FL 33802, USA Mono- and Di- Potassium phosphite 15.0§ 100 0 0-0-25† ryegrass bentgrass soil Alude Cleary Chemical, Dayton, NJ¶ 08810, USA Mono- and Di- Potassium Salts of Phosphorous Acid 11.0± 100 0 n/a bentgrass Triple super phosphate Piedmont Fertilizer Company. Opelika, AL 36801, USA Triple superphosphate 20.7 0 100 0-20-0 ryegrass soil † Guaranteed analysis does not include P contribution from phosphite. ¶ Manufacturer and formulation specifications for this product at the time of this work (newer product currently with NuFarm). § Calculated on 571 g·H3PO3·L−1, 1,455 g·L−1. ± Calculated on 401 g·H3PO3·L−1, specific gravity of 1.35. Table 2.
Nutrient/active ingredient content of phosphite/phosphate, phosphite and phosphate products for greenhouse perennial ryegrass, bentgrass, and laboratory soil incubation studies.
-
Source ANOVA Ryegrass study Top growth Dry weight Tissue P content P uptake Run1 Run2 Run1 Run 2 Run1 Run2 Harvest (H) − − * * NS ** P rate (R) NS ** * ** NS ** P source (S) NS * * ** * ** R × P NS ** NS NS NS ** H × R − − NS NS NS * H × S − − * * NS * H × R × P − − NS NS NS * Source Bentgrass study Tissue dry weight Tissue P content P uptake Root dry weight Run1 Run2 Run1 Run2 Run1 Run2 Run1 Run2 P rate (R) NS NS ** ** * *** NS NS P source (S) *** *** *** *** *** *** ** * R × P NS NS ** ** ** ** * *** *Significant at P = 0.05; ** significant at P = 0.01; *** significant at P = 0.001; NS = nonsignificant at P = 0.05. Table 3.
ANOVA table for perennial ryegrass and creeping bentgrass studies.
-
P Rate
(kg·ha−1)Dry weight of topgrowth (g) P source Turfite TKO TSP 0 0.28 0.28 0.28 13 0.37 ab†† 0.41 a 0.32 b 26 0.39 a 0.43 a 0.40 a 40 0.48 a 0.36 b 0.41 ab 52 0.43 a 0.39 a 0.36 a Regression Q† NS Q † From linear regression (each column), Q = significant quadratic response within each P source; NS – no linear or quadratic response. †† From mean separation, means followed by the same letter are not significantly different from each other (alpha = 0.05), between P sources (each row), within each P rate. Table 4.
Effect of P rate and P source (TSP (phosphate), TKO (phosphite), Turfite (phosphate/phosphite)) on the dry weight of perennial ryegrass topgrowth. Run 2 of a greenhouse experiment.
-
P source P rate
(kg·ha−1)Tissue P uptake (mg−1·pot−1) Turfite TKO TSP Harvest 1, Run 2 0 0.03 0.03 0.03 13 0.12 0.14 0.09 26 0.18 0.17 0.17 40 0.15 0.10 0.19 52 0.15 0.12 0.26 Regression Q† NS L Harvest 2, Run 2 0 0.02 0.02 0.02 13 0.11 a 0.08 a 0.08 a 26 0.17 a 0.15 a 0.13 a 40 0.30 a 0.17 b 0.15 b 52 0.32 a 0.23 b 0.17 c Regression L L L † From regression, L= significant linear, or Q = quadratic response within each P source and Harvest/Run, NS = not significant. Table 5.
Effect of P rate and P source (TSP (phosphate), TKO (phosphite), Turfite (phosphate/phosphite)) on P uptake by perennial ryegrass as affected by P source, two harvests in Run 2 of the experiment.
Figures
(3)
Tables
(5)