-
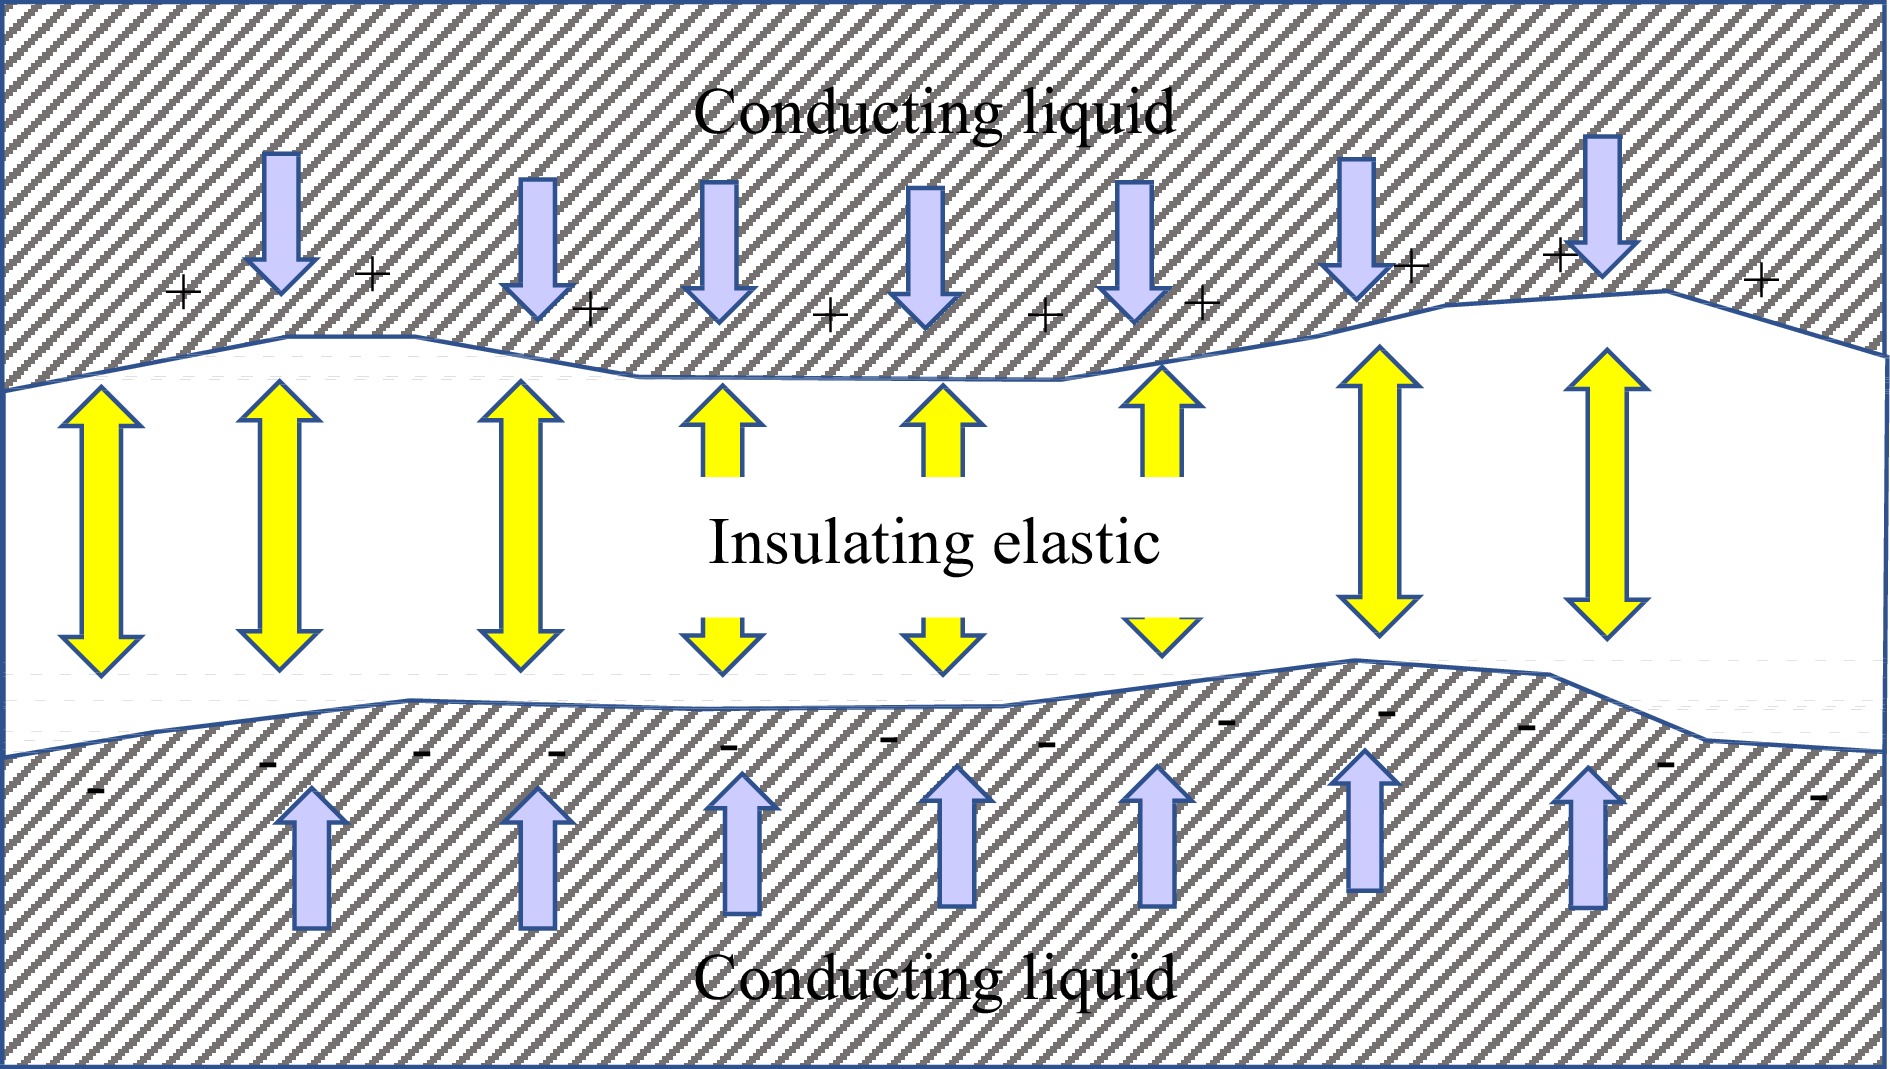
Figure 1.
Model for membrane, modeled as an insulating elastic between conducting liquid layers, after Crowley[9]. Forces of electrical compression in blue arrows; elastic forces in yellow arrows.
-
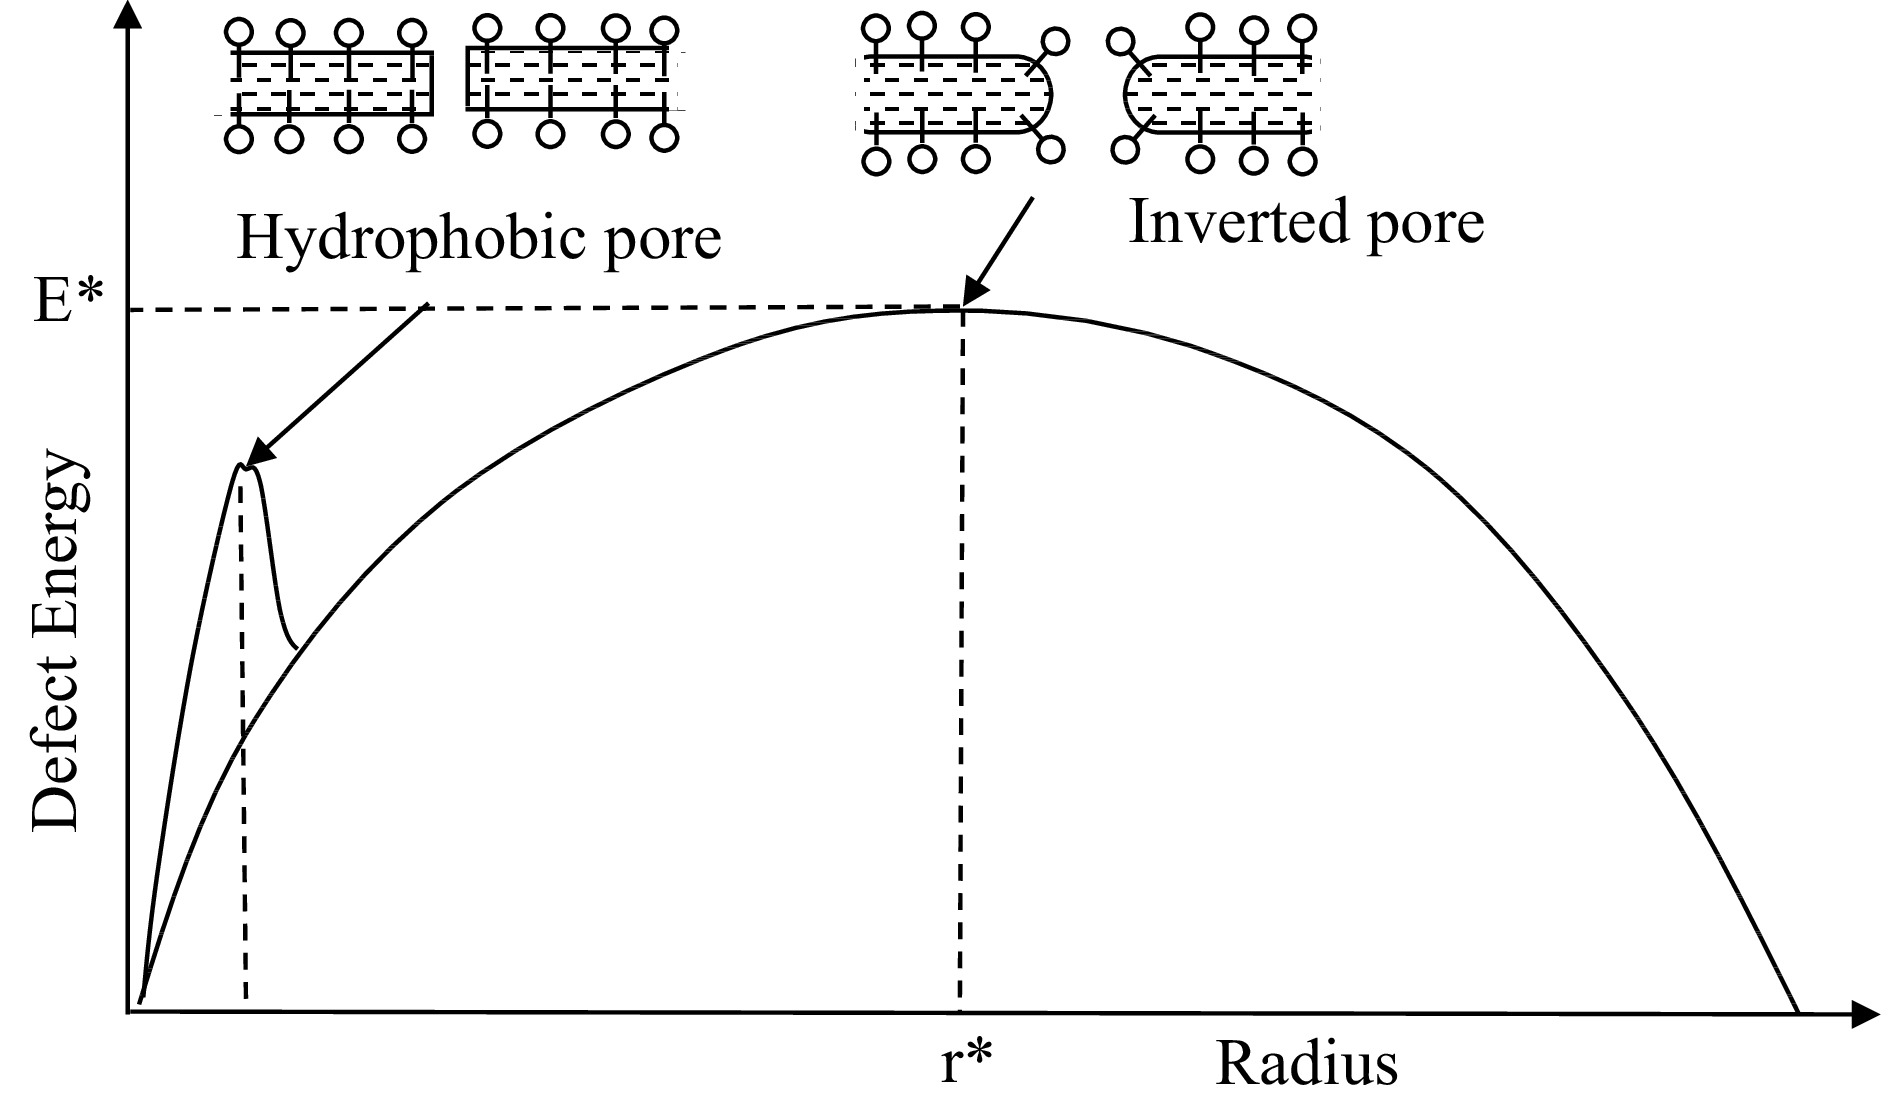
Figure 2.
Dependence of defect energy on pore radius (after Abidor et al.[10]). The dotted-dashed peak at left shows the energy barrier required for maintenance of hydrophobic pores. Pores smaller than this energy barrier are closed, those to the right flucutate between two energy barriers.
-
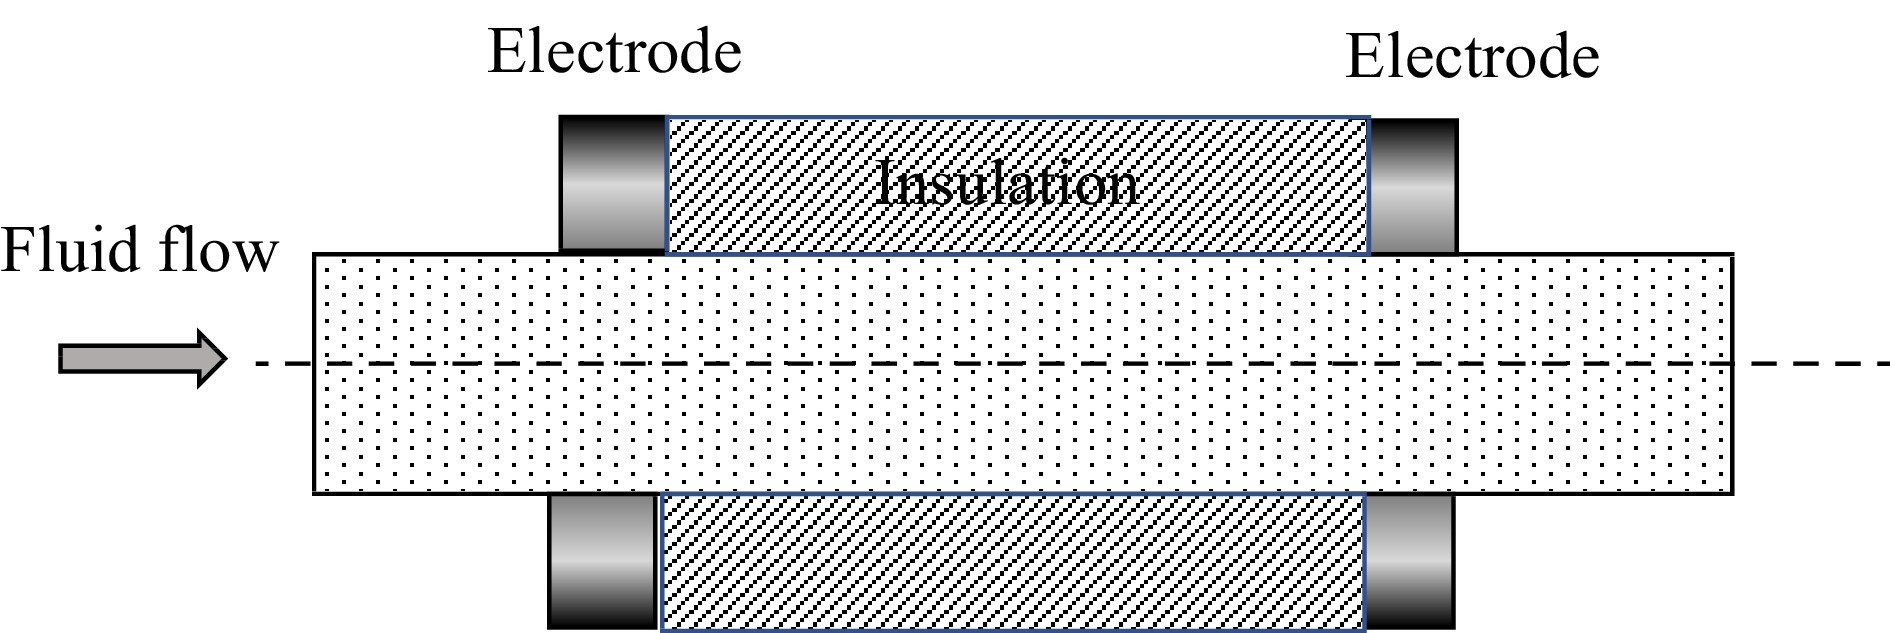
Figure 3.
Schematic diagram of a section of a co-field (also called collinear) PEF treatment chamber. The electric field here is in line with the flow, designed to restrict current through liquid foods of high electrical conductivity. A PEF unit may consist of many similar treatment chambers in series. The geometry may also vary, to restrict hot zones in the electric field, while maintaining the same fundamental concept.
-
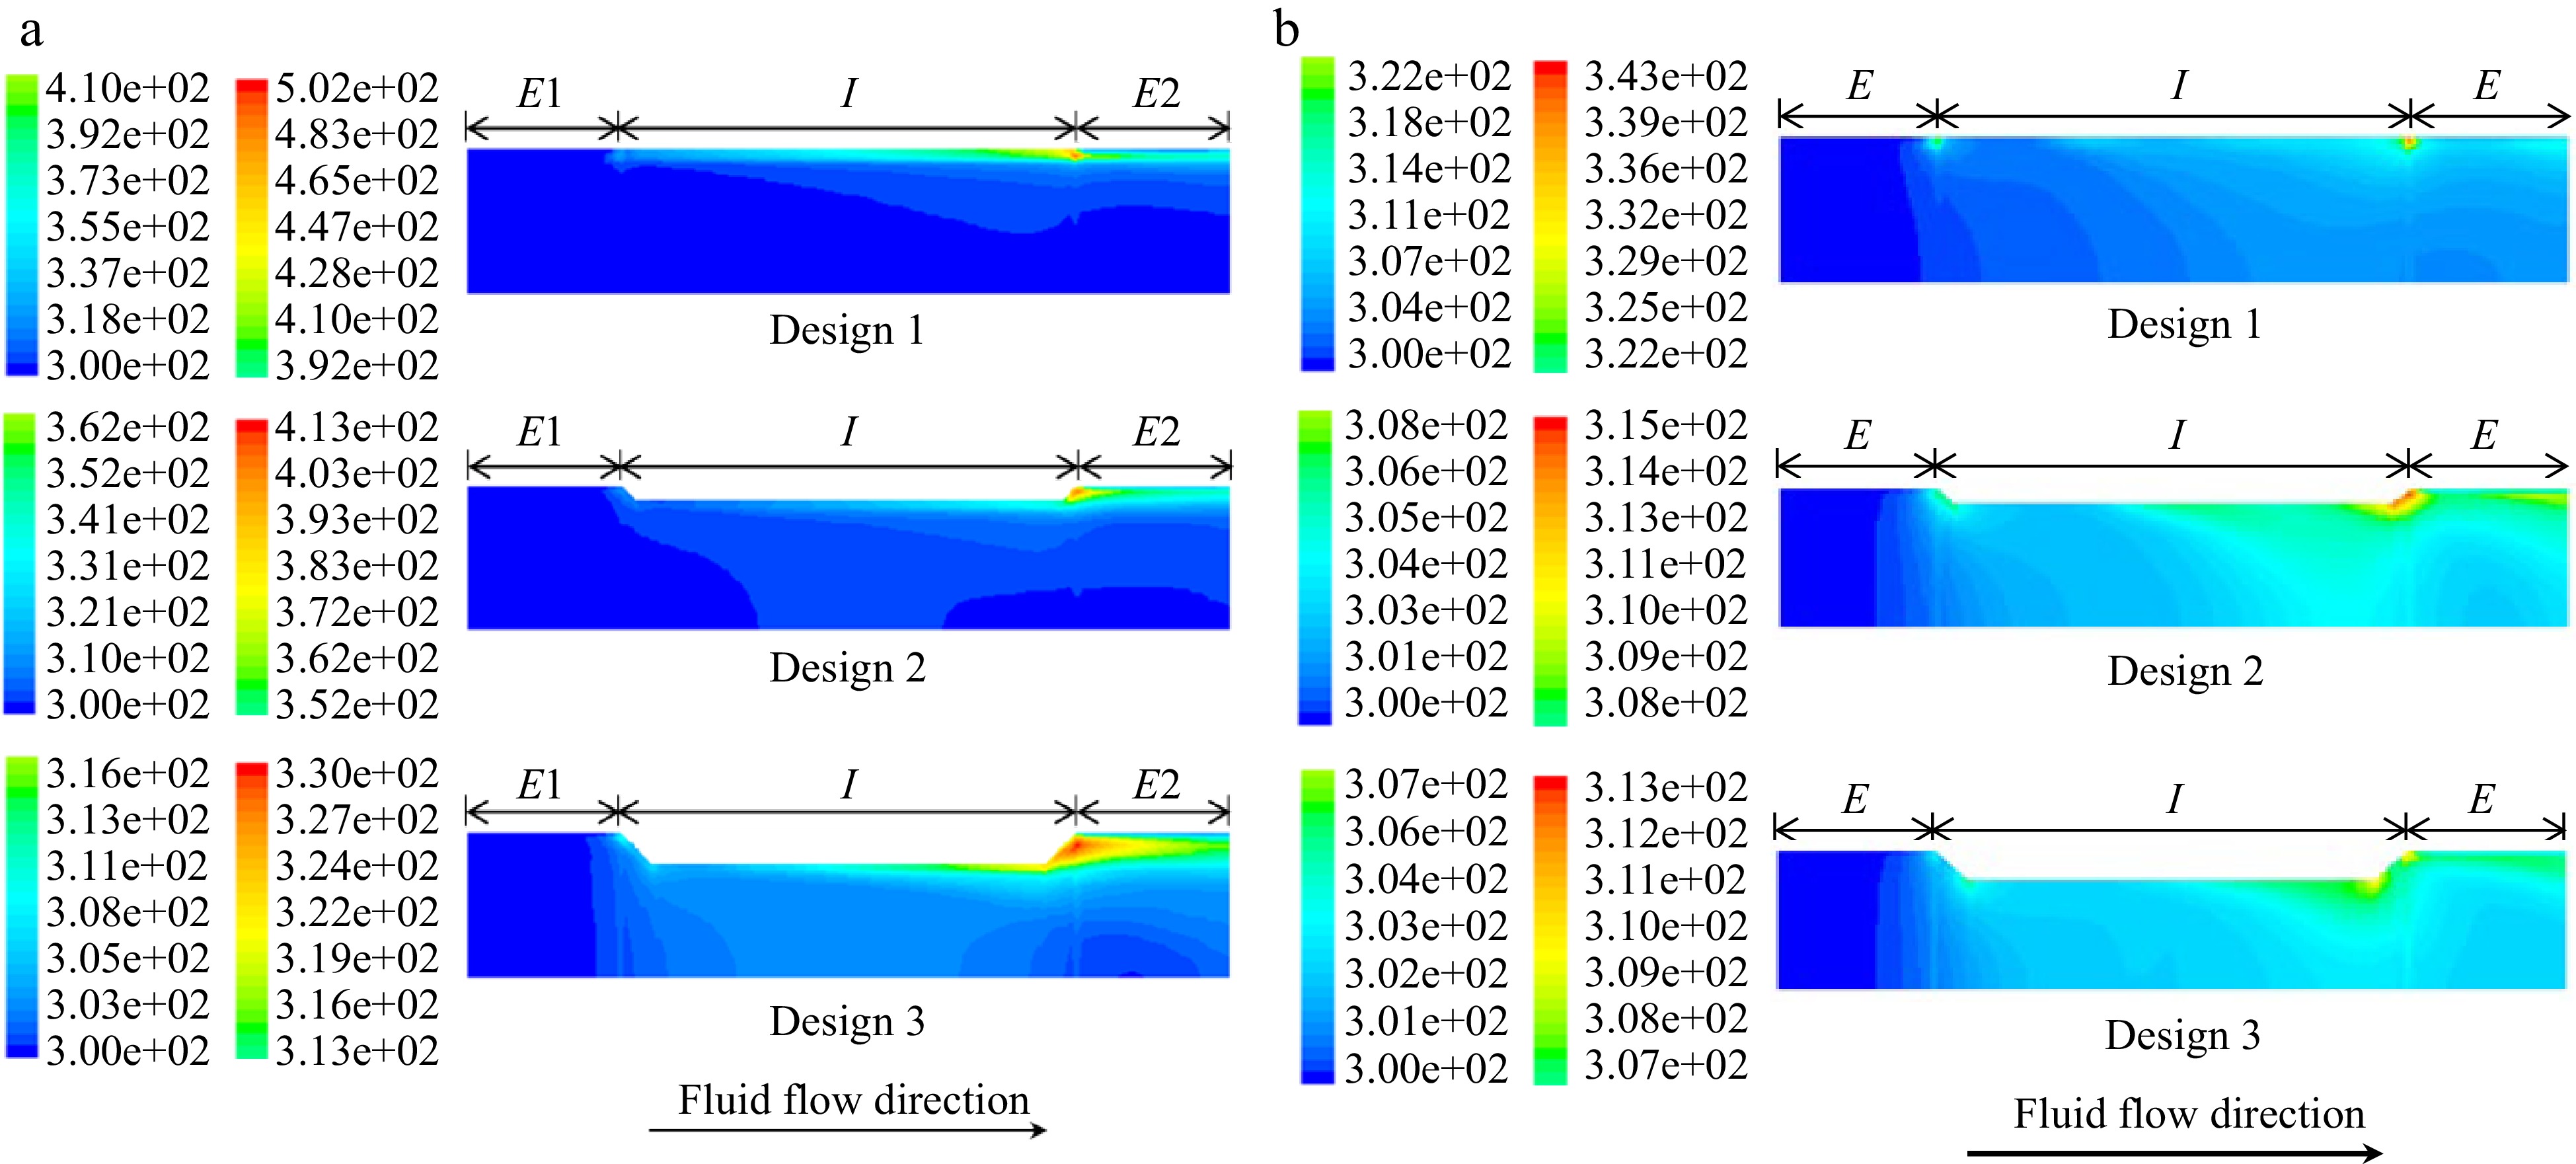
Figure 4.
(a) Temperature profiles in a co-field (aka collinear) PEF treatment chamber at the end of a 1.4 μs pulse of 60 kV under (a) laminar flow, and (b) turbulent flow. From Salengke et al.[38].
-
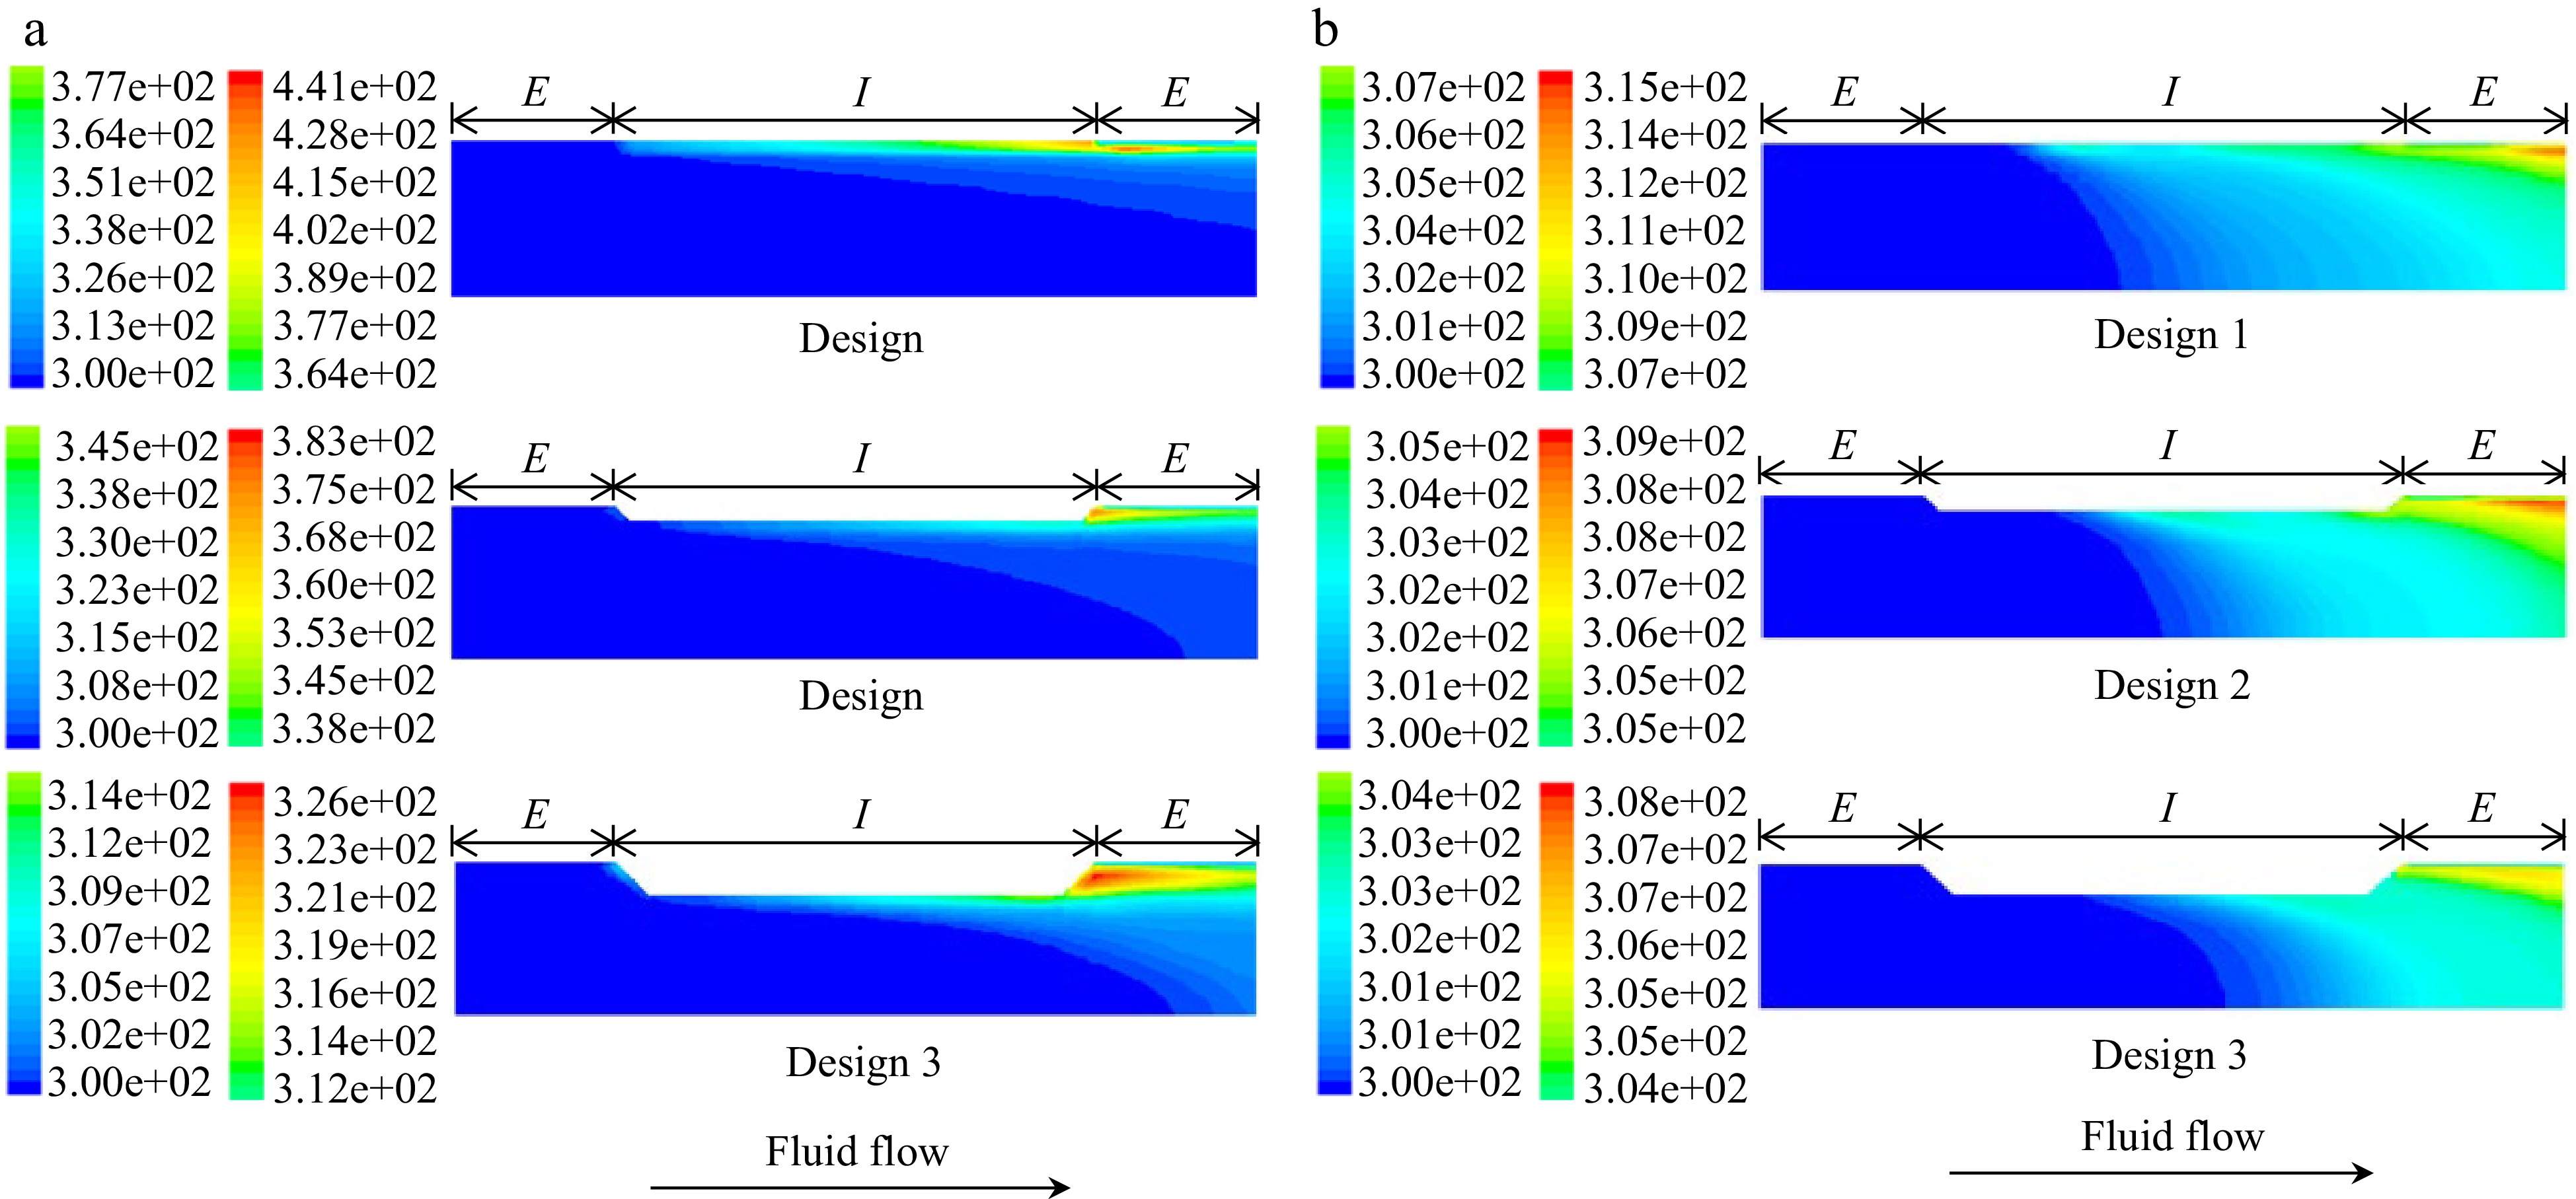
Figure 5.
(a) Temperature profiles in a co-field (aka collinear) PEF treatment chamber at the end of a 2 ms interpulse duration following a 1.4 μs pulse of 60 kV under (a) laminar flow, and (b) turbulent flow. From Salengke et al.[38].
-
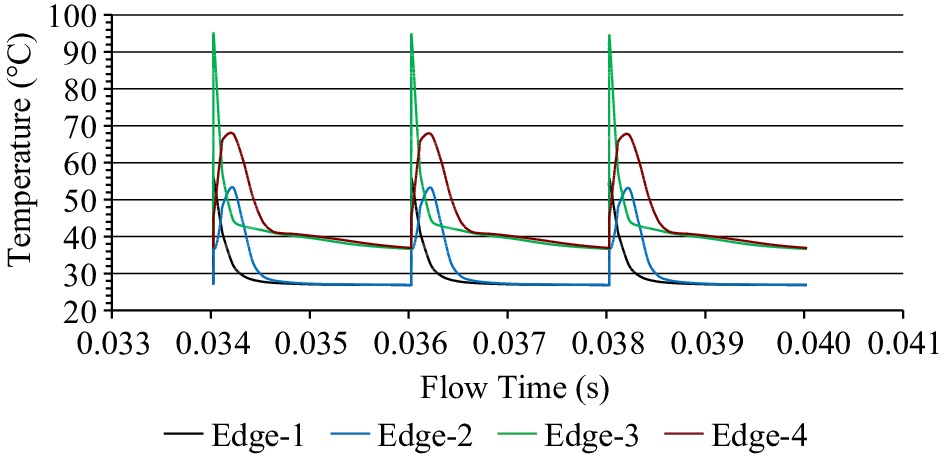
Figure 6.
Temperature histories at various electrode edges of a treatment chamber, as simulated by Salengke et al.[38] but not previously published. Edge 1 represents the most upstream location of the upstream edge, Edge 2 is the downstream location of the upstream edge, Edge 3 is the upstream location of the downstream edge, and Edge 4 is the downstream location of the downstream edge.
-
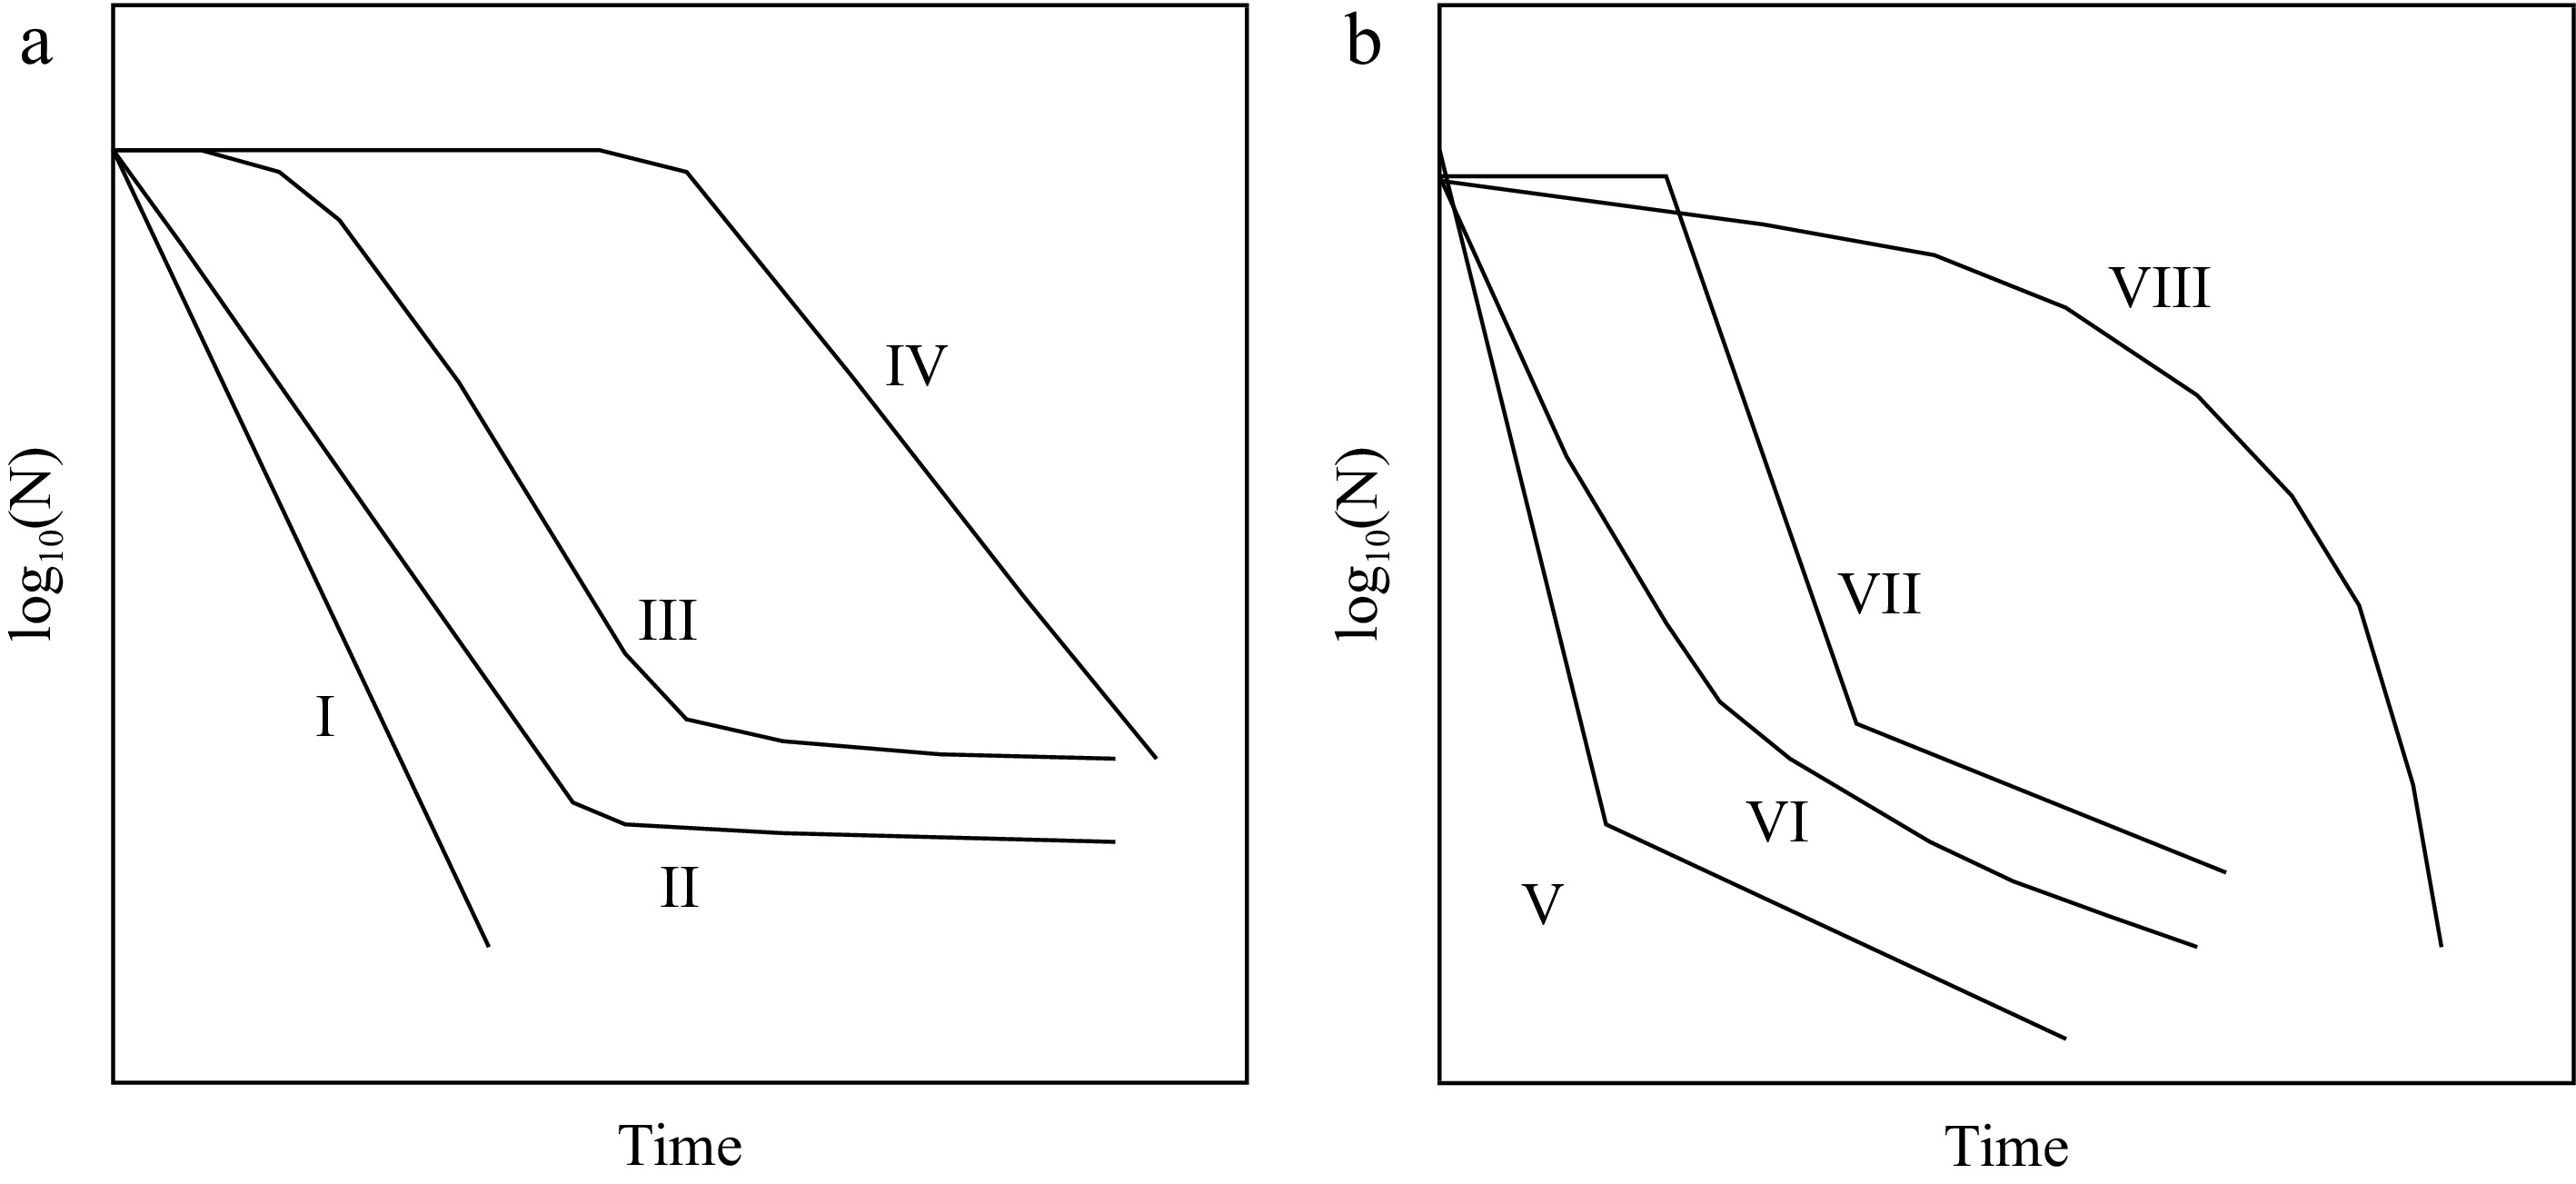
Figure 7.
Commonly observed survivor curves (after Geeraerd et al.[68]). (a) I - linear; II - linear with tailing; III – sigmoidal; IV – linear with a preceding shoulder; (b) V – biphasic; VI – concave; VII – biphasic with shoulder; VIII – convex.
Figures
(7)
Tables
(0)