-
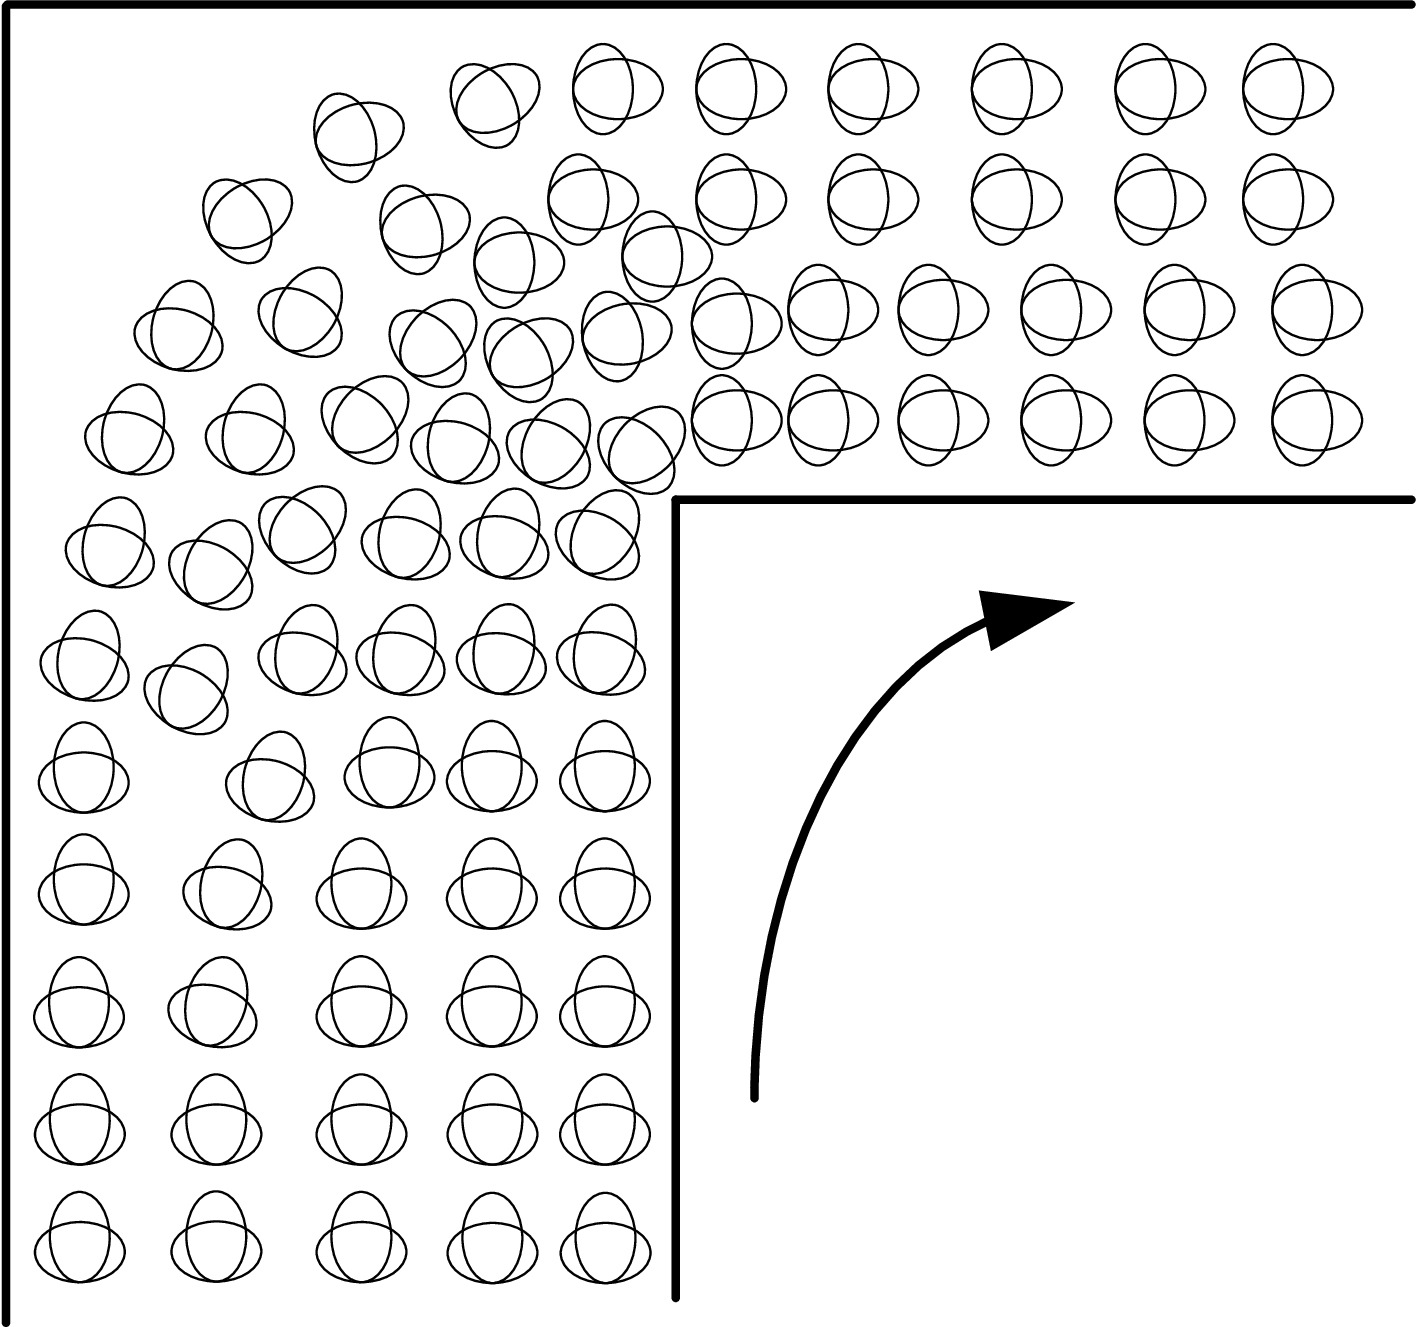
Figure 1.
Discrepancy of passenger density in a corner.
-
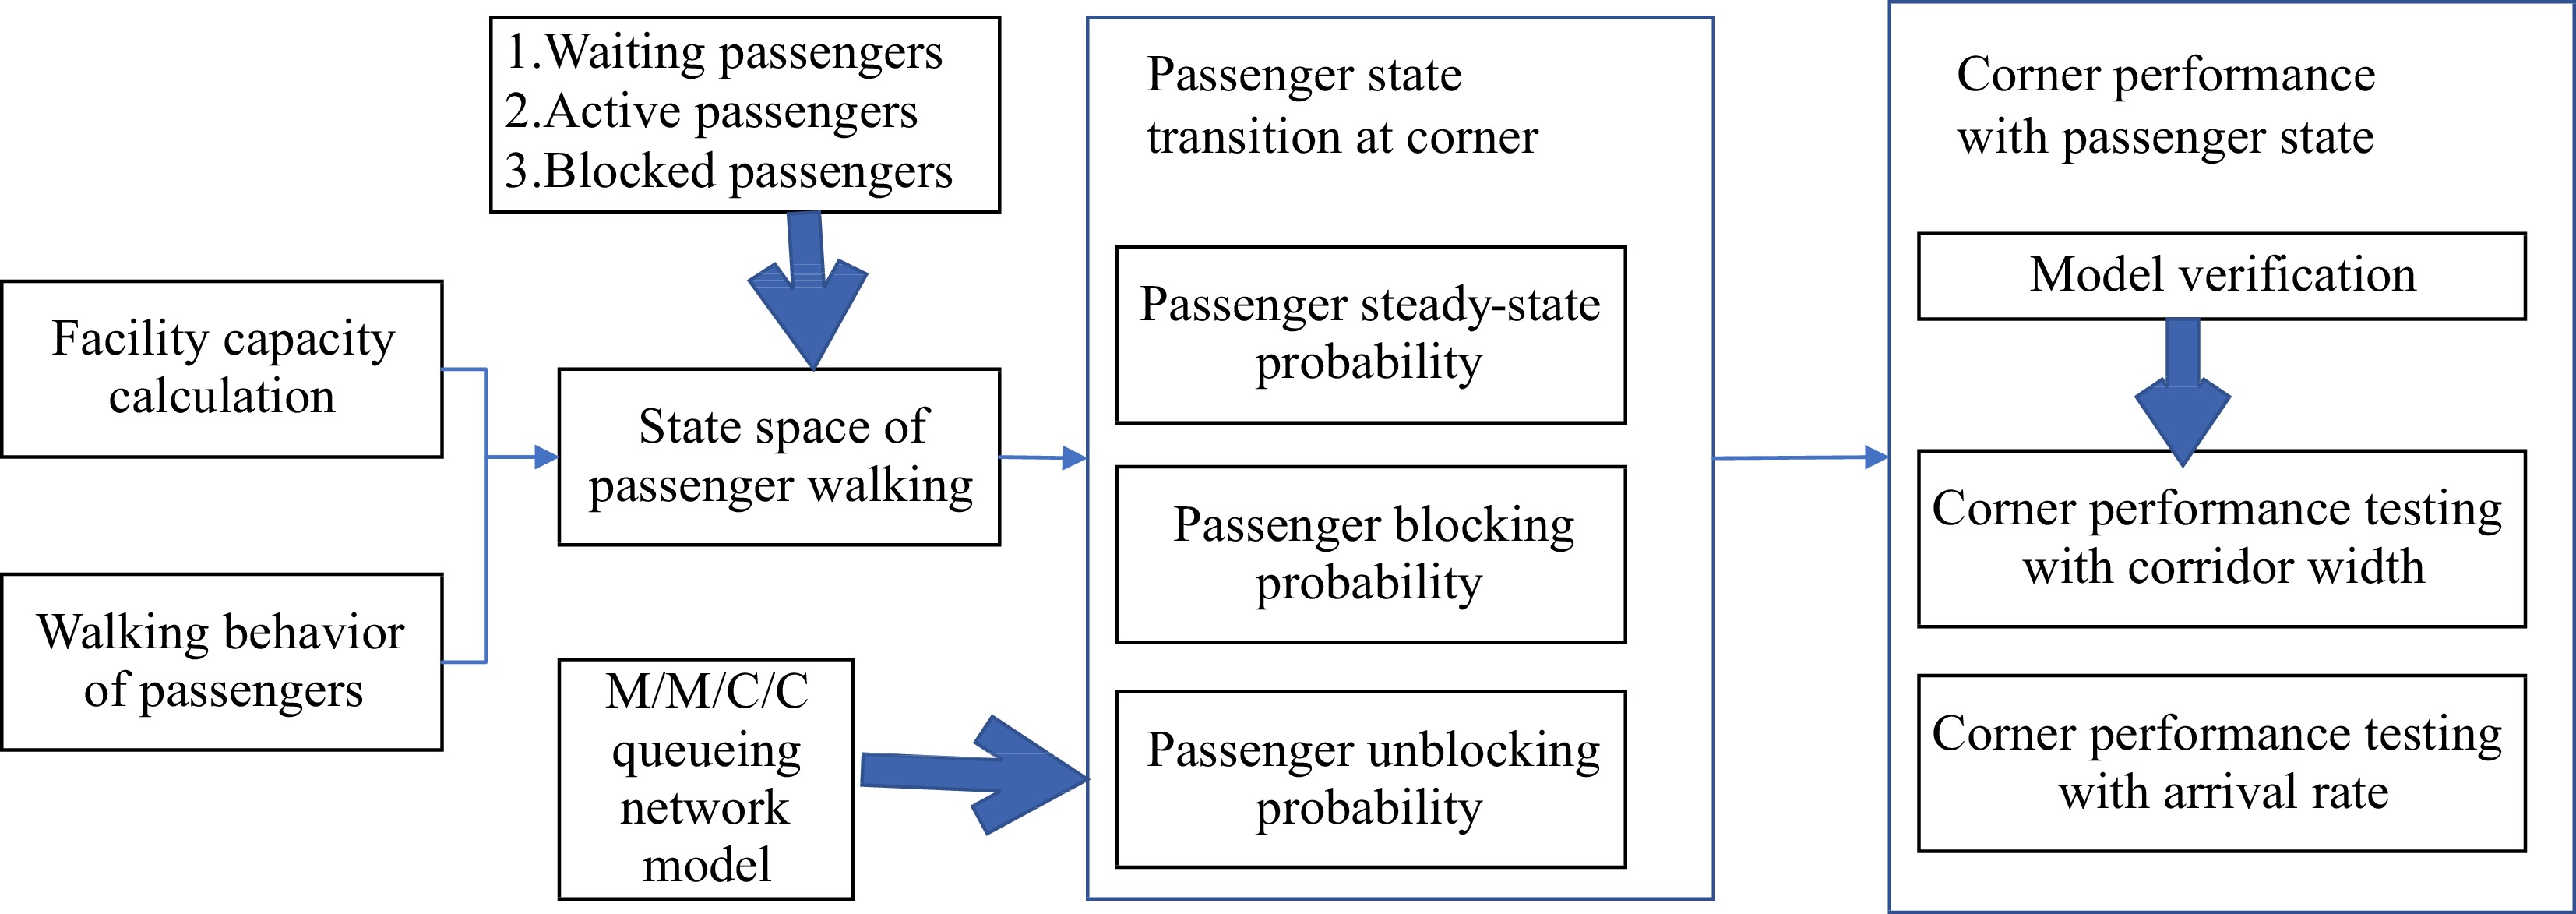
Figure 2.
Framework of passenger gathering-scattering analysis.
-
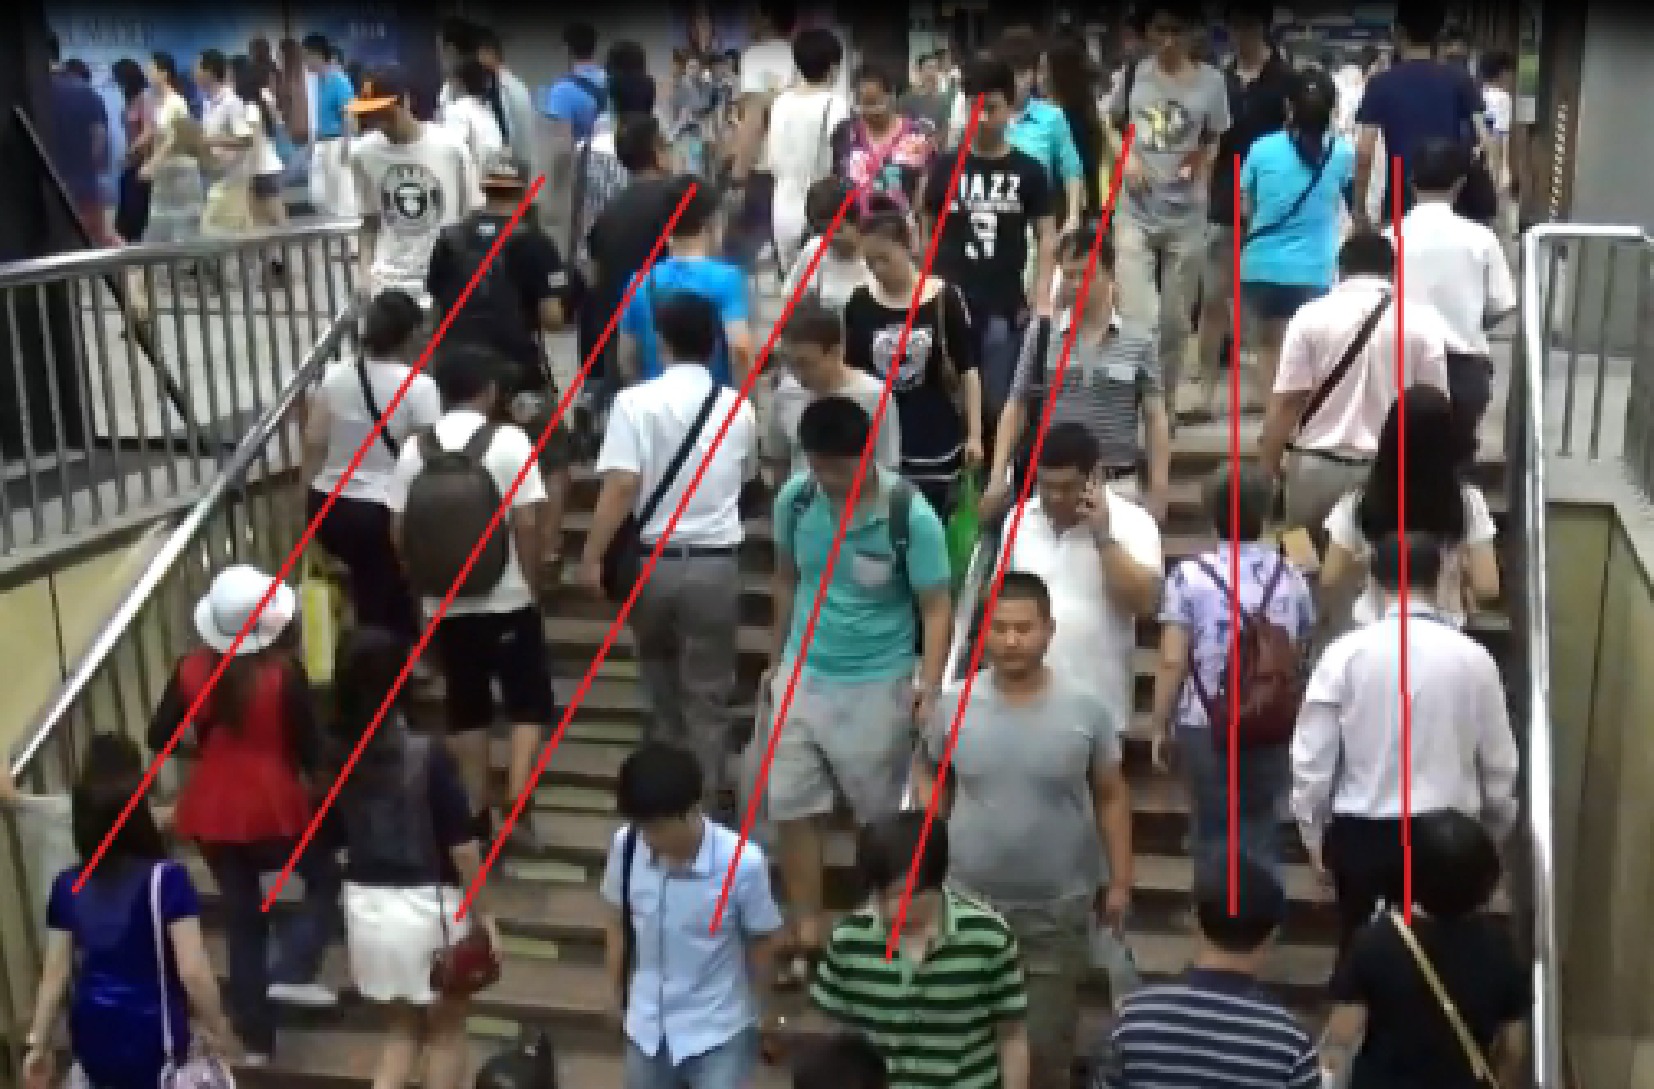
Figure 3.
Self-organizing passenger line method in the facility.
-

Figure 4.
Schematic diagrams of occupant states at corners.
-

Figure 5.
Virtual queue when the target queue is blocked.
-
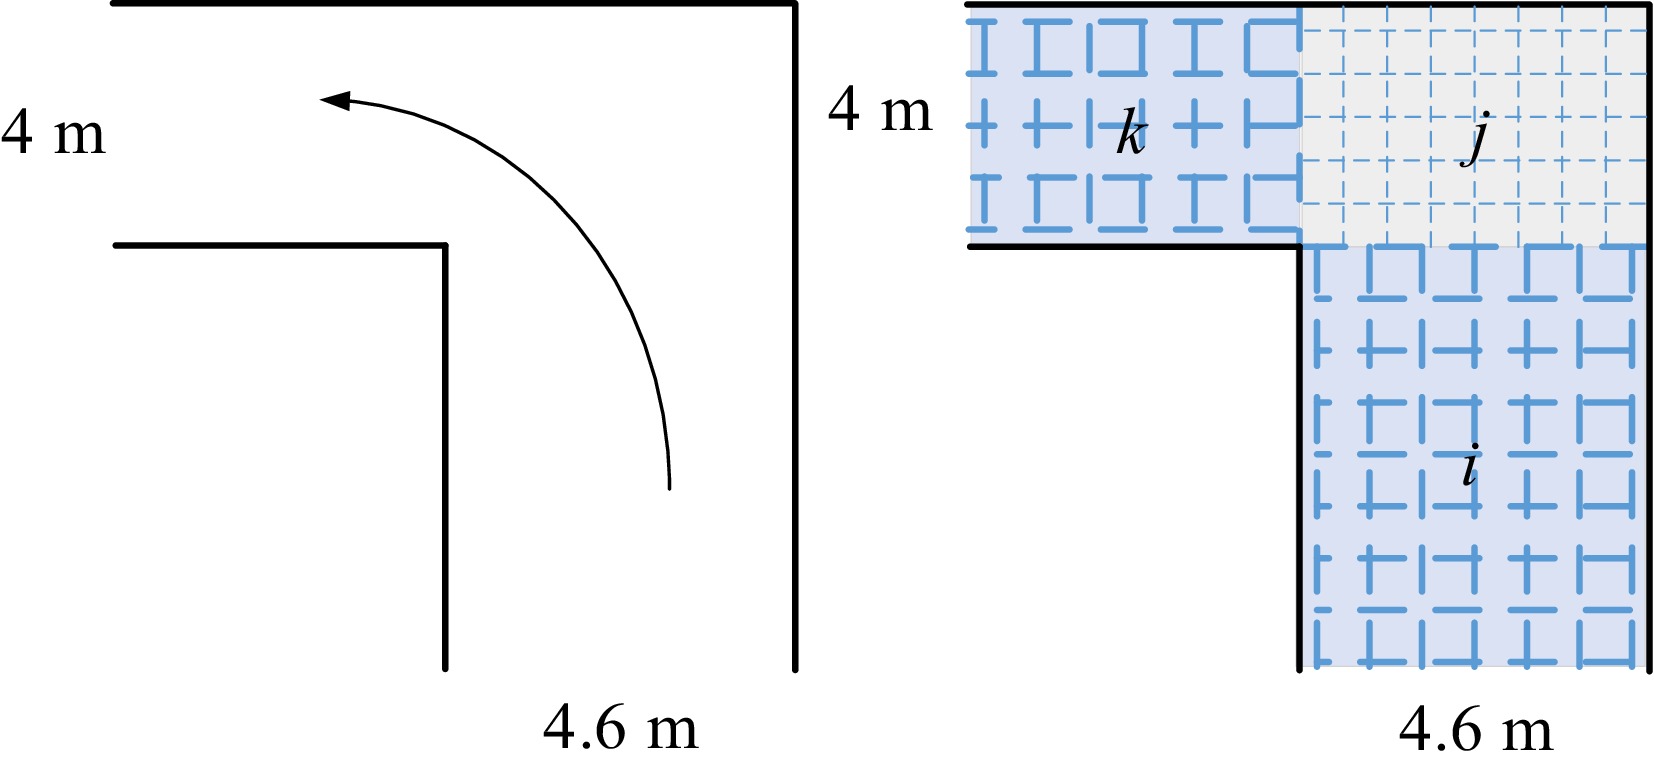
Figure 6.
The topology of the corner in H station.
-

Figure 7.
Model network structure of a corner between walking facilities.
-
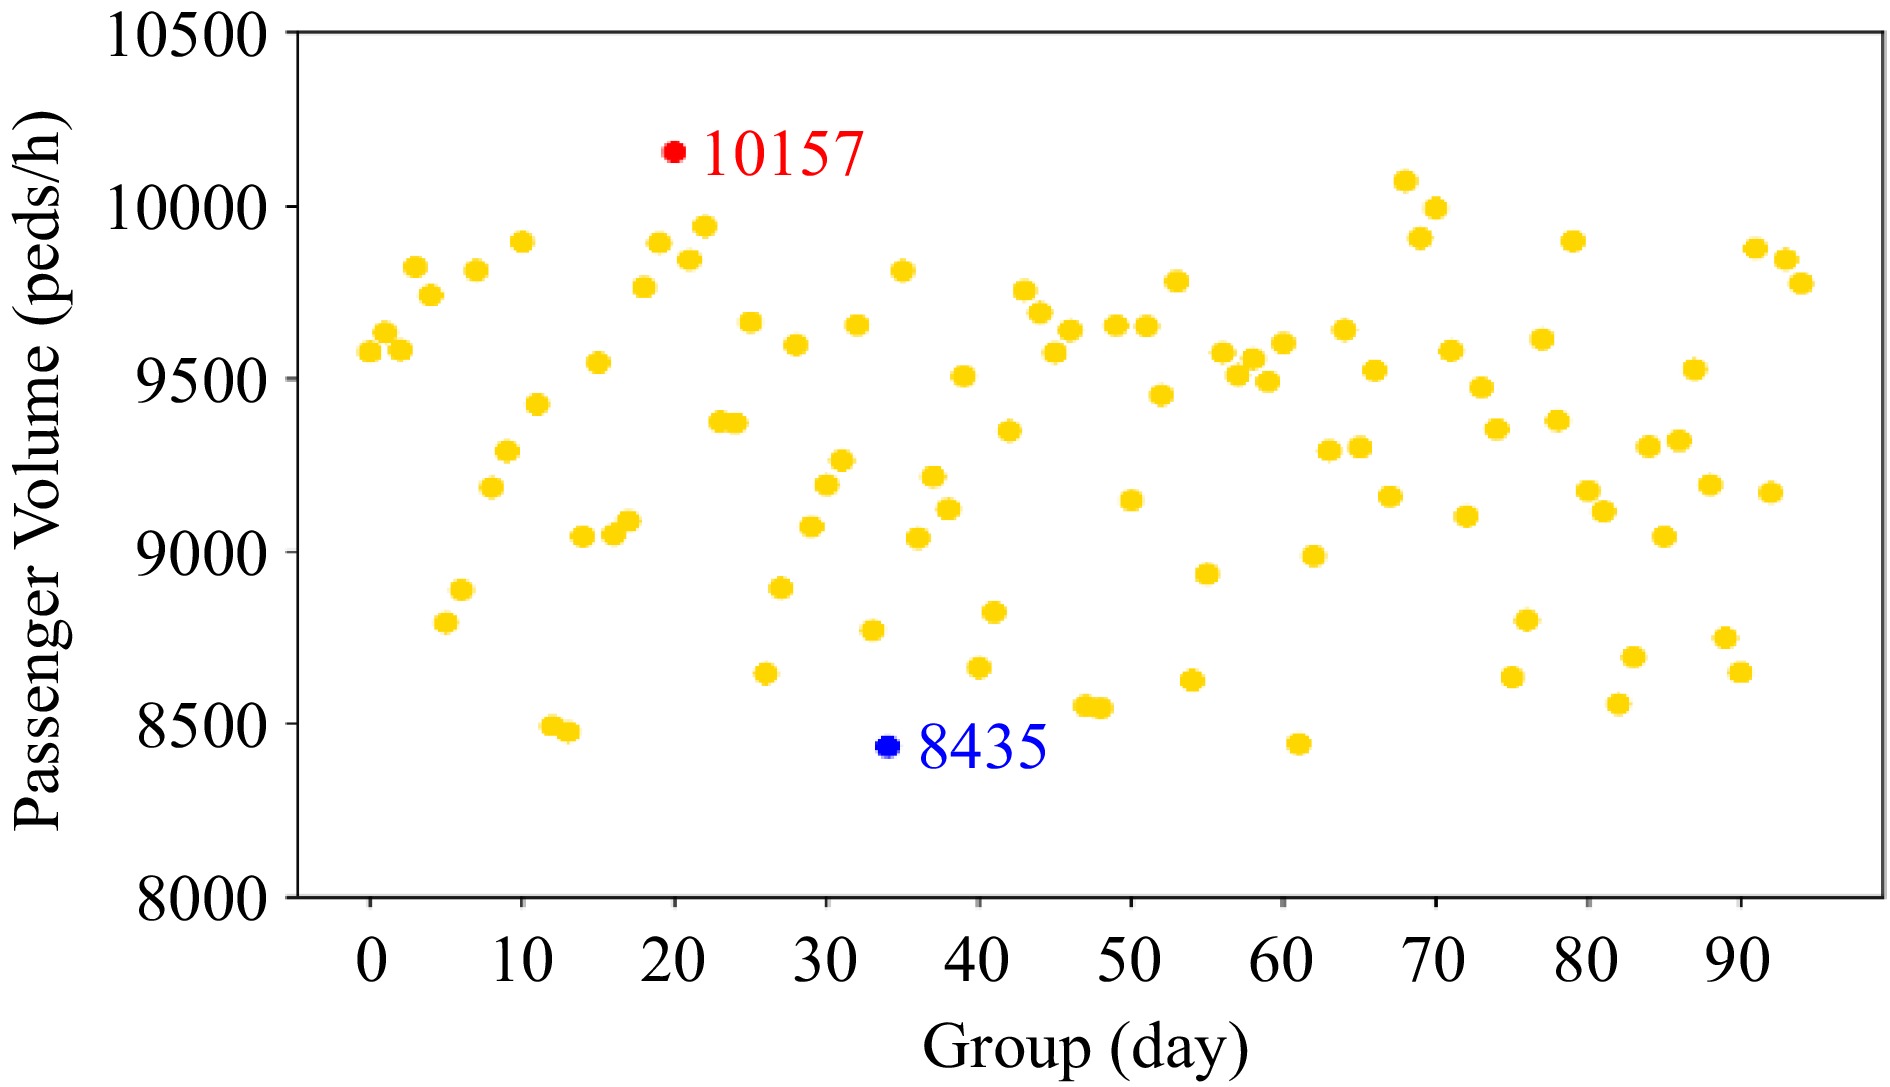
Figure 8.
The observation of volumes of passenger flow in subway stations.
-
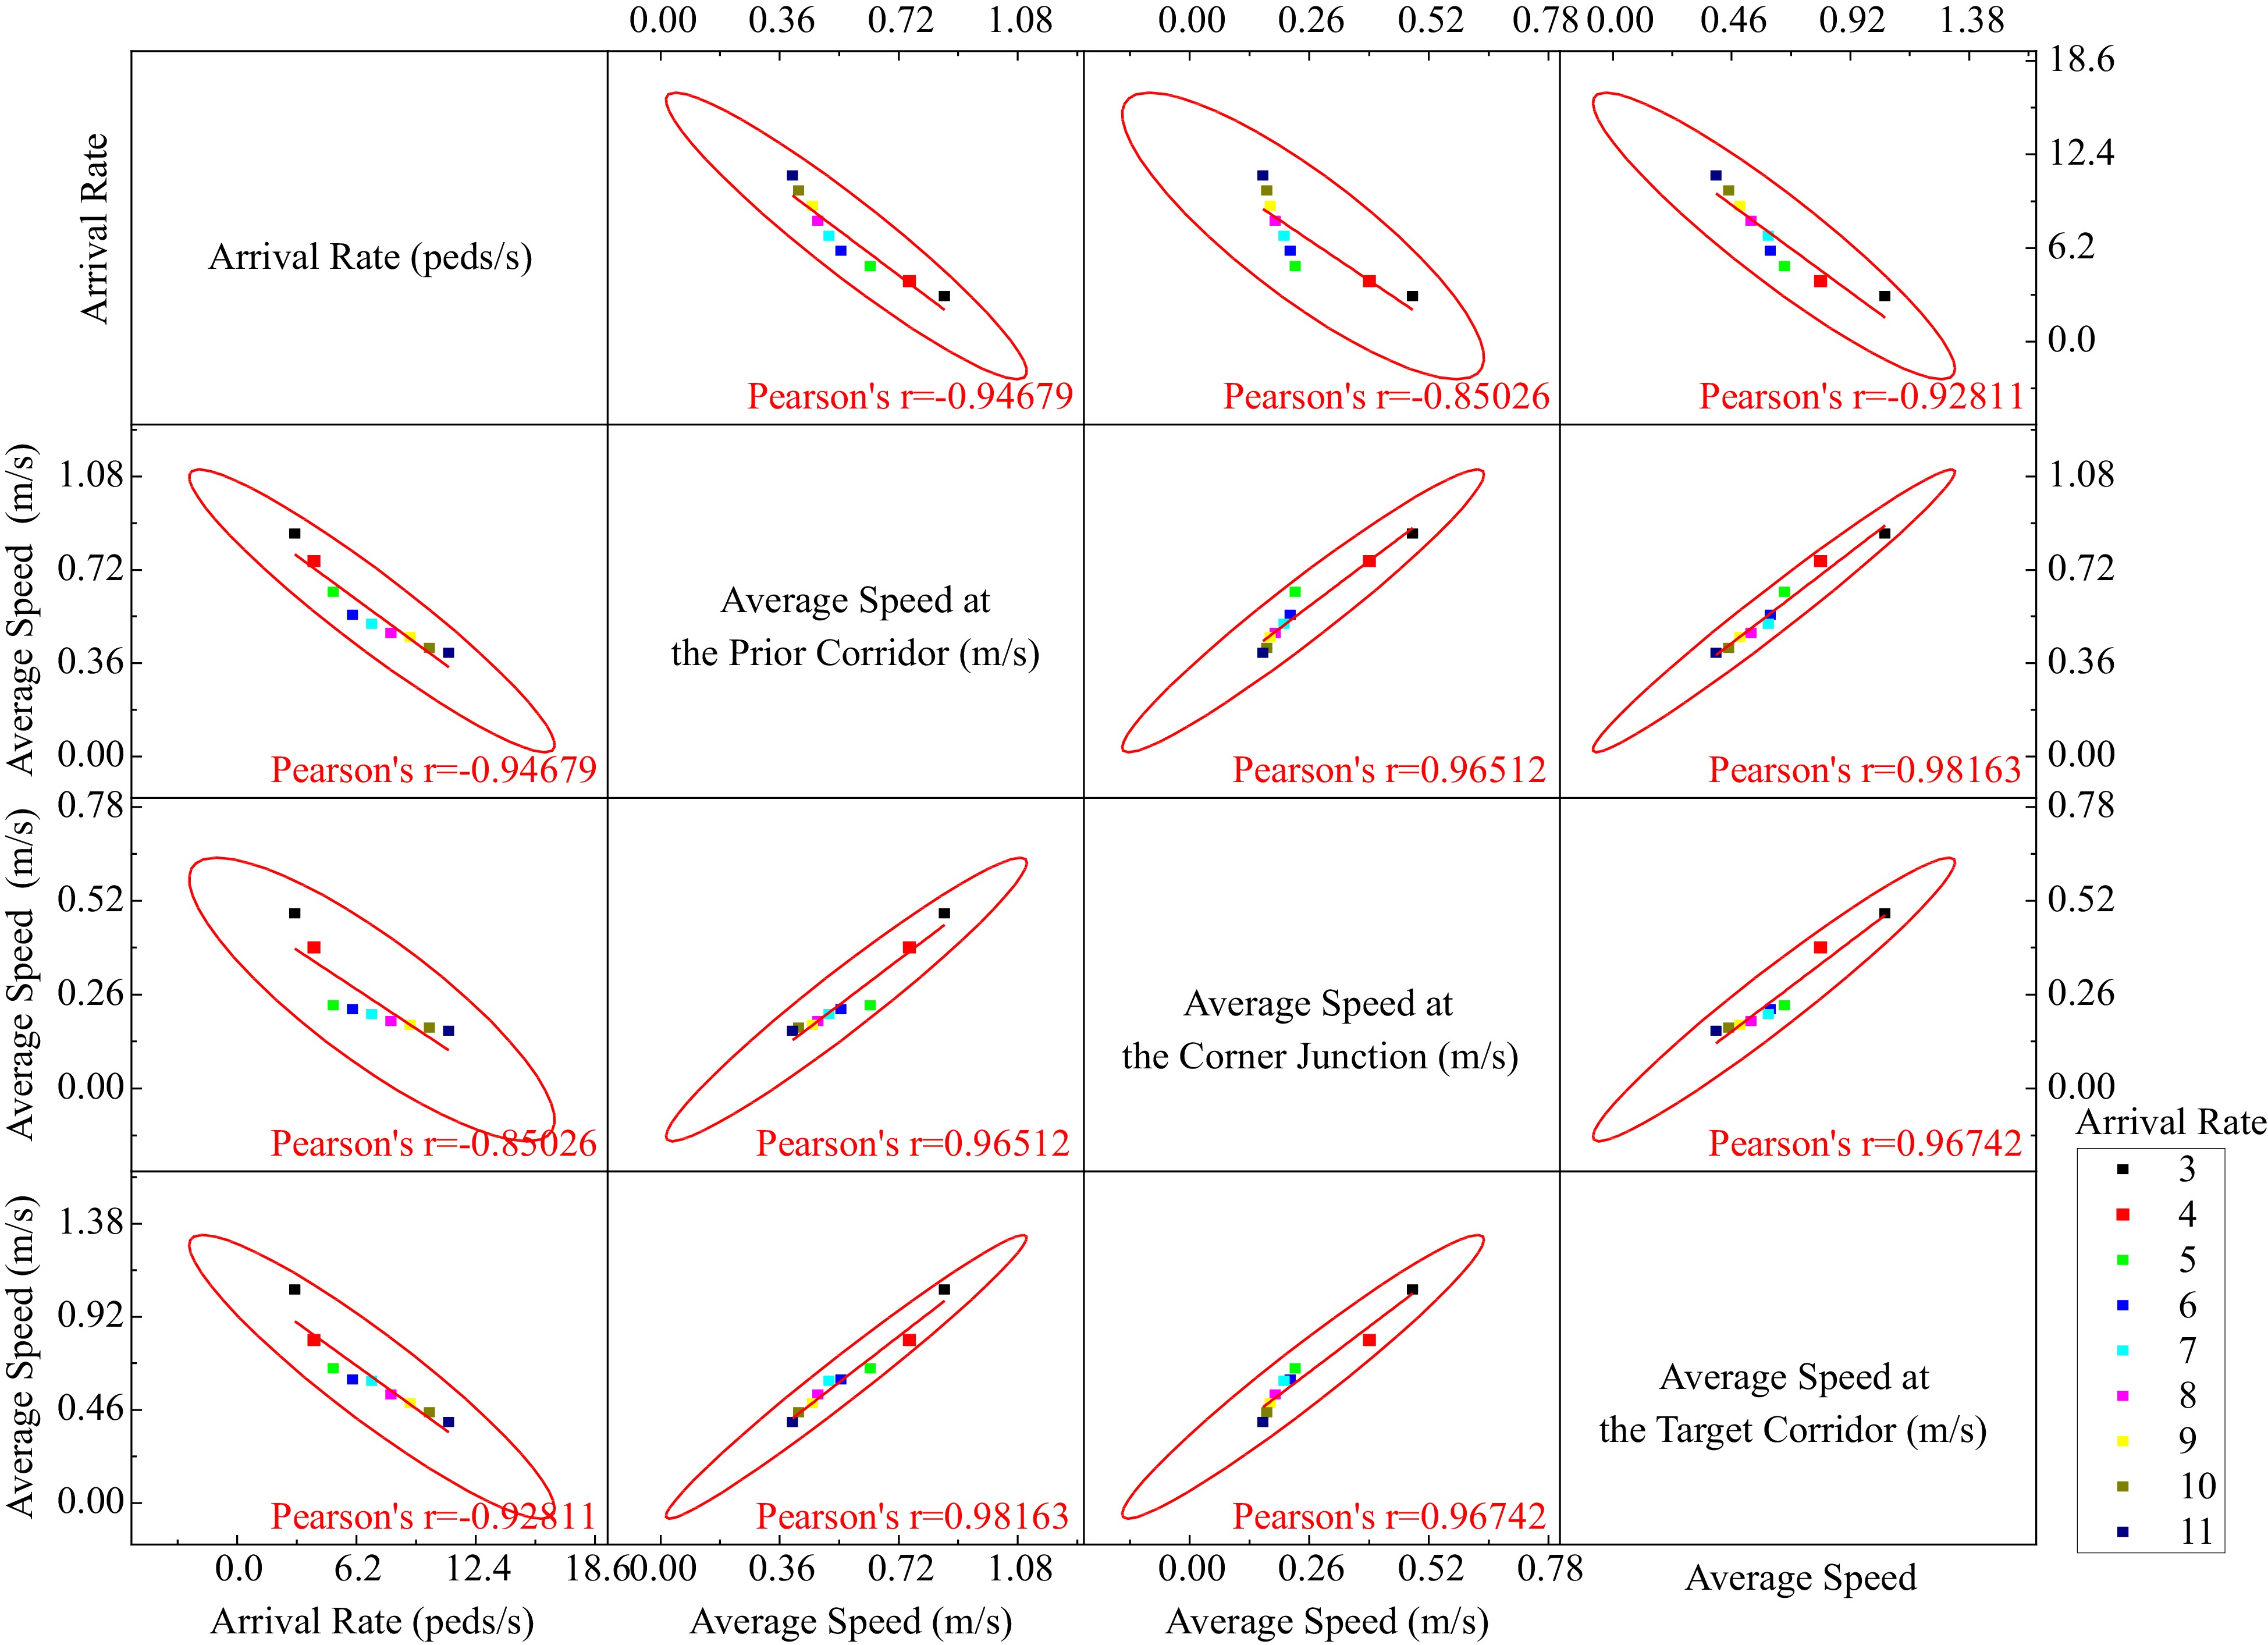
Figure 9.
Pairwise scatter plots between coefficients of arrival rate and speeds.
-
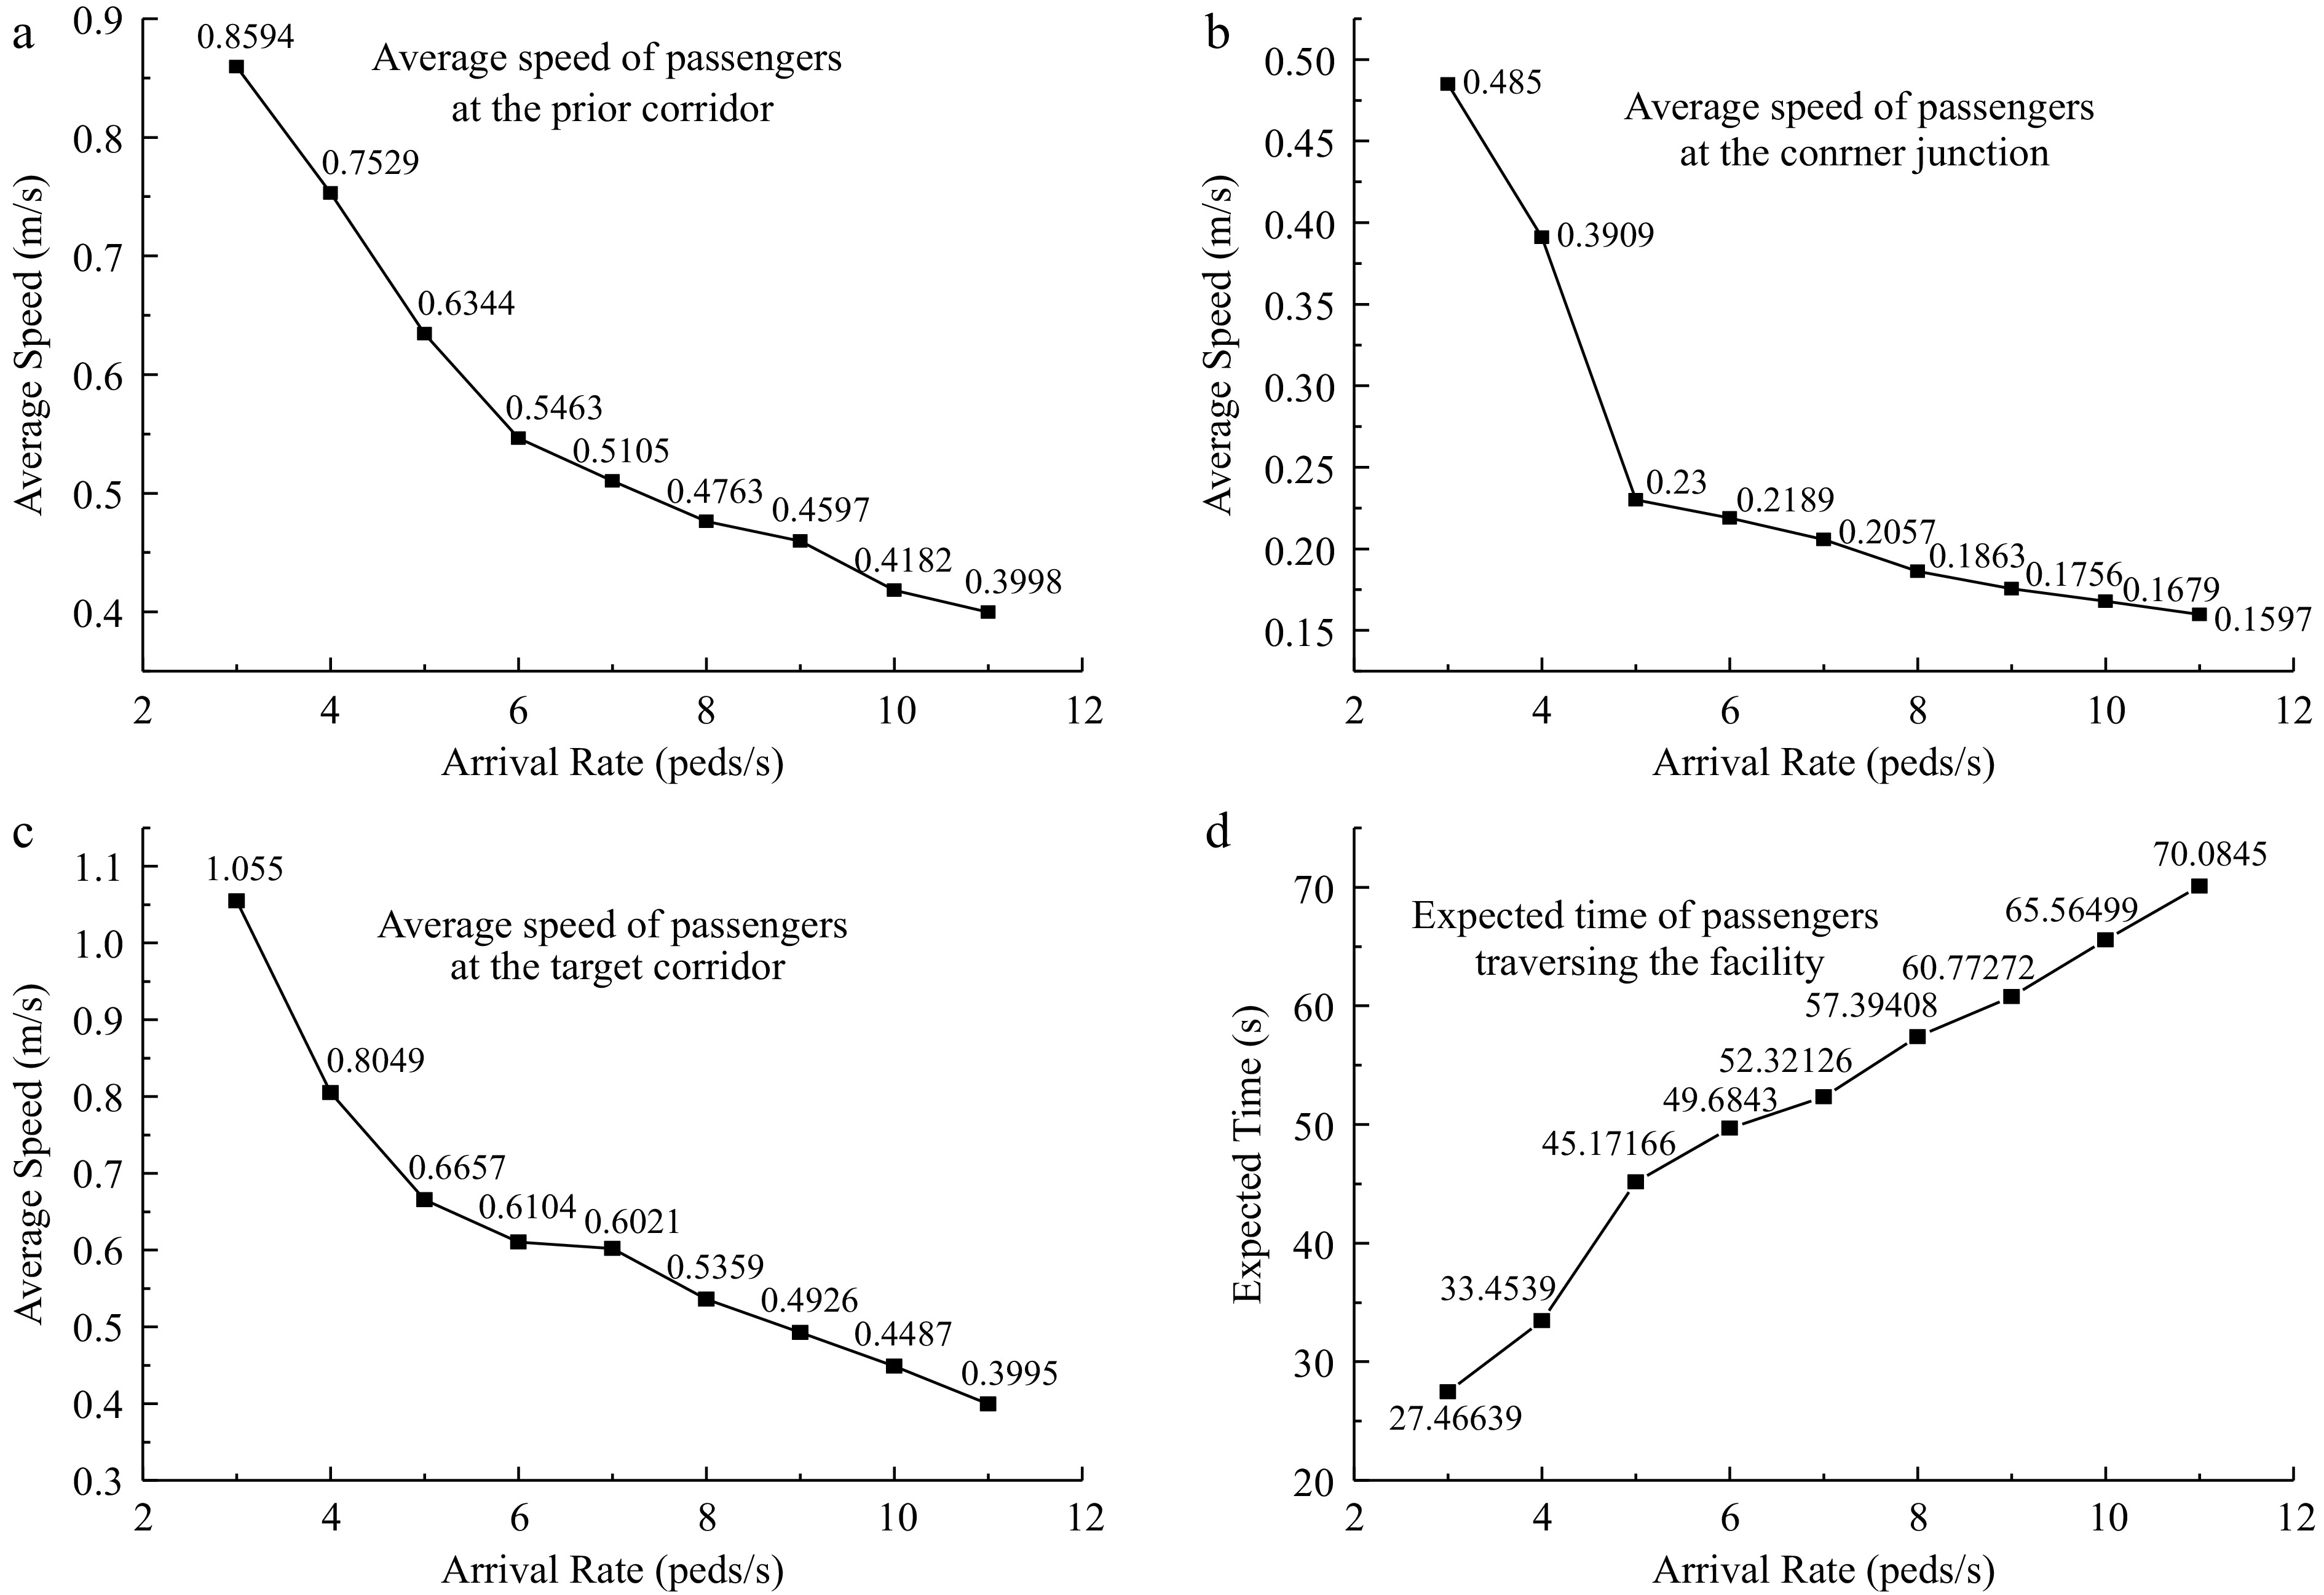
Figure 10.
Relationship between arrival rate and average speed and expected time. (a) Average speed of passengers at prior corriodor. (b) Average speed of passengers at the junction. (c) Average speed of passengers at target corridor. (d) Average speed of passgengers traversing the facility.
-
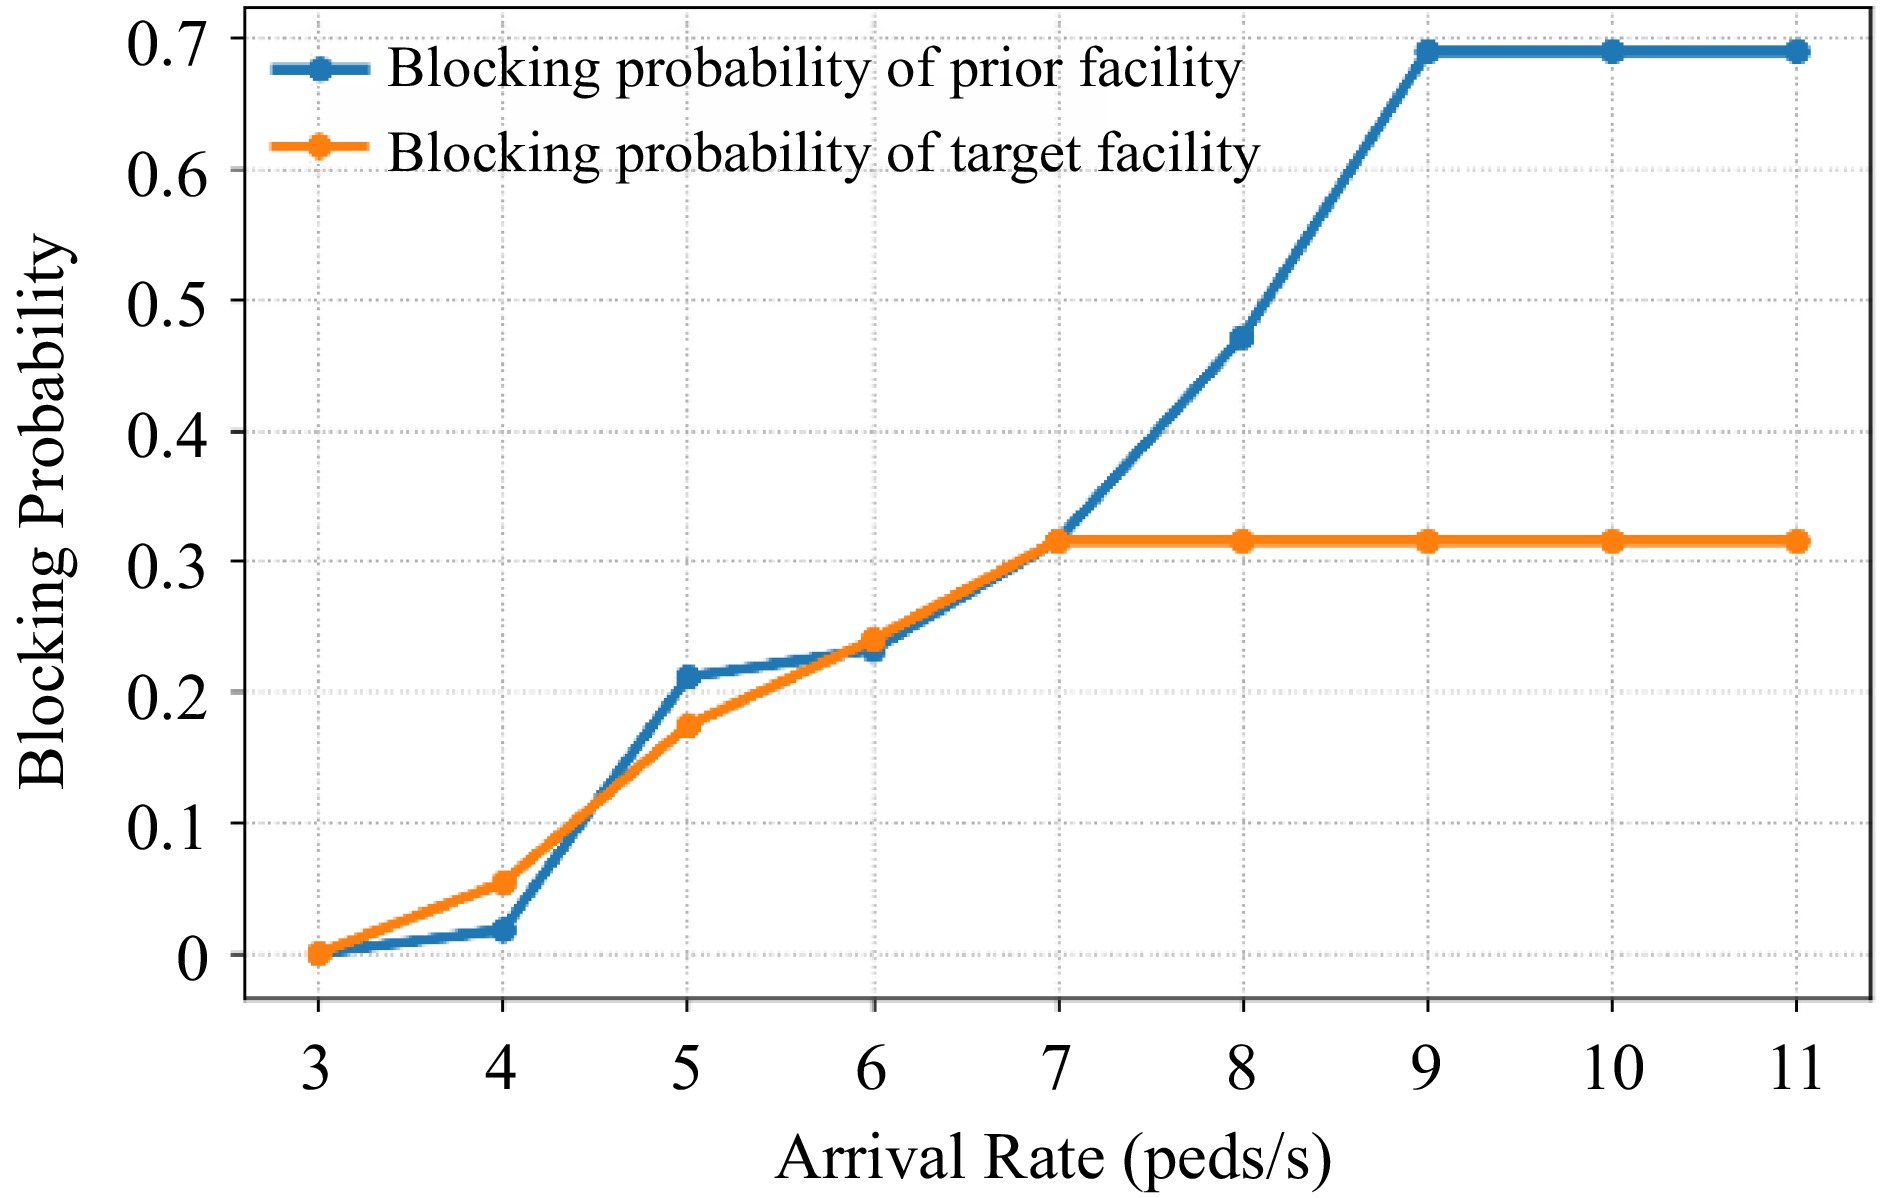
Figure 11.
The blocking probability with various arrival rates.
-

Figure 12.
The throughput and expected time with various arrival rates.
-
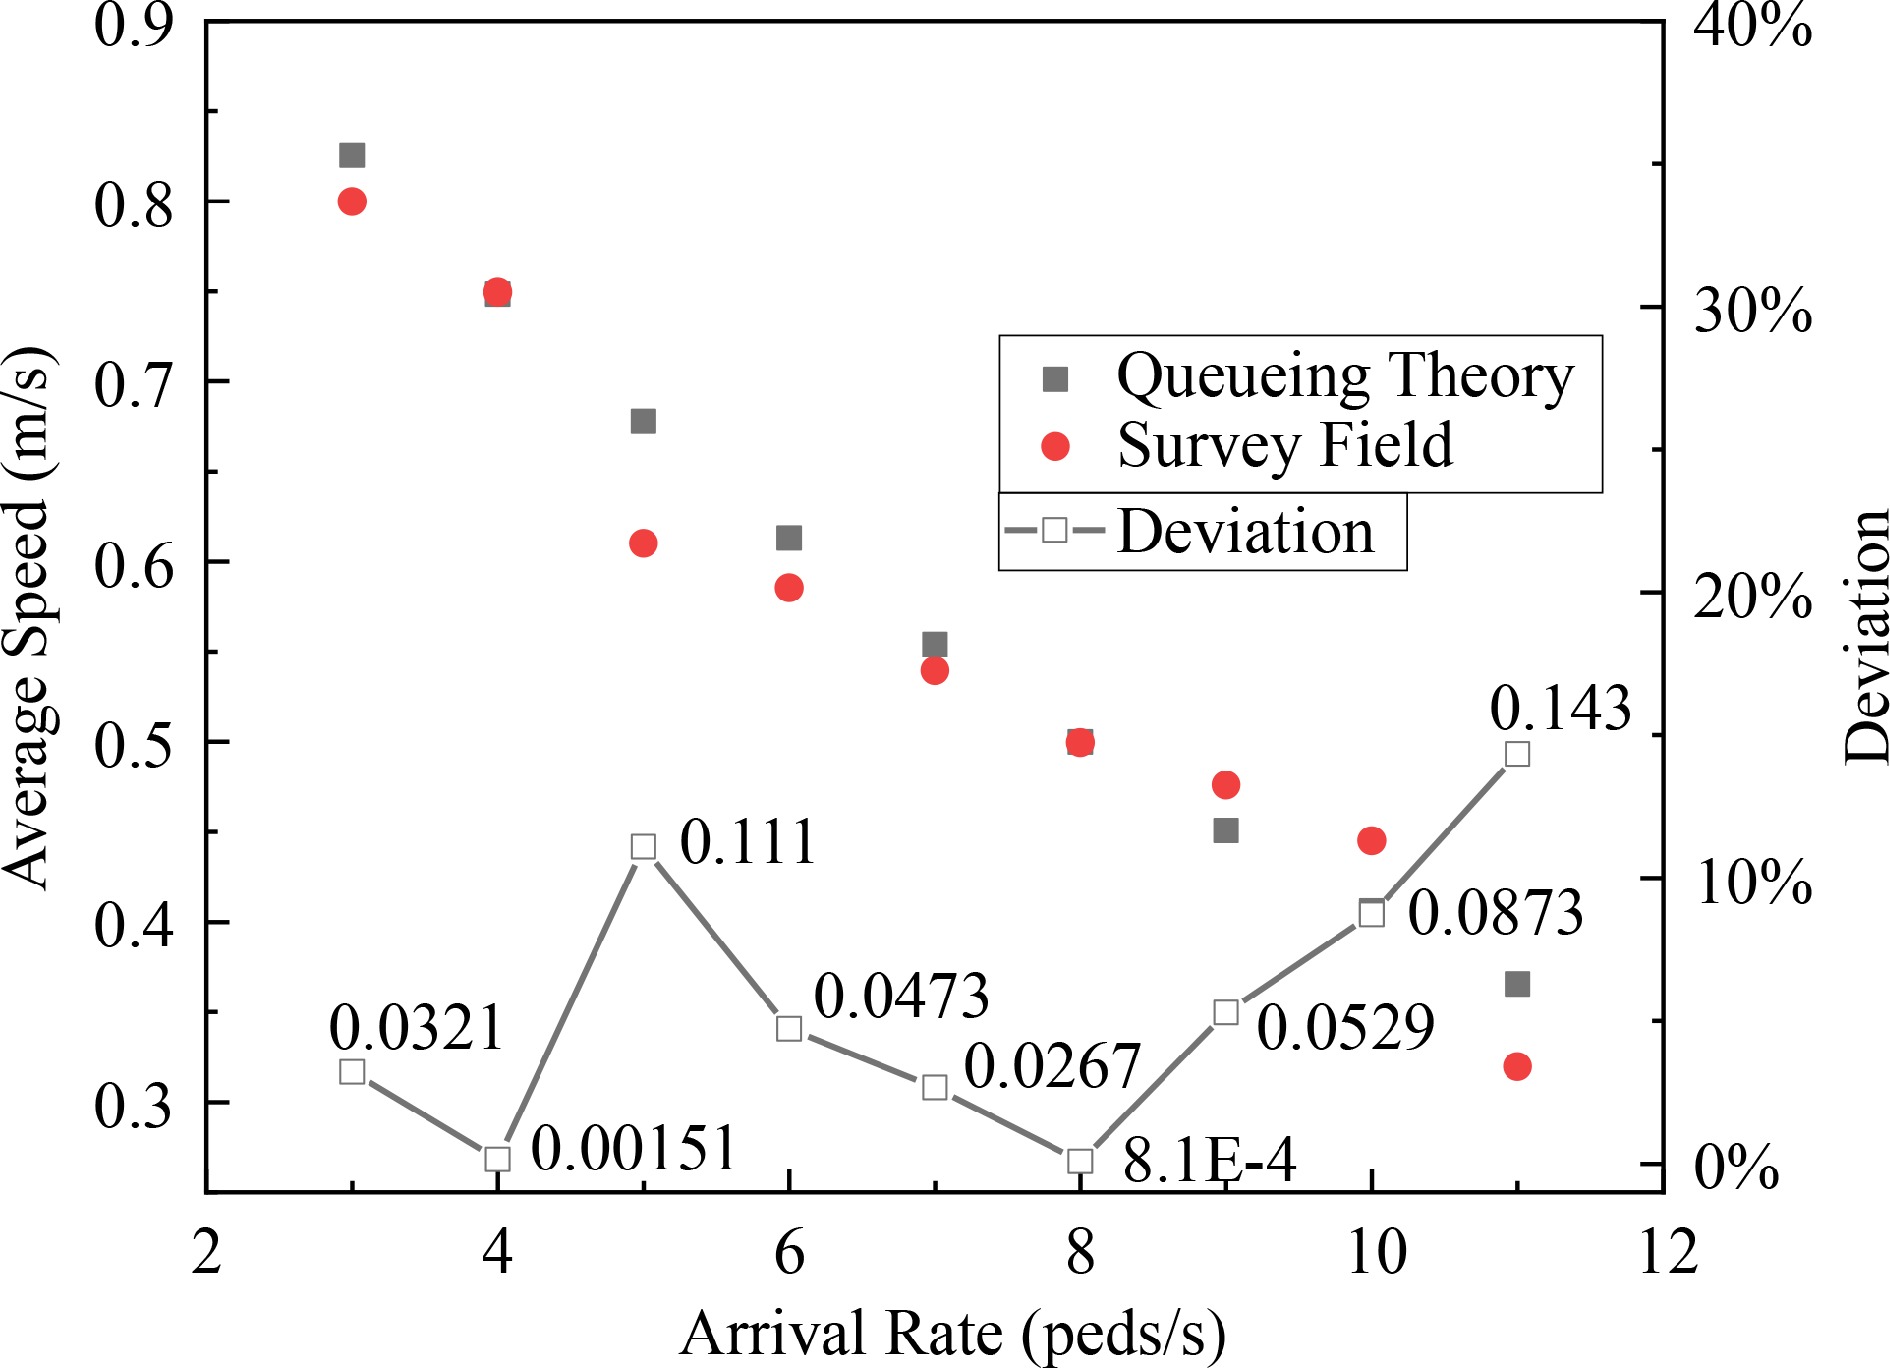
Figure 13.
The comparison of average speeds vary with arrival rates.
-

Figure 14.
The throughput of queueing network changes with the width of the target corridor.
-

Figure 15.
The comparison results for model verification. (a) Walking speeds of passengers in various scenarios. (b) The walking time of passengers in various scenarios.
-
Node Length
(m)Width
(m)$ {N}_{s} $ $ \mathbb{N} $ $ \mathrm{\mu } $ U K Corridor i 10 4.6 170 230 0.43 73 176 Corner j 4 4.6 92 92 0.59 54 146 Corridor k 8 4 72 160 0.43 31 146 Table 1.
Configuration of the queueing network of a corner.
-
Observation
regionMean (m/s) Median (m/s) Max
(m/s)Min
(m/s)Standard deviation (m/s) Prior corridor 0.449 0.376 0.759 0.230 0.163 Corner junction 0.248 0.201 0.495 0.160 0.119 Target corridor 0.579 0.505 1.055 0.380 0.127 Table 2.
Descriptive statistics of the speed of passengers at the corner.
-
Correlation Passenger volume (peds) Mean time (s) Mean speed (peds/s) r Alighting passengers 140 19.19 6.225 0.237 Boarding passengers 38 12.98 2.927 0.236 Total passengers 178 23.91 7.670 0.039 Table 3.
Correlation analysis between the volume of passengers and their speed.
Figures
(15)
Tables
(3)