-

Figure 1.
Tissue-specific expression patterns of poplar PRE1 and hormone-induced expression changes. (a) Relative expression of poplar PRE1 in various tissues. (b) Expression of poplar PRE1 in response to salicylic acid and gibberellin. actin was used as a reference. (c) Poplar PRE1 expression between parents and offspring. (d) Poplar PRE1 expression in response to drought and salt stress. Pd: Populus deltoides 'Danhong', Ps: Populus simonii 'Tongliao1', GR: good rooting offspring, BR: bad rooting offspring. An ANOVA was used to determine statistical significance between sample means. Different letters above the bars indicate significantly different values (p < 0.05).
-

Figure 2.
Phylogenetic comparison and protein sequence alignments of PRE1 homologs. (a) A phylogenetic tree containing PRE homologs from Arabidopsis thaliana (At), Populus trichocarpa (Pt), Zea mays (Zm), and Oryza sativa (Os) was constructed with PsPRE1 marked in red. (b) Protein sequences of the PRE homologs were aligned and conserved motifs were highlighted above the sequences.
-

Figure 3.
Overexpression of PsPRE1 in poplar promoted root development and tolerance to salt stress. (a) Typical phenotypes of wild-type and the transgenic lines OE#14 and OE#15 overexpressing PsPRE1 under control and salt stress conditions. Scale bar = 3 cm. (b) Plant height, (c) fresh weight above ground, (d) total number of roots, (e) maximum root length, and (f) root fresh weight of wild-type and transgenic lines under normal and salt stress conditions. A Student's t-test was used to determine statistical significance between sample means. *, p < 0.05; ns, nonsignificant.
-

Figure 4.
Identifying differentially expressed genes (DEGs) in transgenic poplar line OE#14 overexpressing PsPRE1. (a) A principal component analysis (PCA) of the expressed genes revealed a clear separation between samples with principal component 1 (PC1), PC2, and PC3 explaining 77.4%, 16.8%, and 2.9% of the total variance, respectively. (b) The number of DEGs in wild-type (WT) versus the OE#14 line. Up-regulated DEGs are in pink and down-regulated DEGs are in light green. (c) Gene Ontology (GO) enrichment analysis of DEGs. The node color represents the -log10 transformed false discovery rate (FDR) corrected p-value. The node size represents the number of DEGs within each GO term. Heatmap summarizing the expression of DEGs related to (d) salicylic acid, (e) gibberellin, and (f) auxin from the GO enrichment results.
-
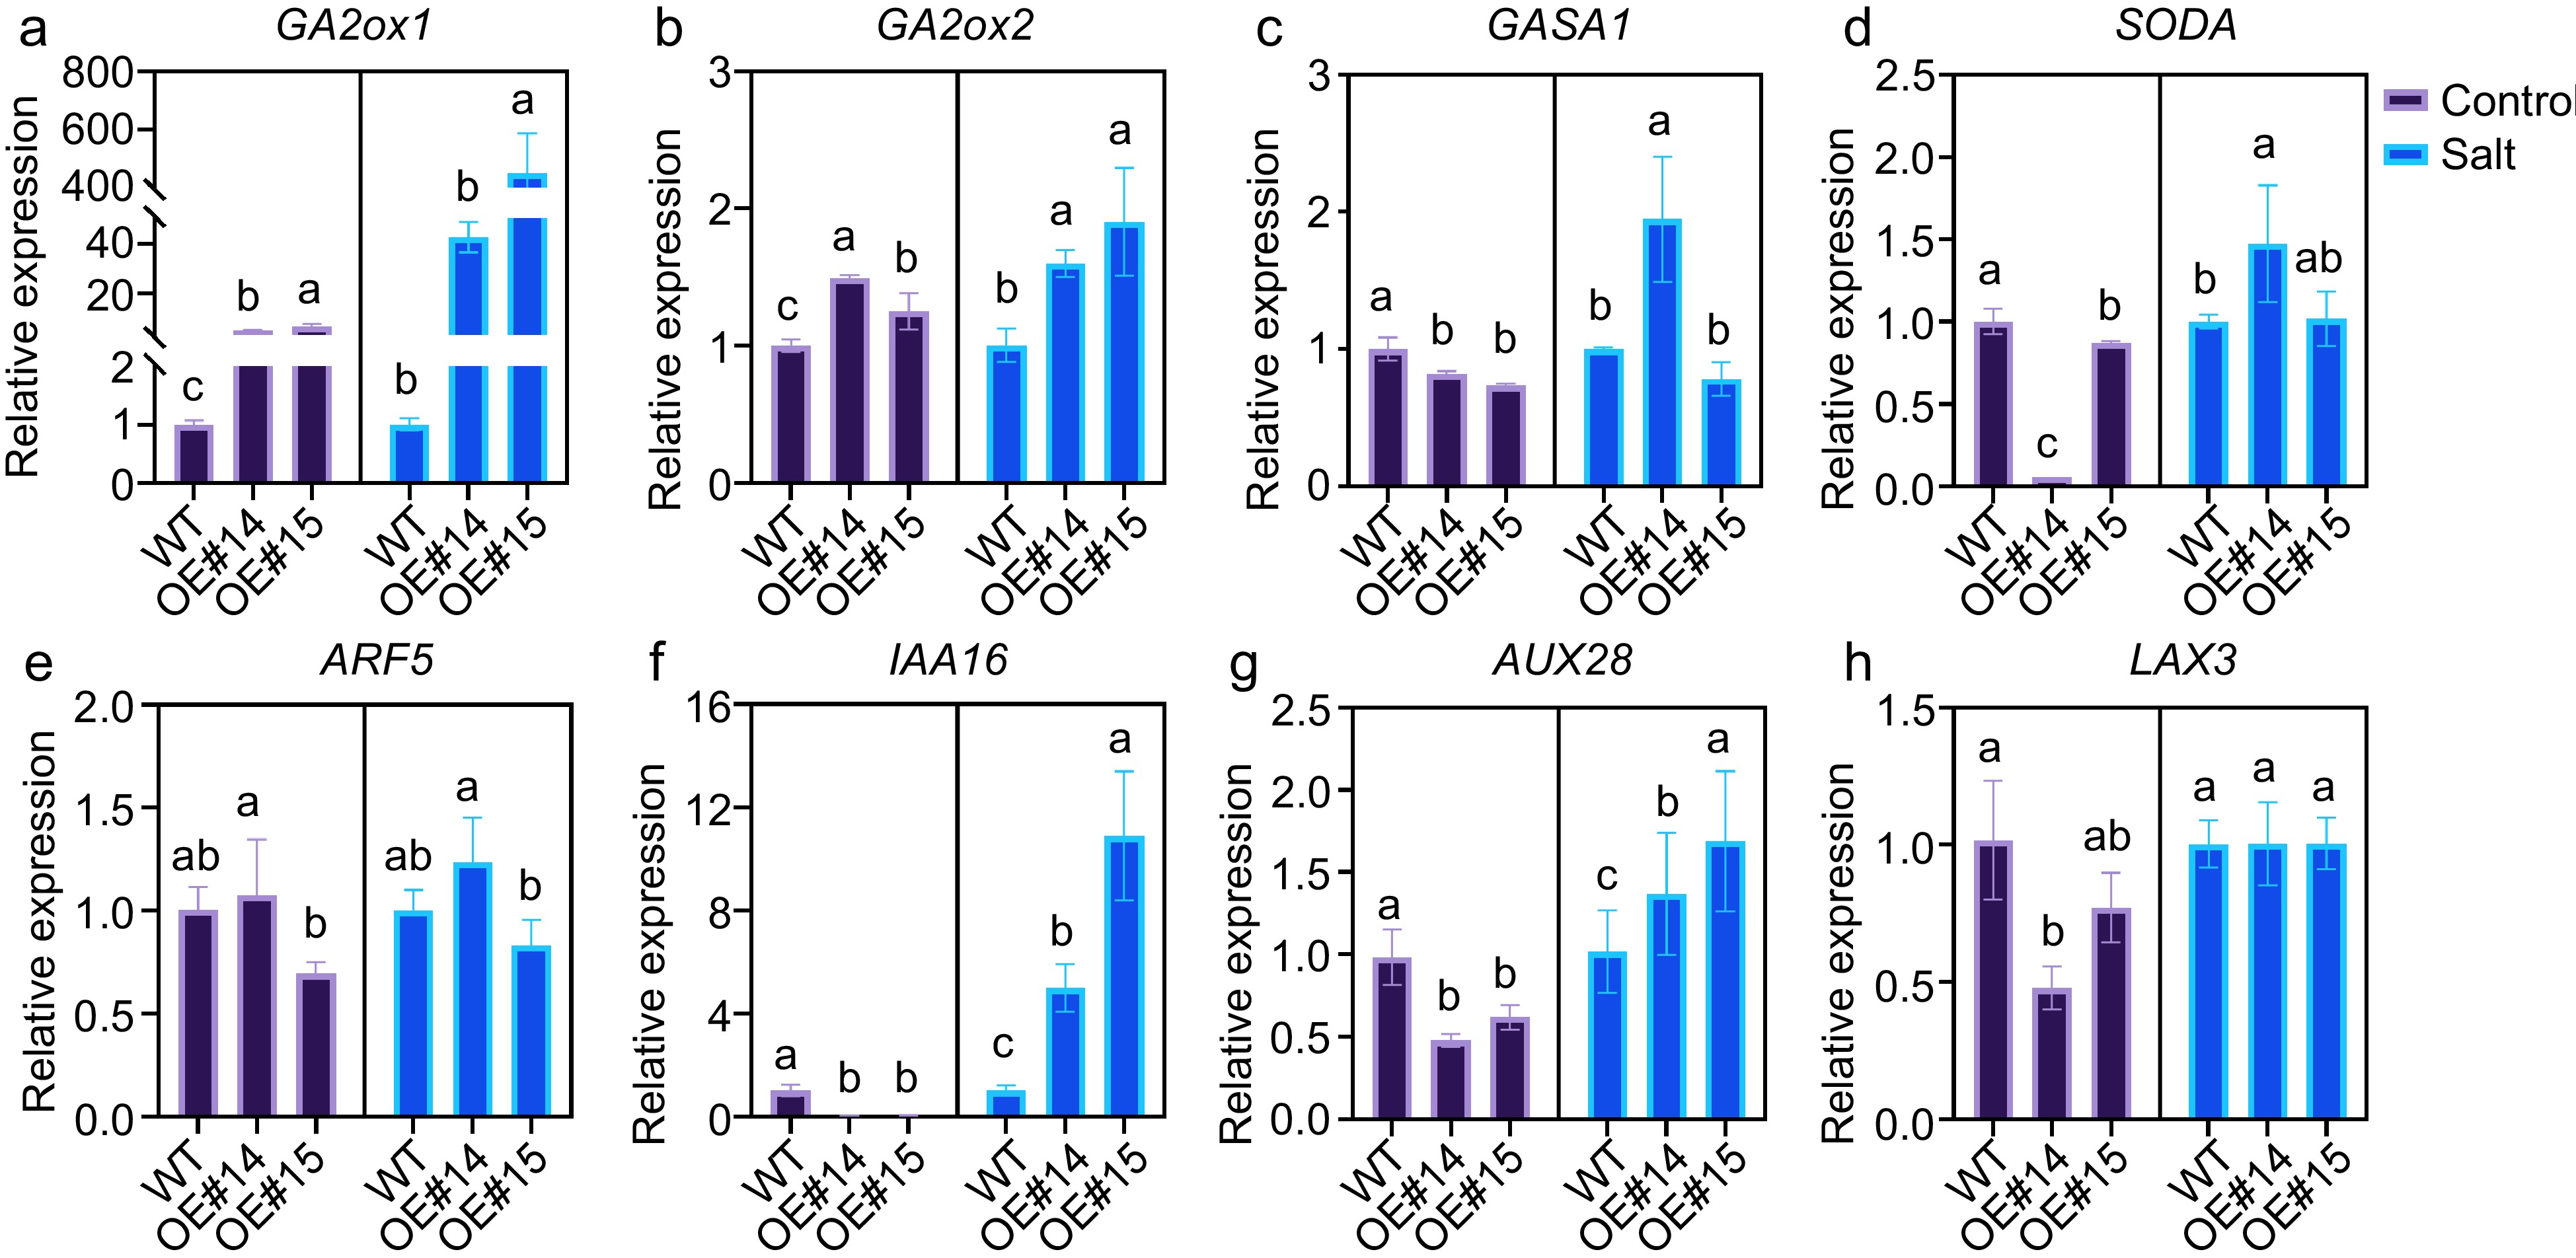
Figure 5.
Auxin- and gibberellin-related genes expression in the PsPRE1-overexpression lines. actin was used as a reference. Statistical analysis based on ANOVA, different letters above the bars indicate significantly different values (p < 0.05).
-
Trait QTL
codeLOD Genetic
distanceCandidate
geneHomologous
geneChr Phytozome
annotationRoot Dry Weight qRDW-LG18-21 4.35 107.916 Potri.004G128400 AT5G39860 Chr04 Similar to expressed protein in Arabidopsis thaliana; similar to supported by full length cDNA gi:26453215 from (Arabidopsis thaliana);
[co-ortholog (2 of 2) of At1g26945]Table 1.
QTL annotation of PRE1.
Figures
(5)
Tables
(1)