-
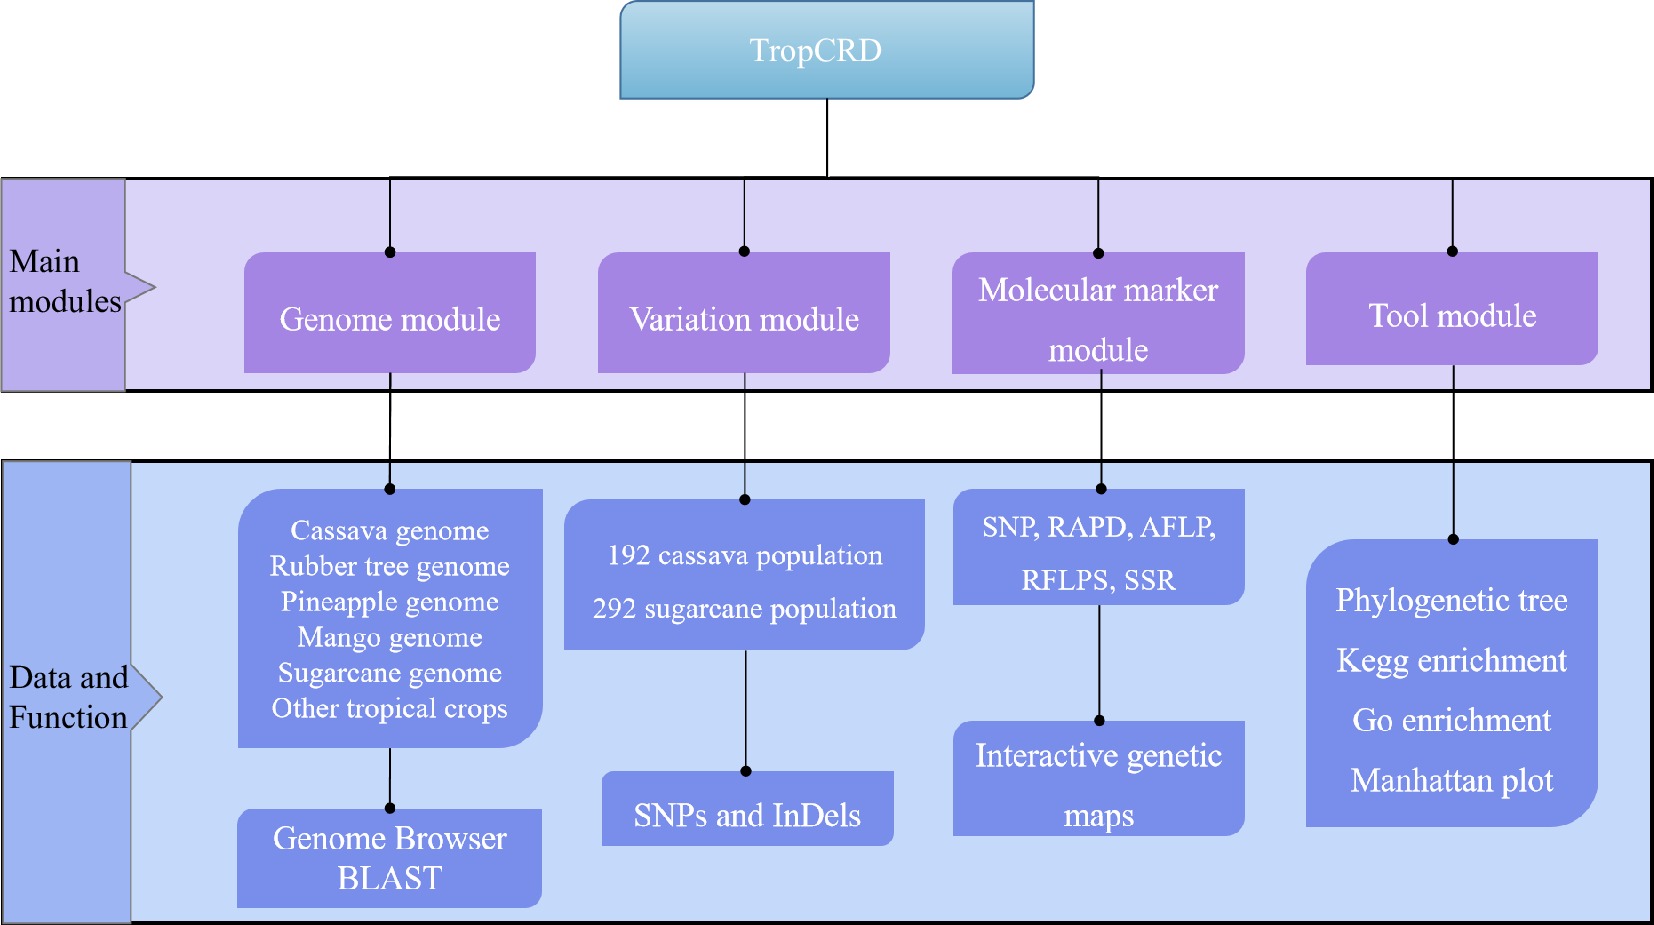
Figure 1.
Main data modules of tropical crop database.
-
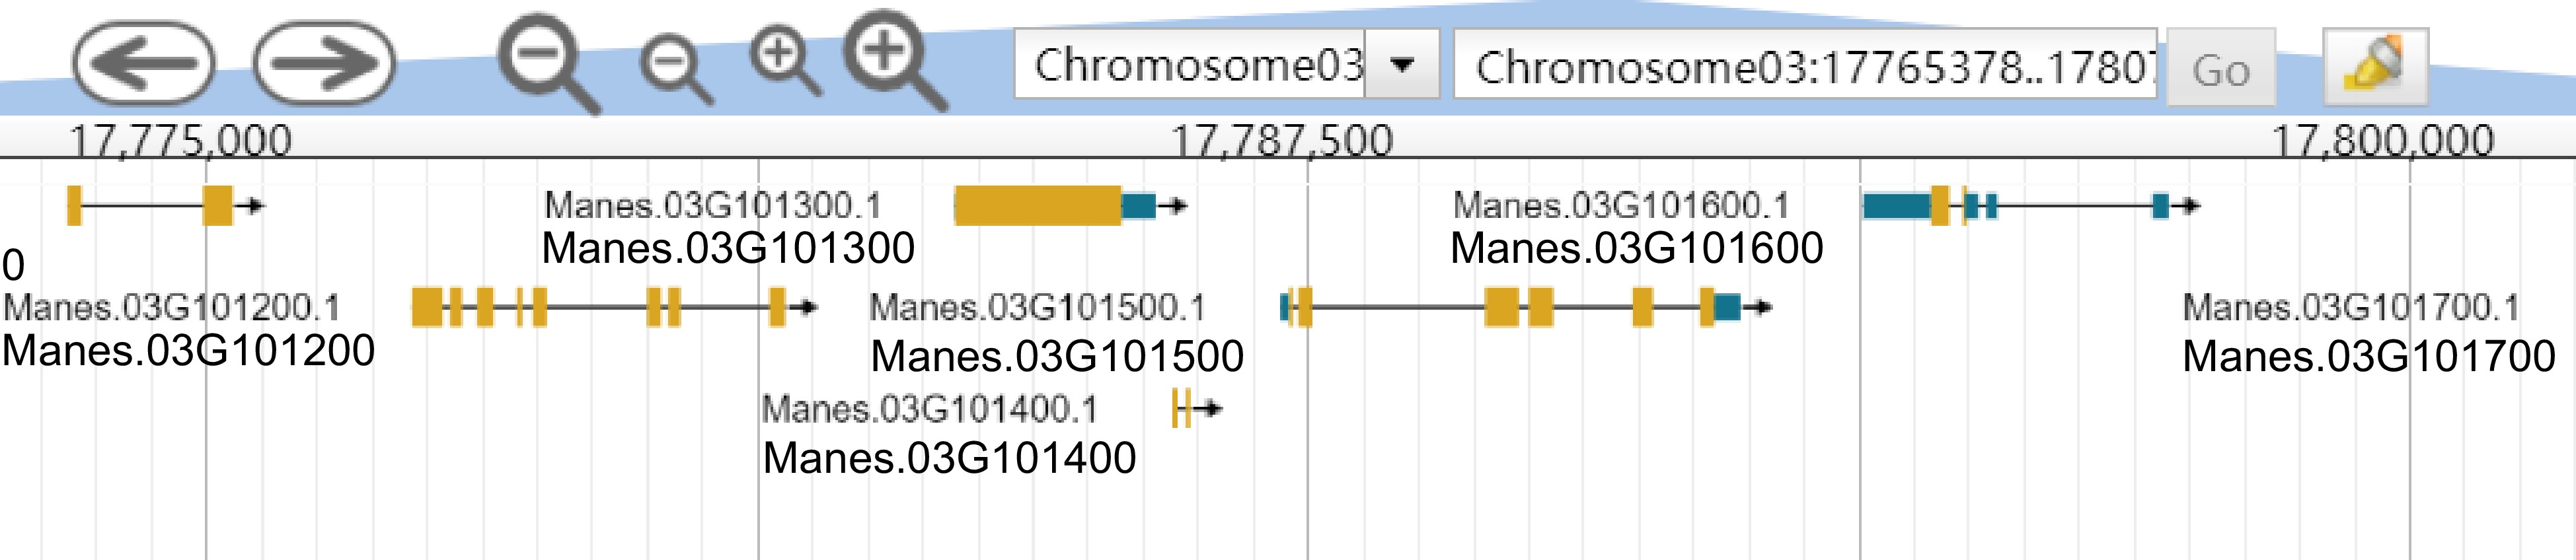
Figure 2.
The genome region of chromosome 3: 17,775,000 ~ 17,785,000 bp.
-
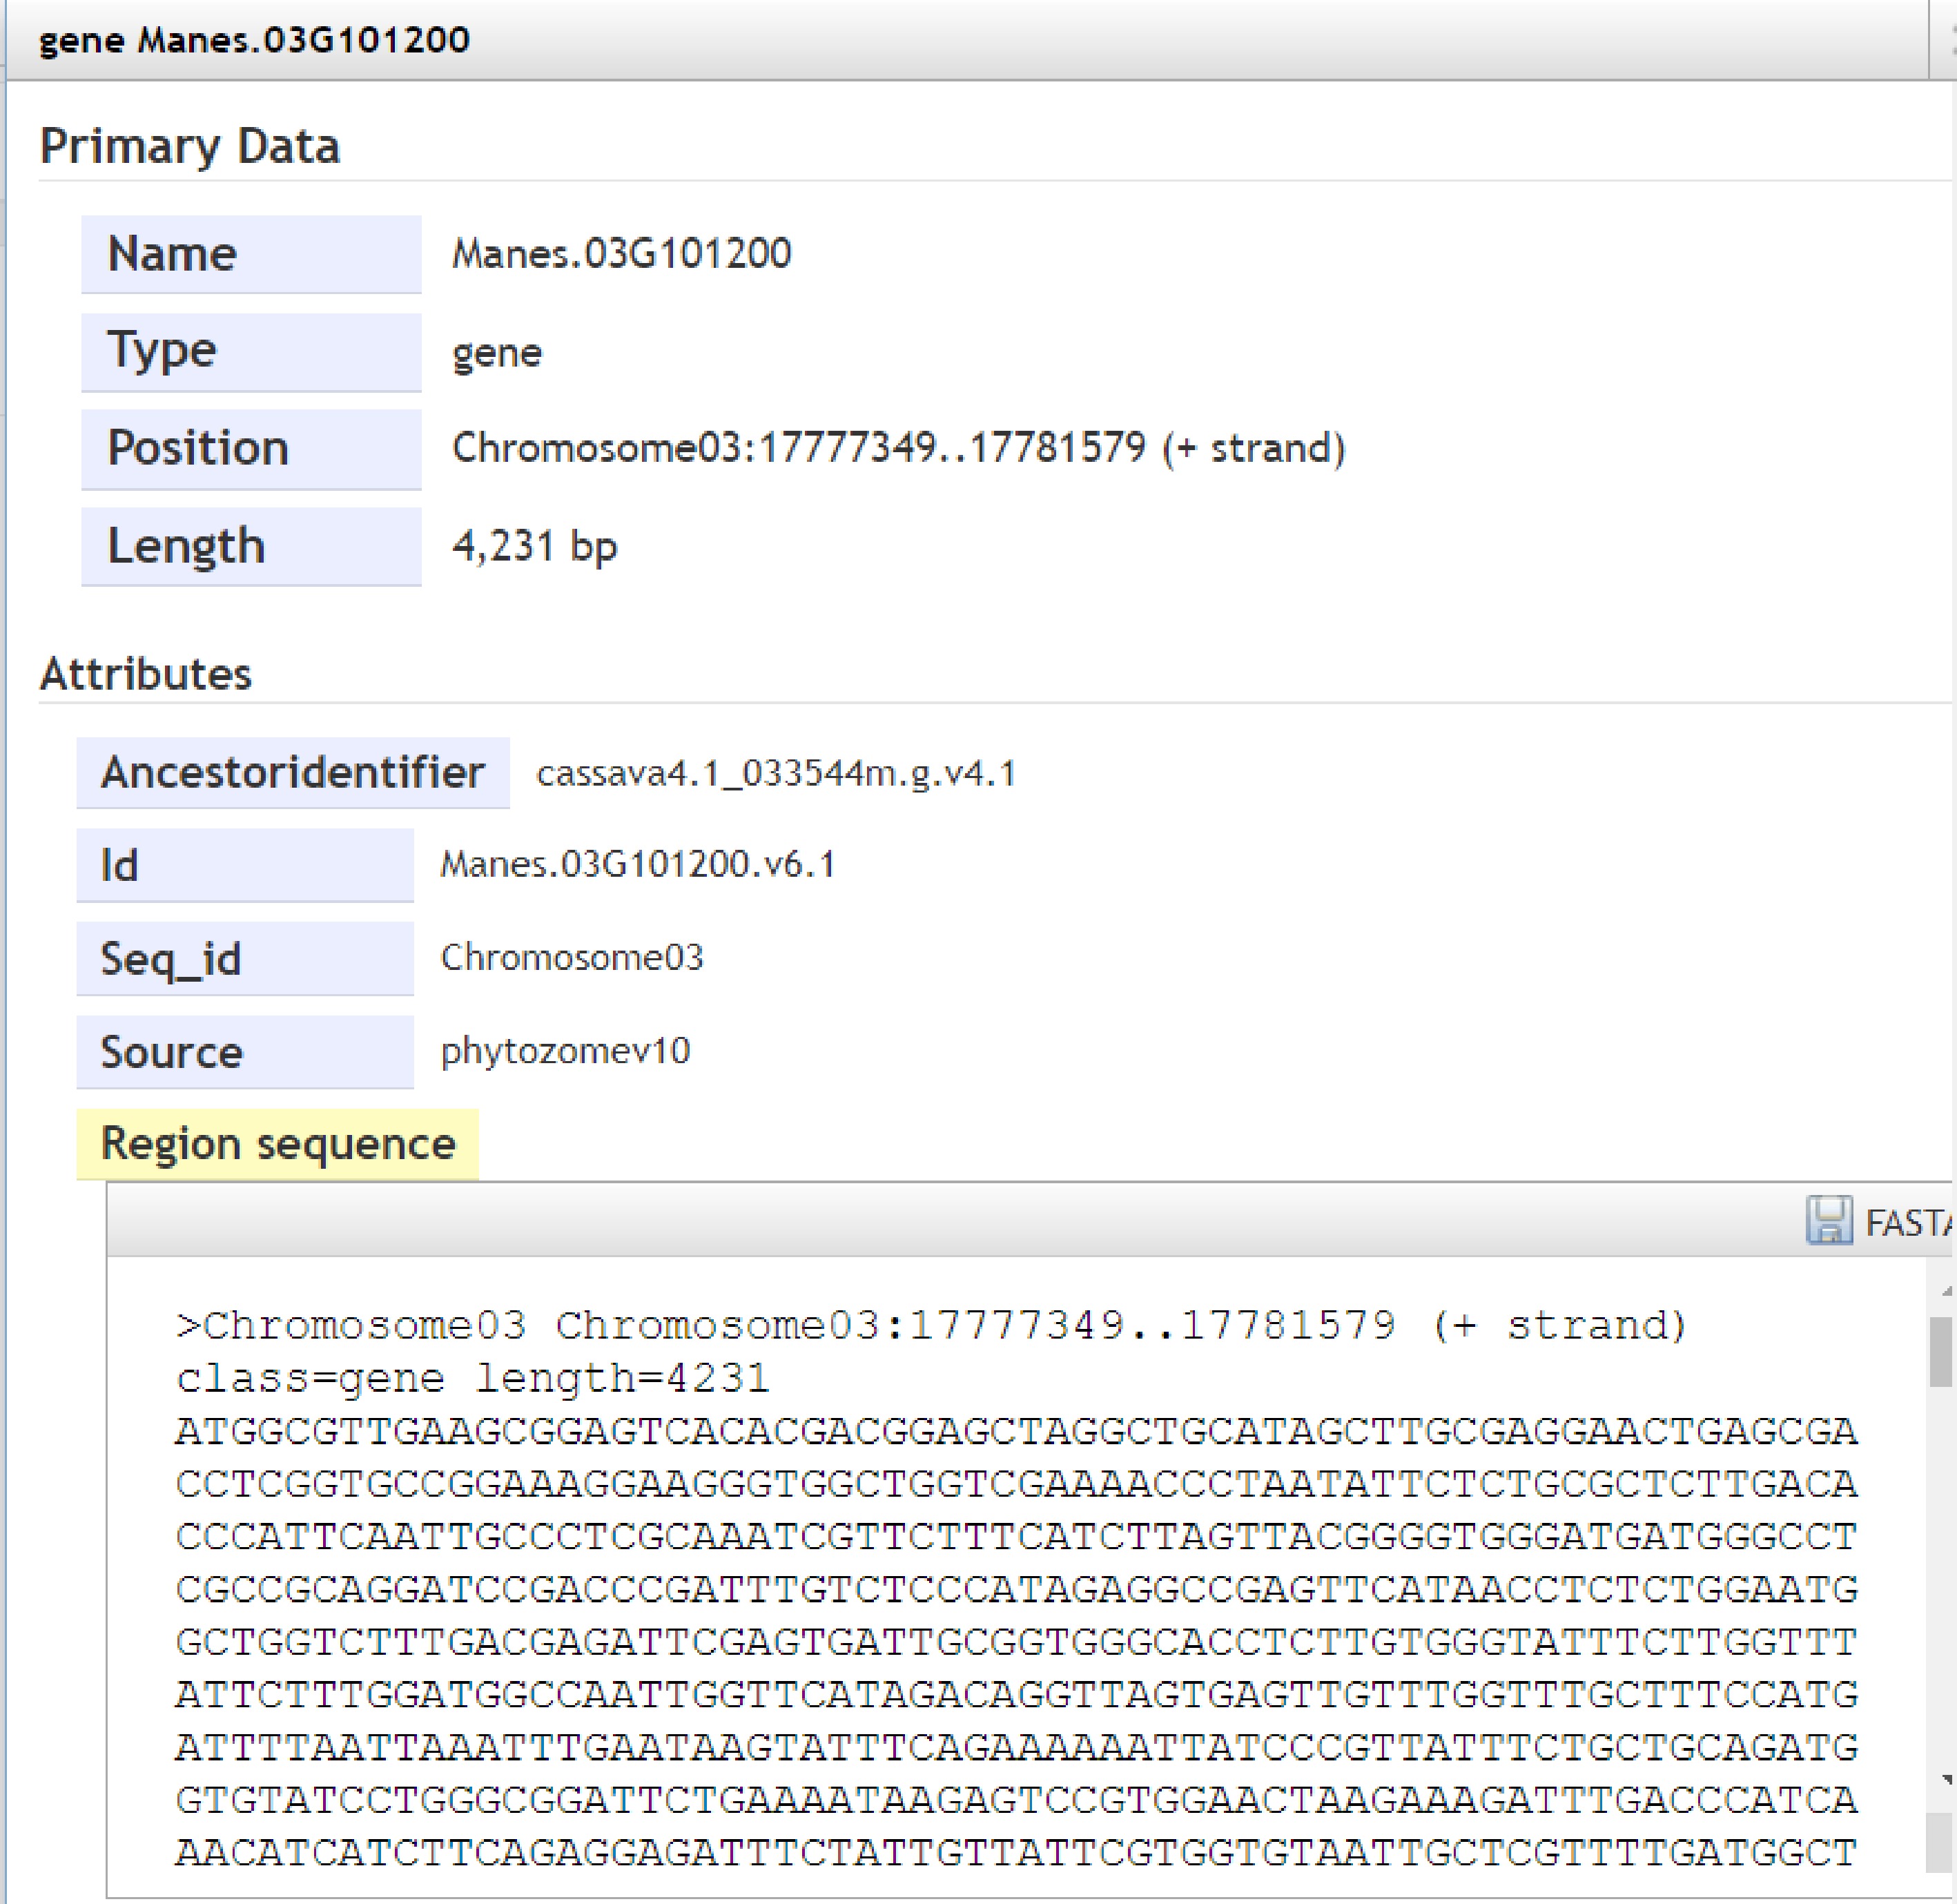
Figure 3.
Sequence information of the gene 'Manes.03G101200'.
-
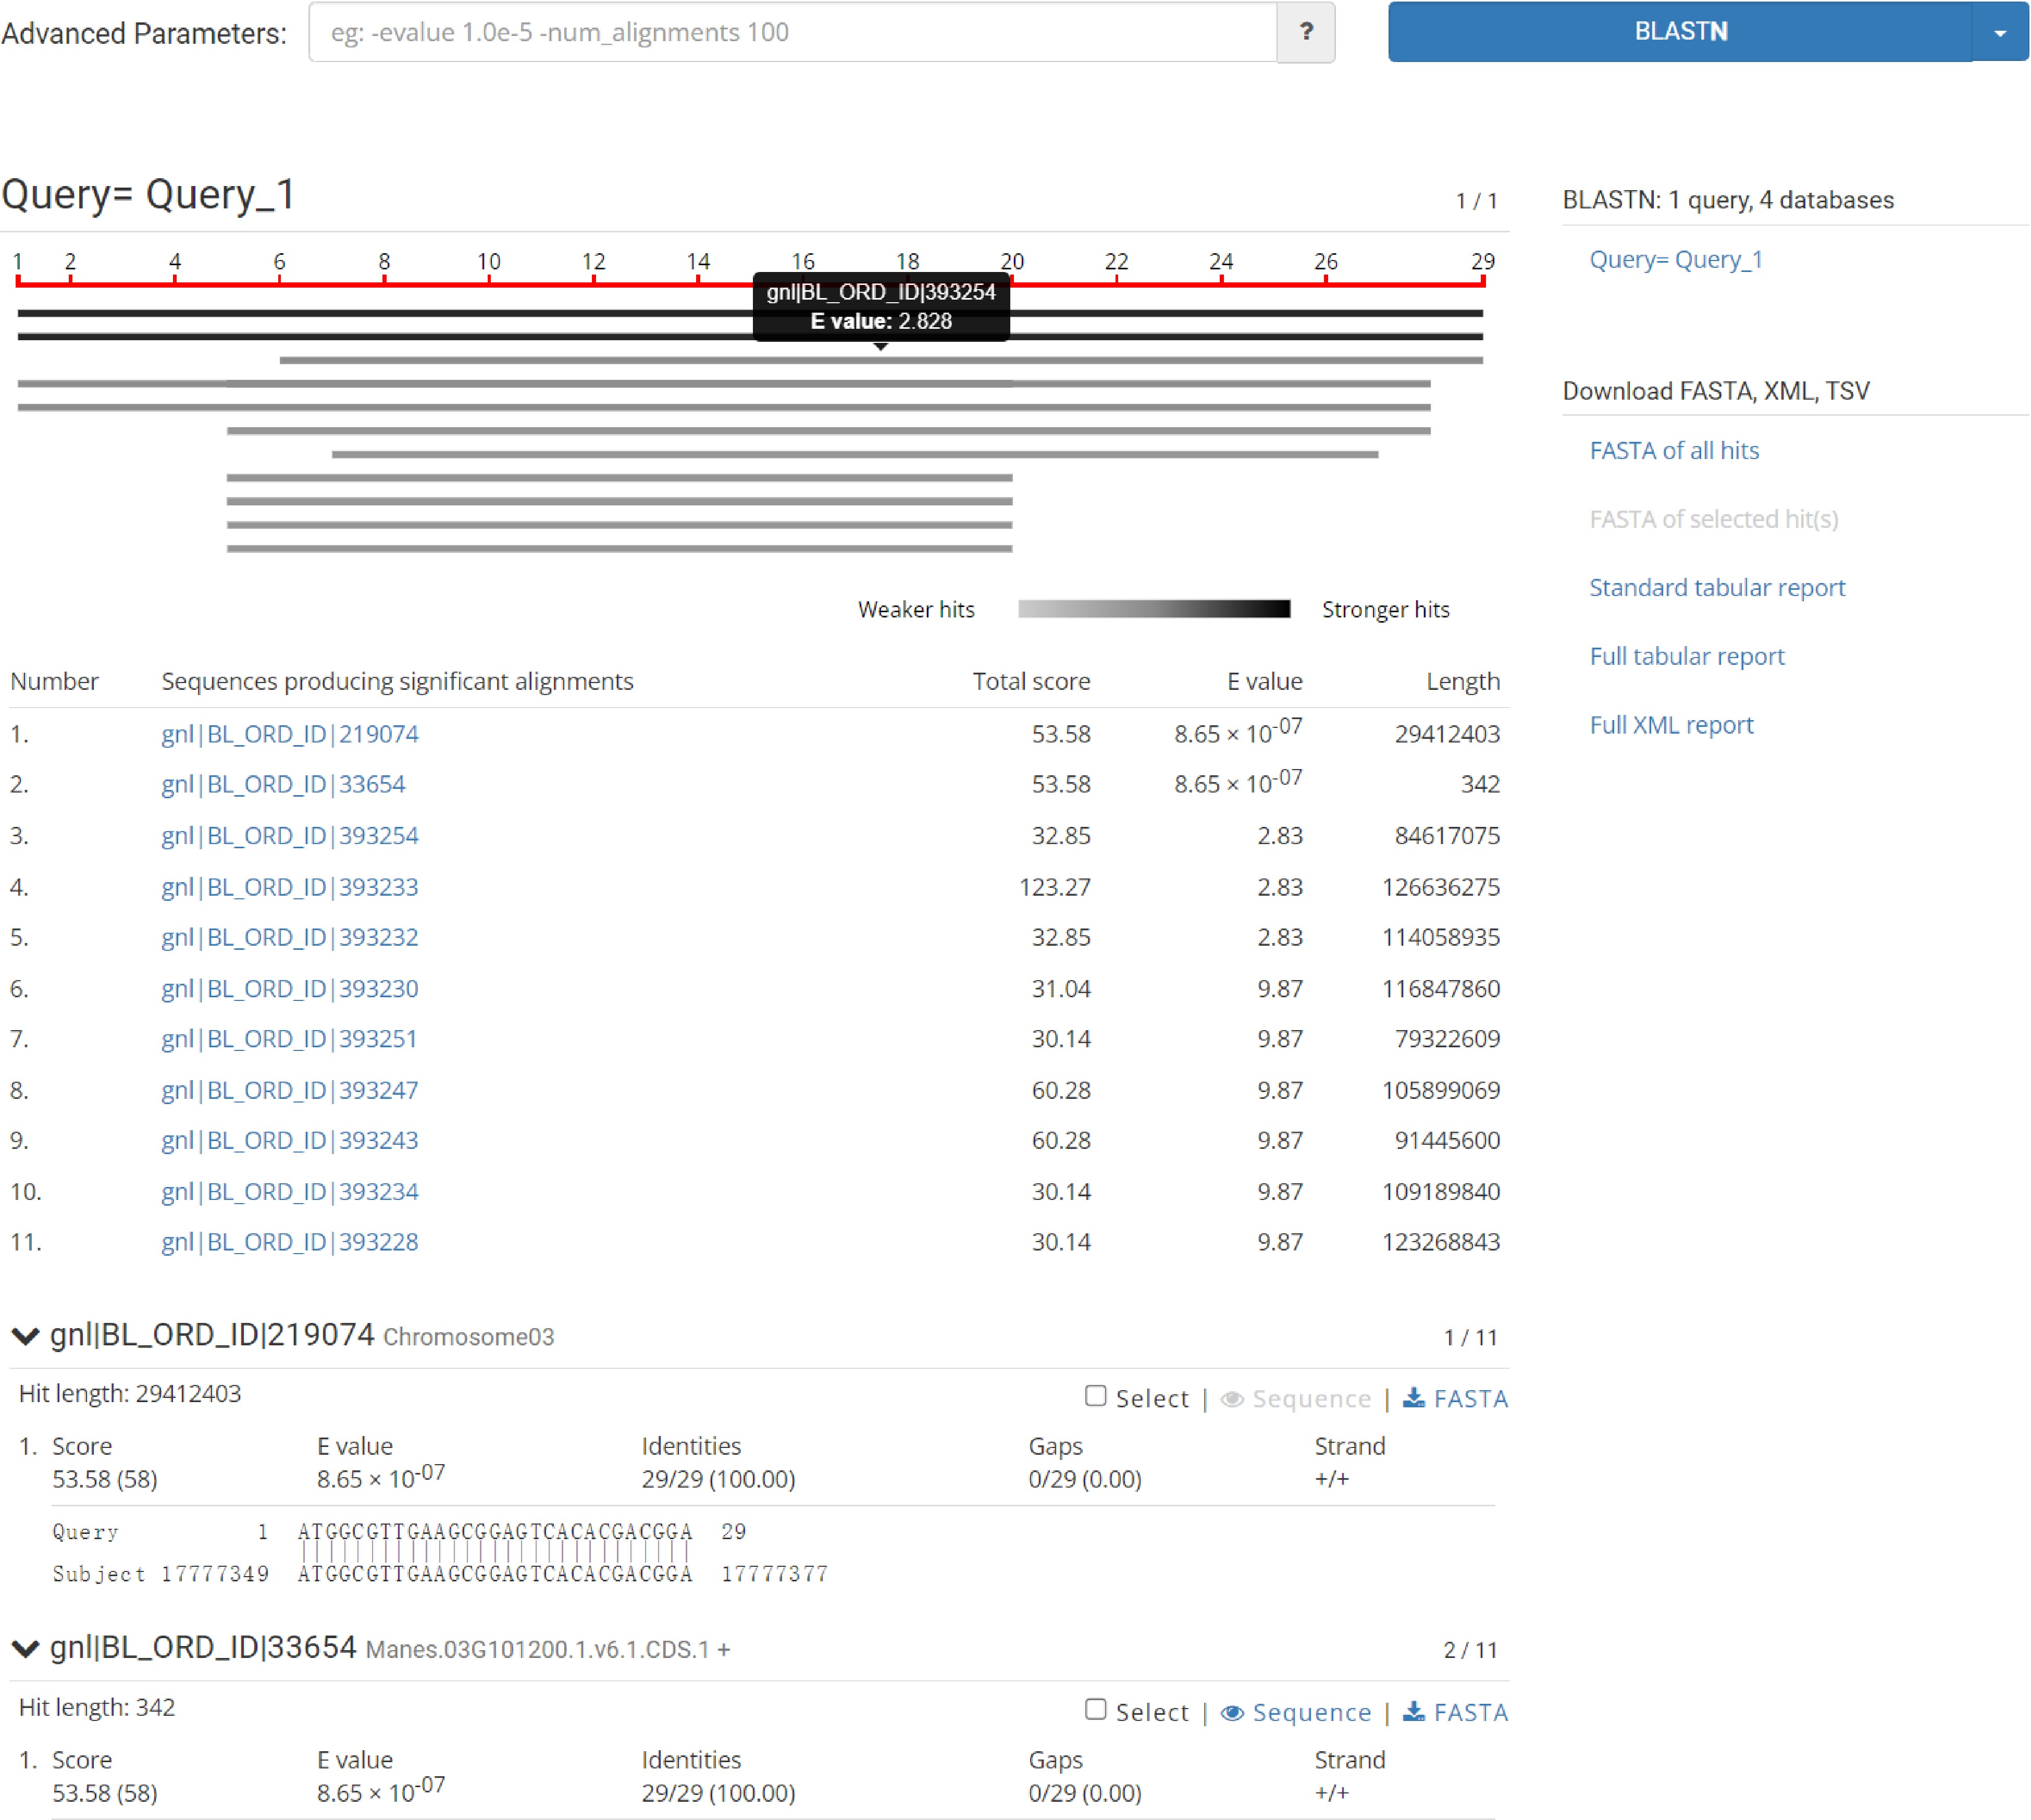
Figure 4.
BLAST sequence alignment interface.
-
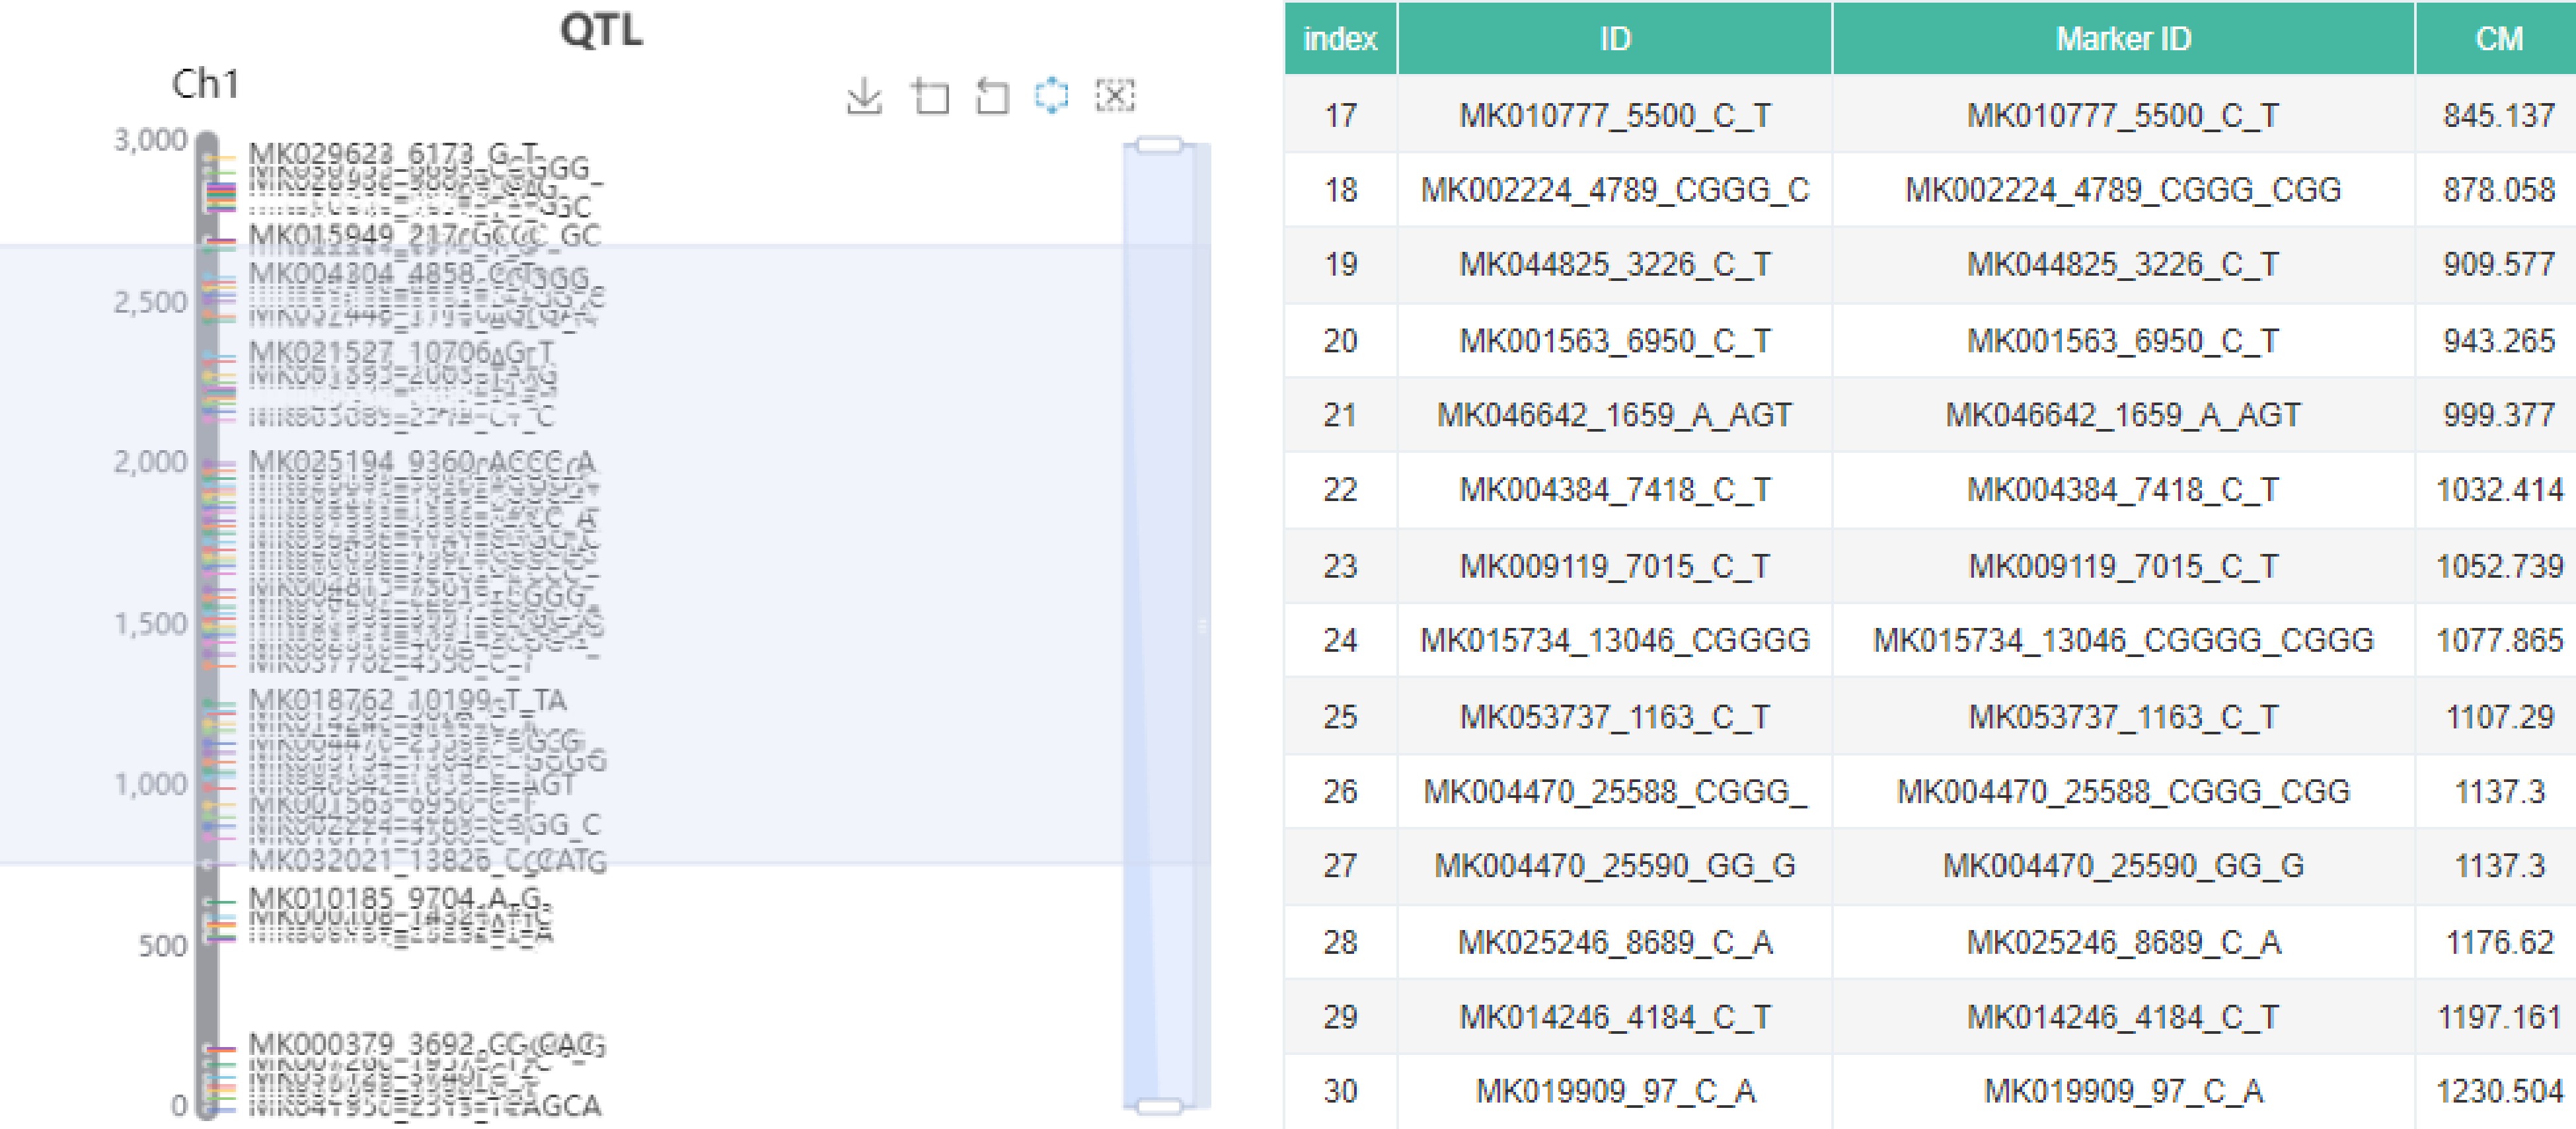
Figure 5.
QTL information of Manihot esculenta Crantz can be obtained by interactive genetic map.
-
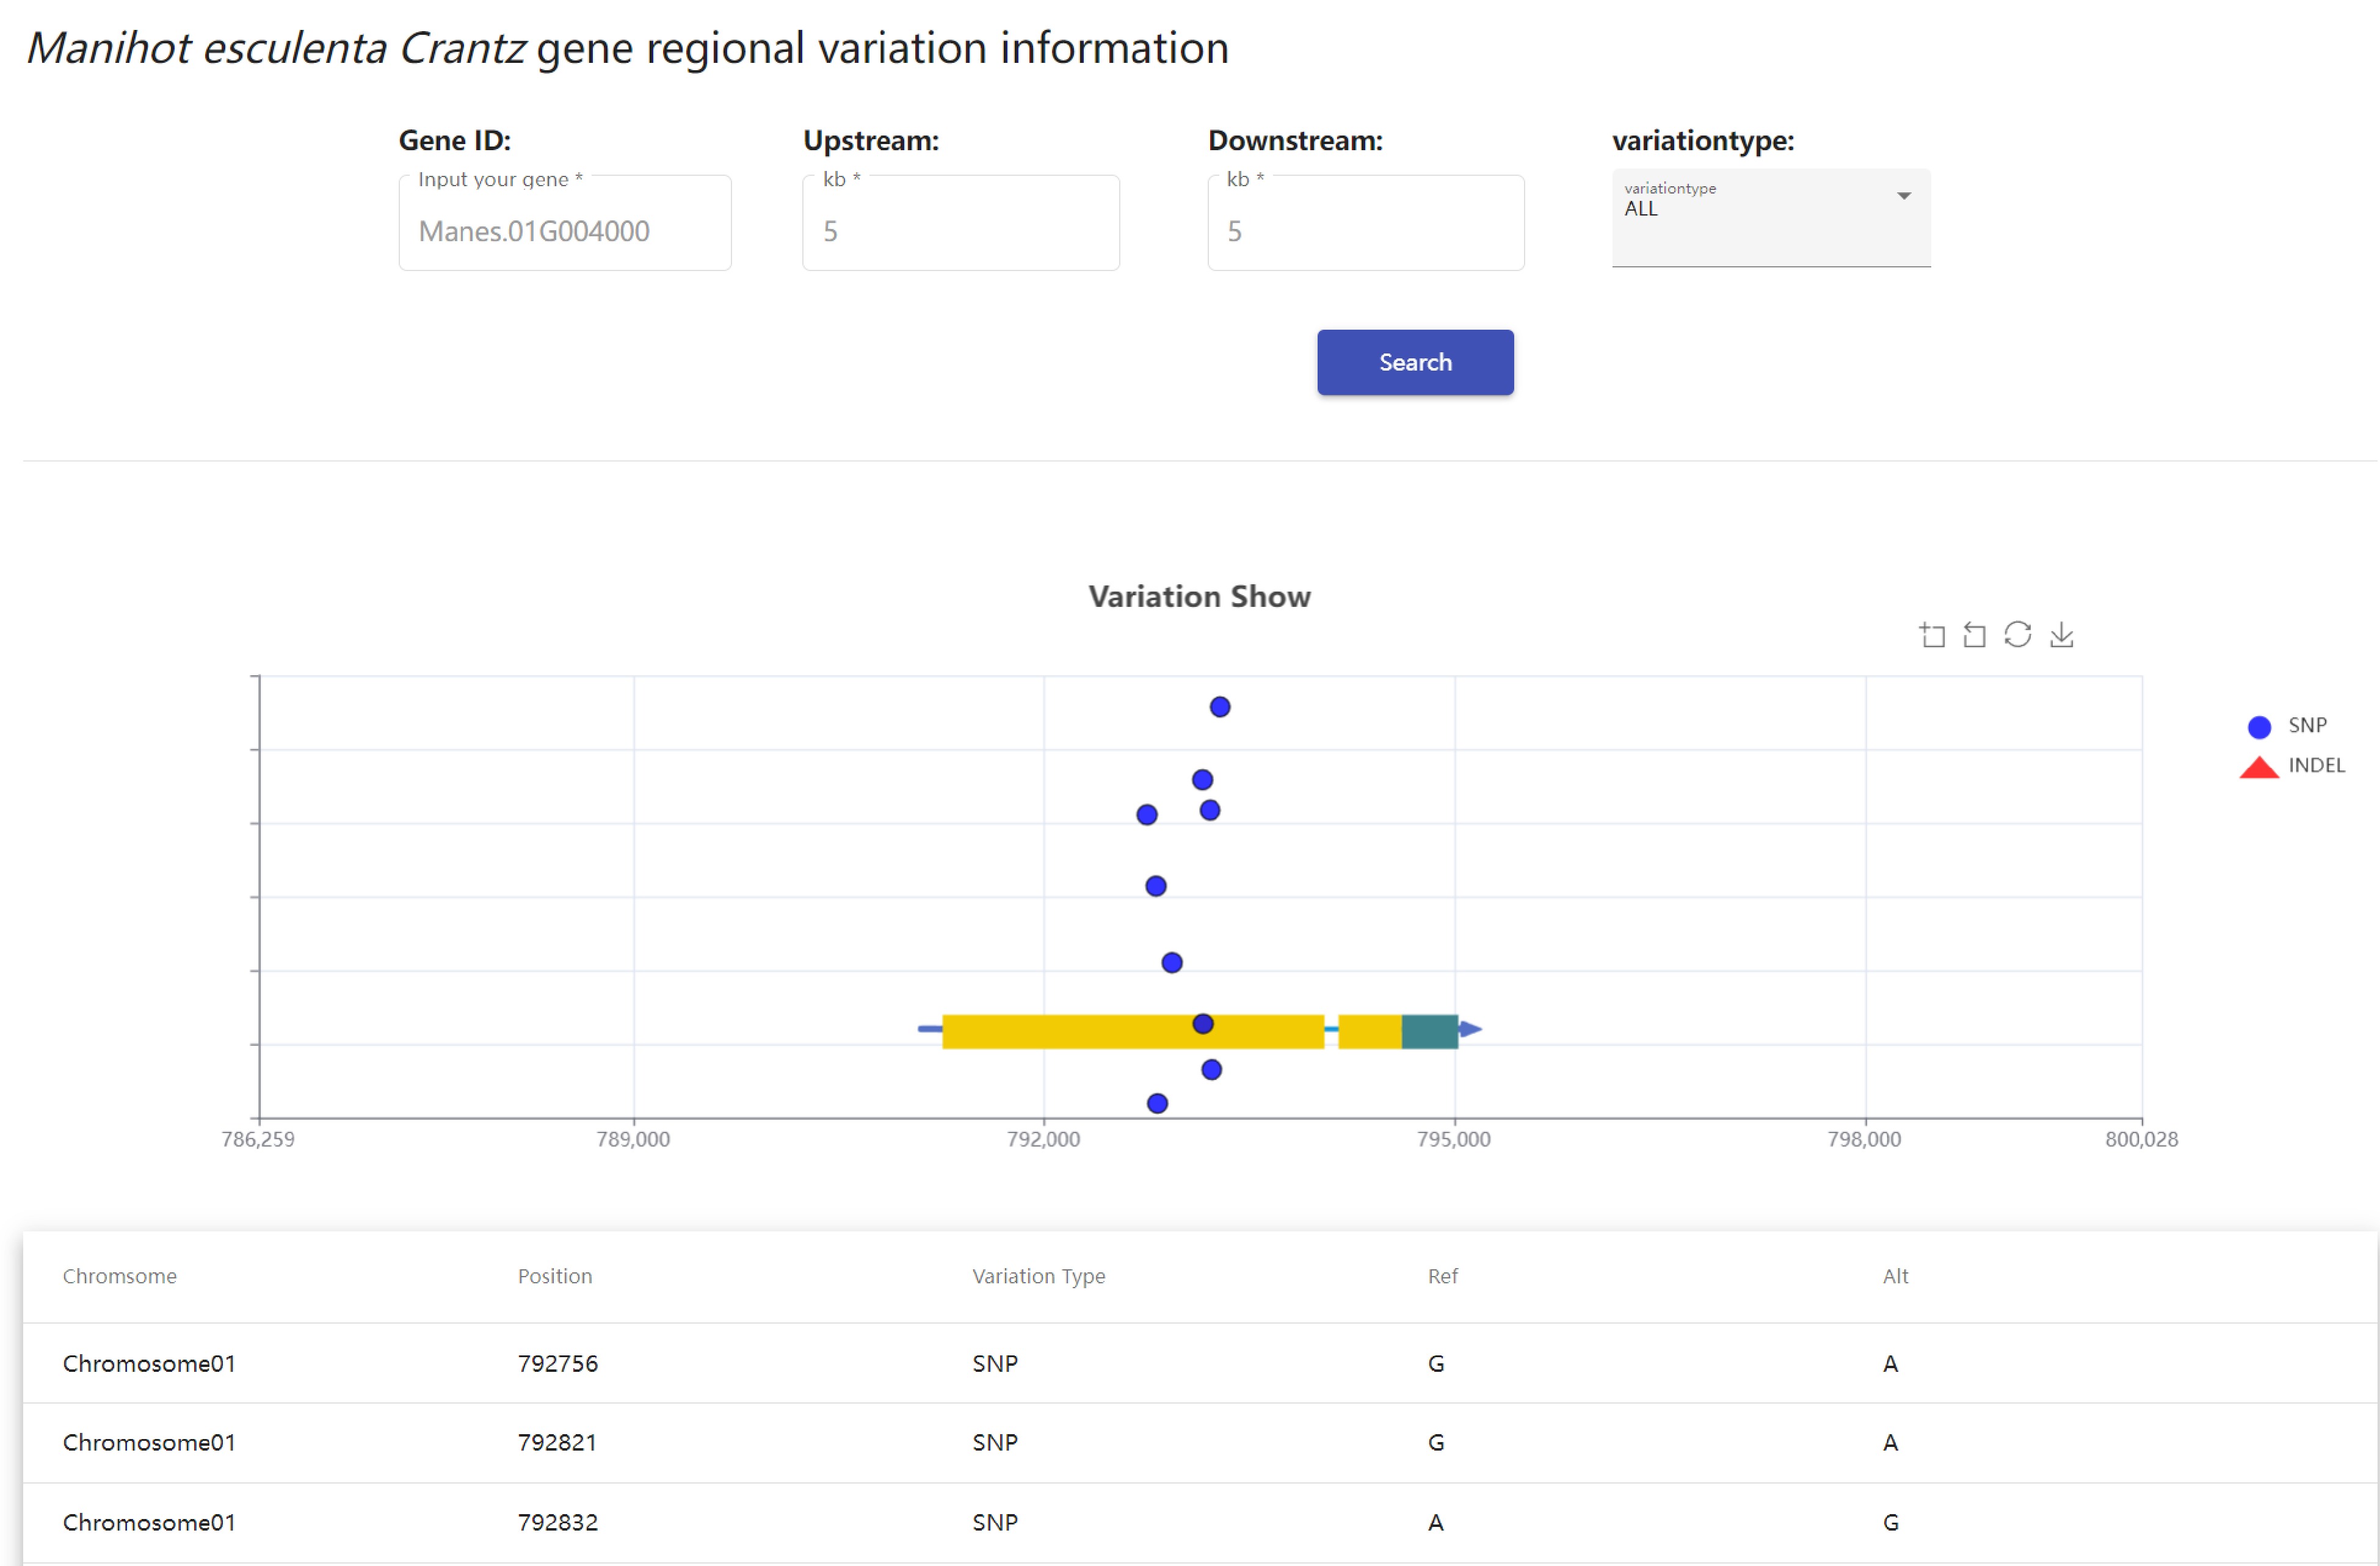
Figure 6.
Retrieval of SNP sites upstream and downstream of the gene 'Manes.01G004000'.
-
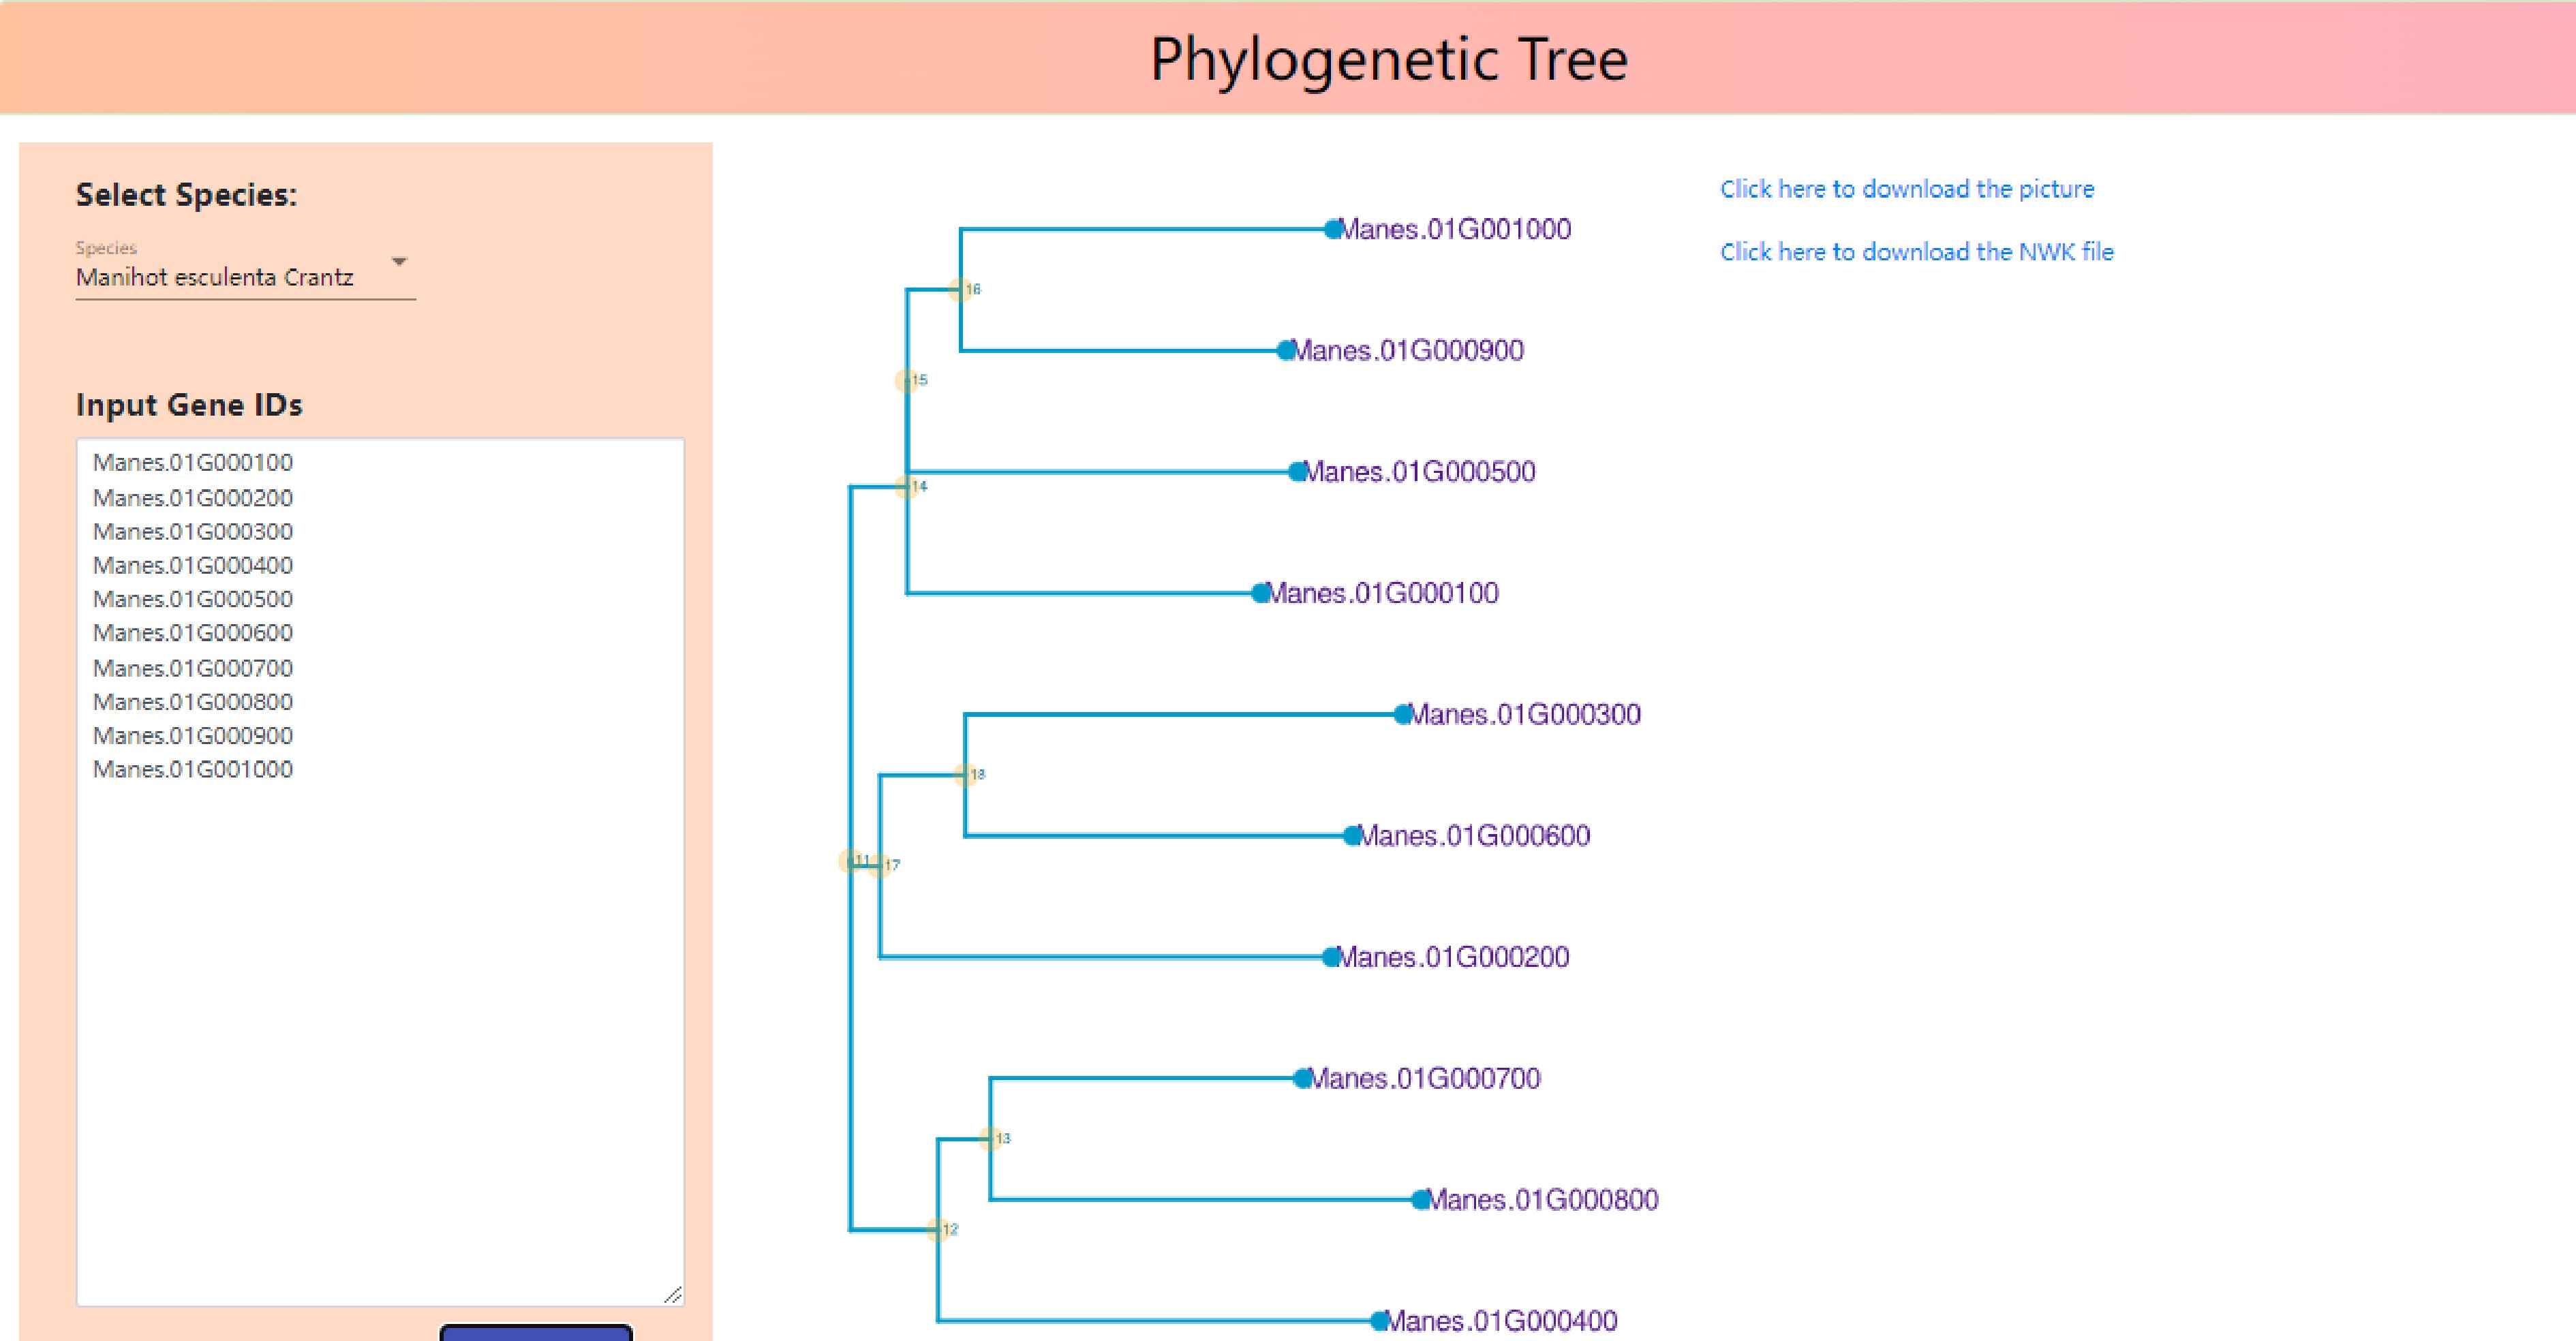
Figure 7.
Mapping phylogenetic trees based on genes of Manihot esculenta Crantz.
-
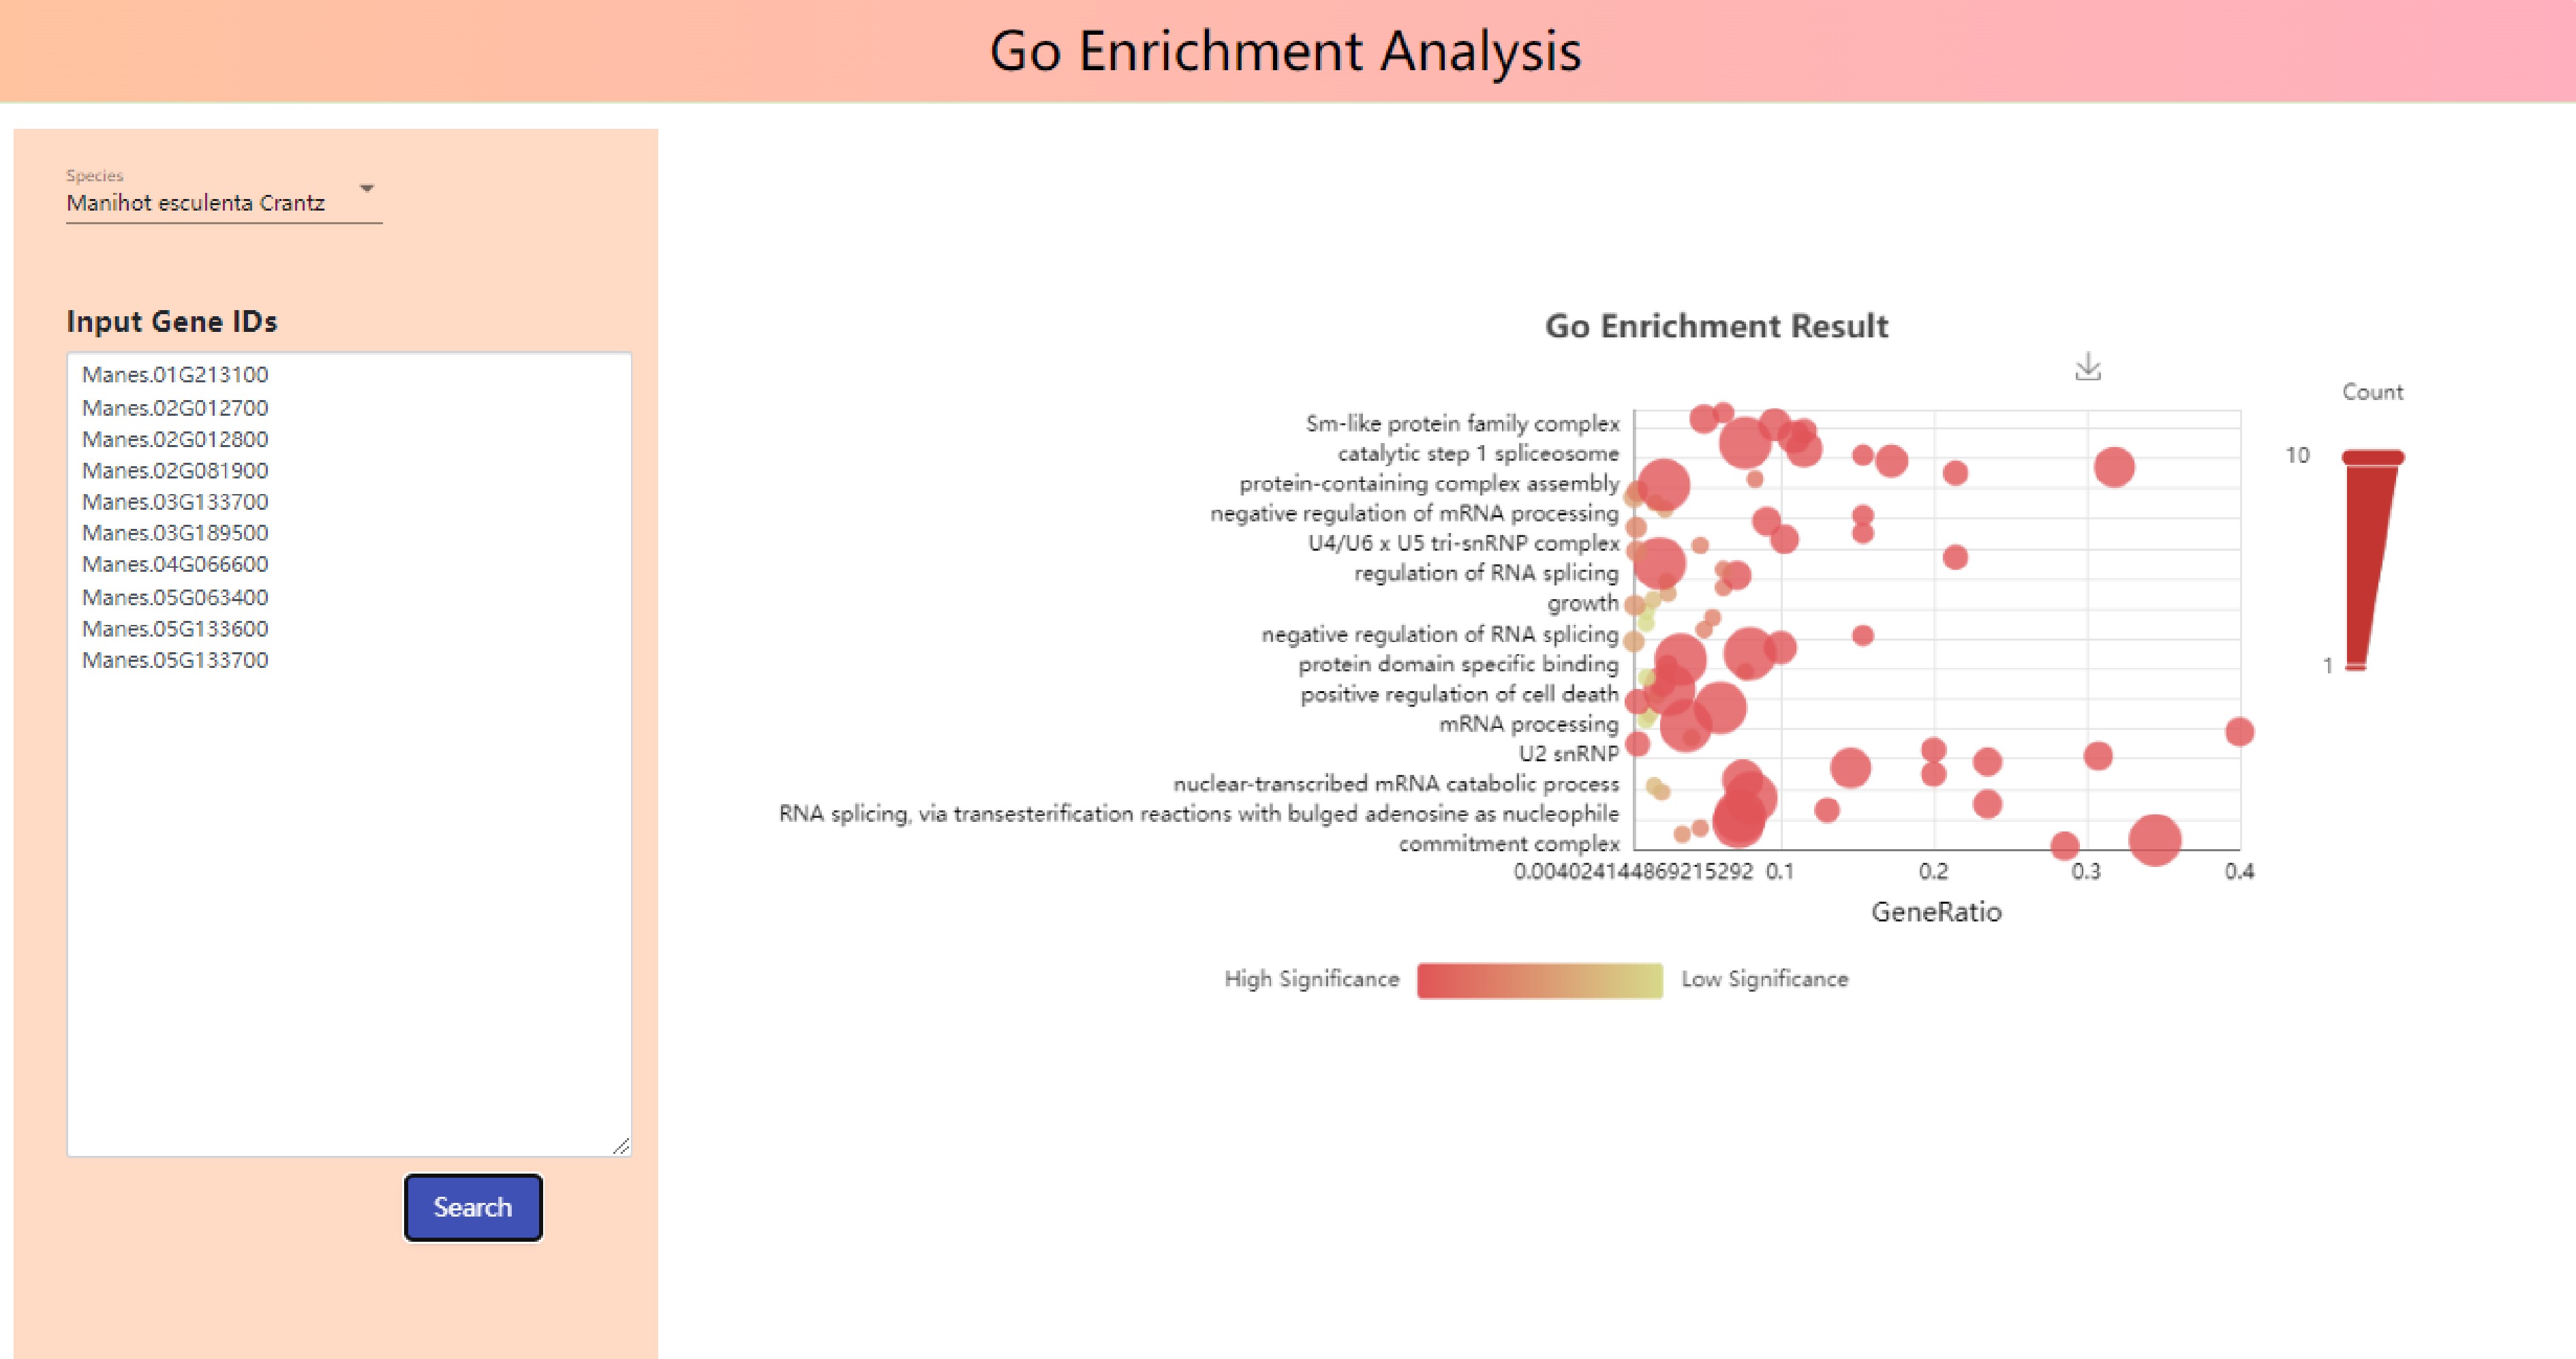
Figure 8.
GO enriched bubble map based on genes of Manihot esculenta Crantz.
-
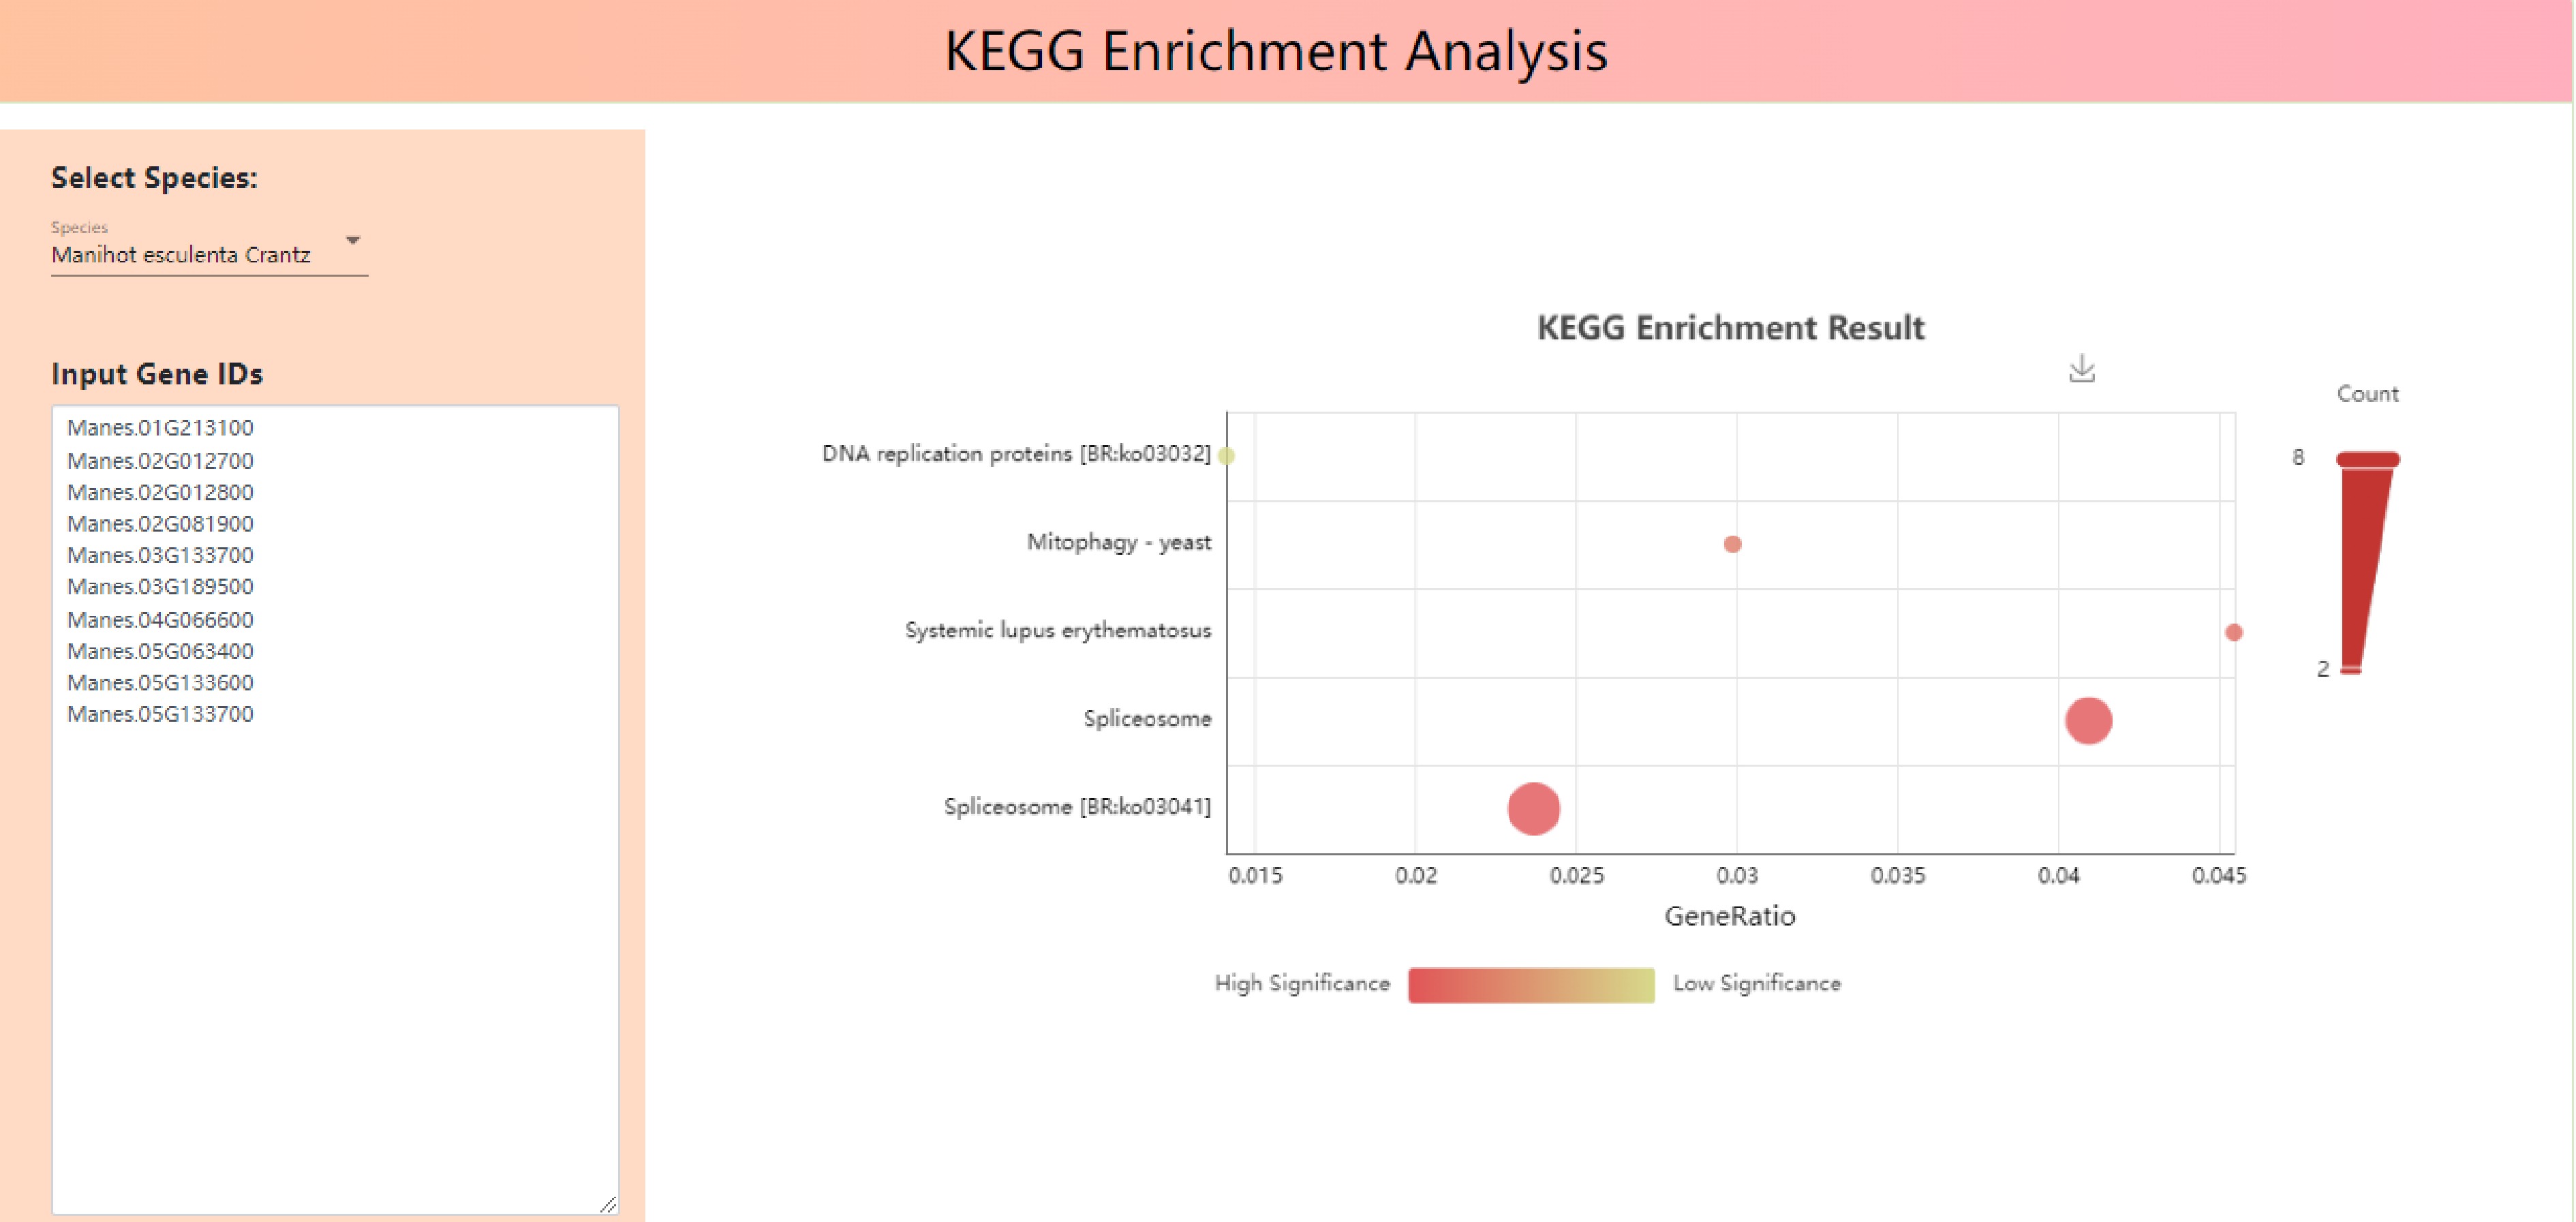
Figure 9.
Kegg enriched bubble map based on genes of Manihot esculenta Crantz.
-
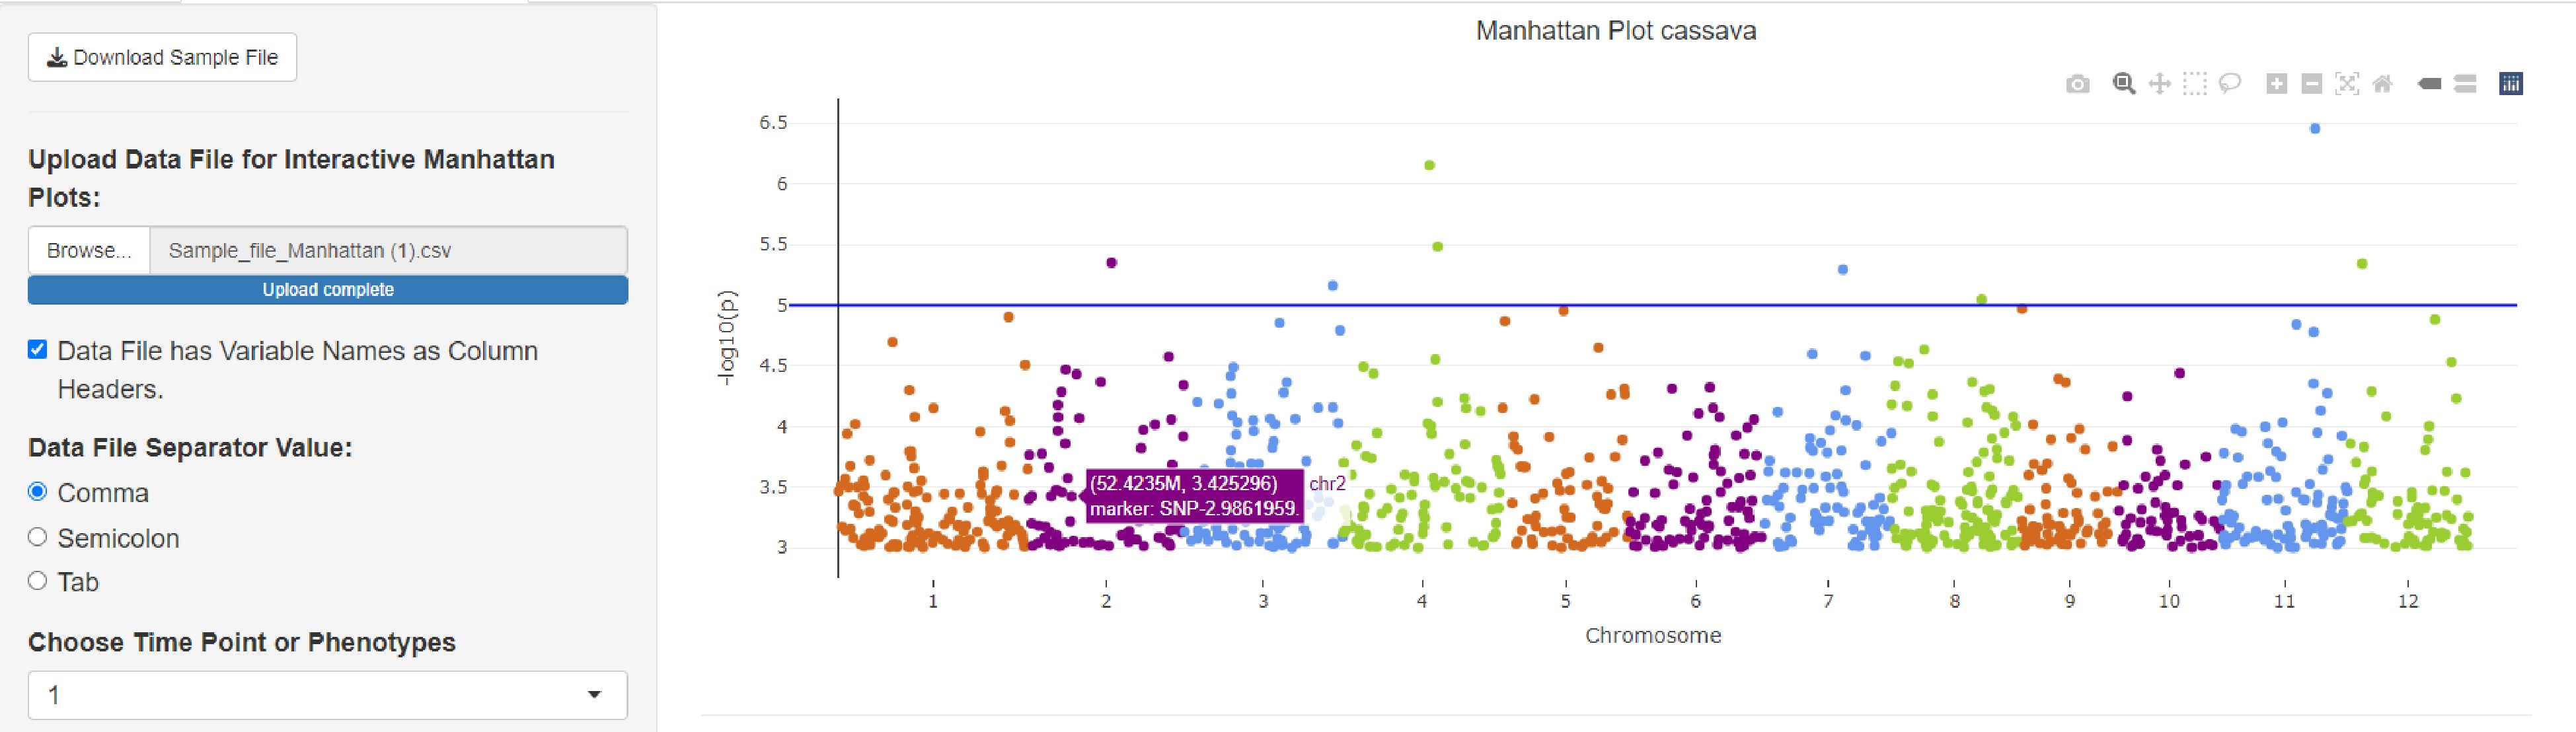
Figure 10.
Manhattan Plot according to the GWAS results.
-
Species QTLs Germplasms SNPs Genes Genetic maps Manihot esculenta Crantz 4,501 192 30,427 33,030 1 Saccharum officinarum L. — 292 44,969 112,787 — Ananas comosus — — — 31,585 — Mangifera indica L. 1,409 — — — 1 Hevea brasiliensis 6,940 — — 42,688 1 Table 1.
Overview of genetic, molecular and phenotypic data in TropCRD.
Figures
(10)
Tables
(1)