-
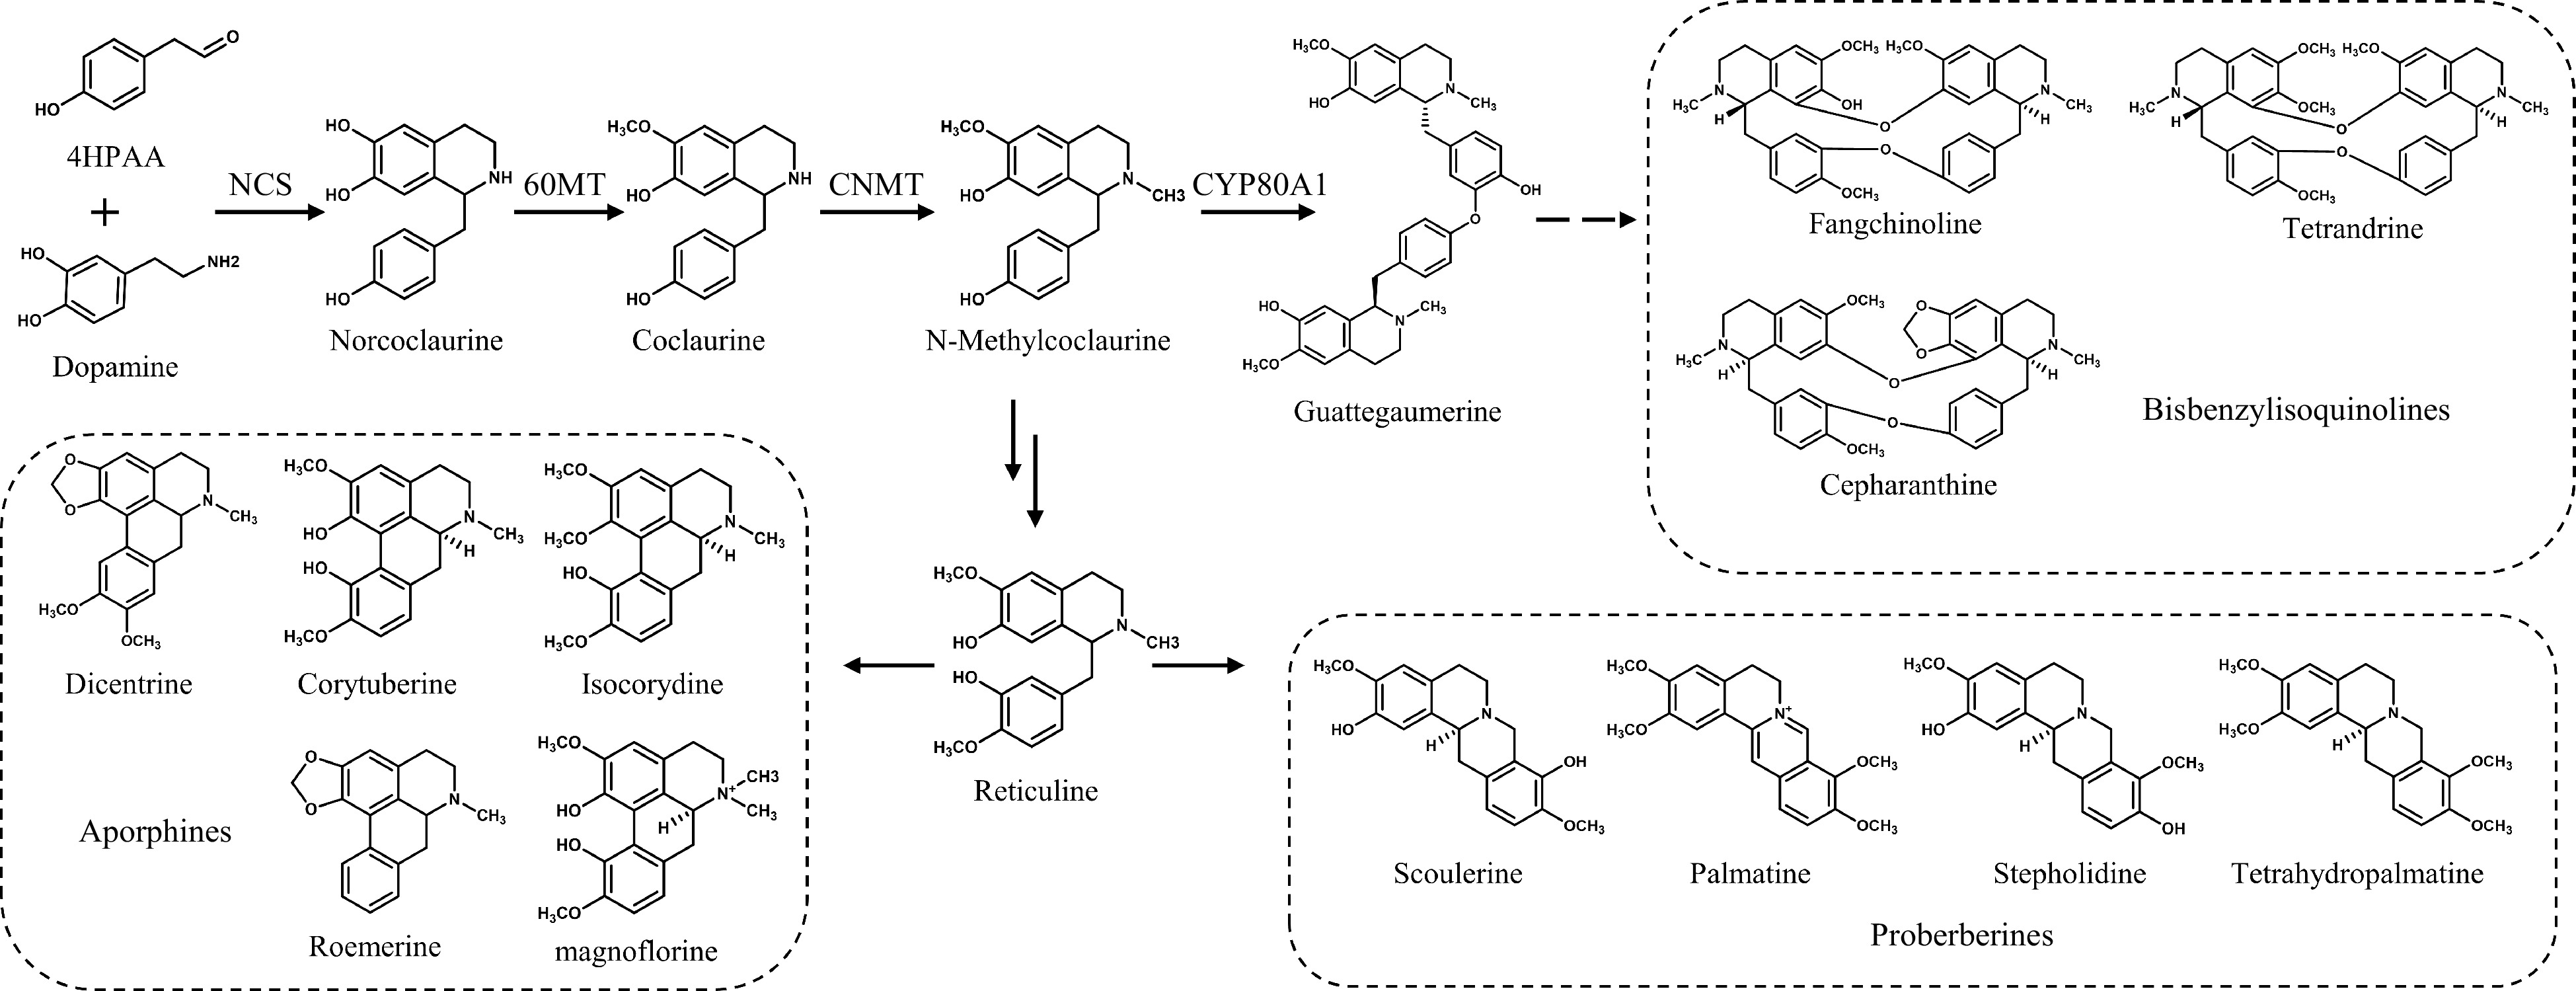
Figure 1.
BIAs in S. tetrandra and their biosynthetic pathways.
-

Figure 2.
A. rhizogenes-mediated hairy root induction system in S. tetrandra and the consequent hairy root growth. (a) Leaf explants, (b) calluses and (c) hairy roots that appeared from the calluses. (d) Hairy root culture on 1/2 MS solid medium and (e) in liquid medium. (f) Change in the growth status of hairy roots cultured in 1/2 MS liquid medium for 50 d. (g) Hairy root biomass growth curve. (h) Contents of alkaloids in the S. tetrandra hairy roots at different culture times. The bars showed standard deviation. The scale bar = 1,000 μm.
-

Figure 3.
Establishment of the hairy root genetic transformation system. (a)−(e) Hairy roots transformed by pCAMBIA1300-eGFP. (a) WT hairy root and (b) GFP fluorescence. (c) Transgenic hairy root and (d) GFP fluorescence. PCR analysis of (e) rol B, rolC, Vir D and eGFP in independent hairy roots transformed by pCAMBIA1300-EGFP. (f)−(j) Identification of CyOMT-7-overexpressing hairy roots and determination of the compounds contained within. (f) CyOMT-7-overexpressing hairy roots and (g) GFP fluorescence. (h) PCR analysis of rol B, rolC, eGFP and CyOMT-7 in CyOMT-7-overexpressing hairy roots. (i) Relative expression level of CyOMT-7 in control (hairy roots transformed by pCAMBIA1300-EGFP) and CyOMT-7-overexpressing hairy roots. (j) Contents of alkaloids in control and CyOMT-7-overexpressing hairy roots. Significant differences indicated at ** p < 0.01, when the means were compared with respective controls. The bars showed standard deviation. Scale bar = 1,000 μm.
-
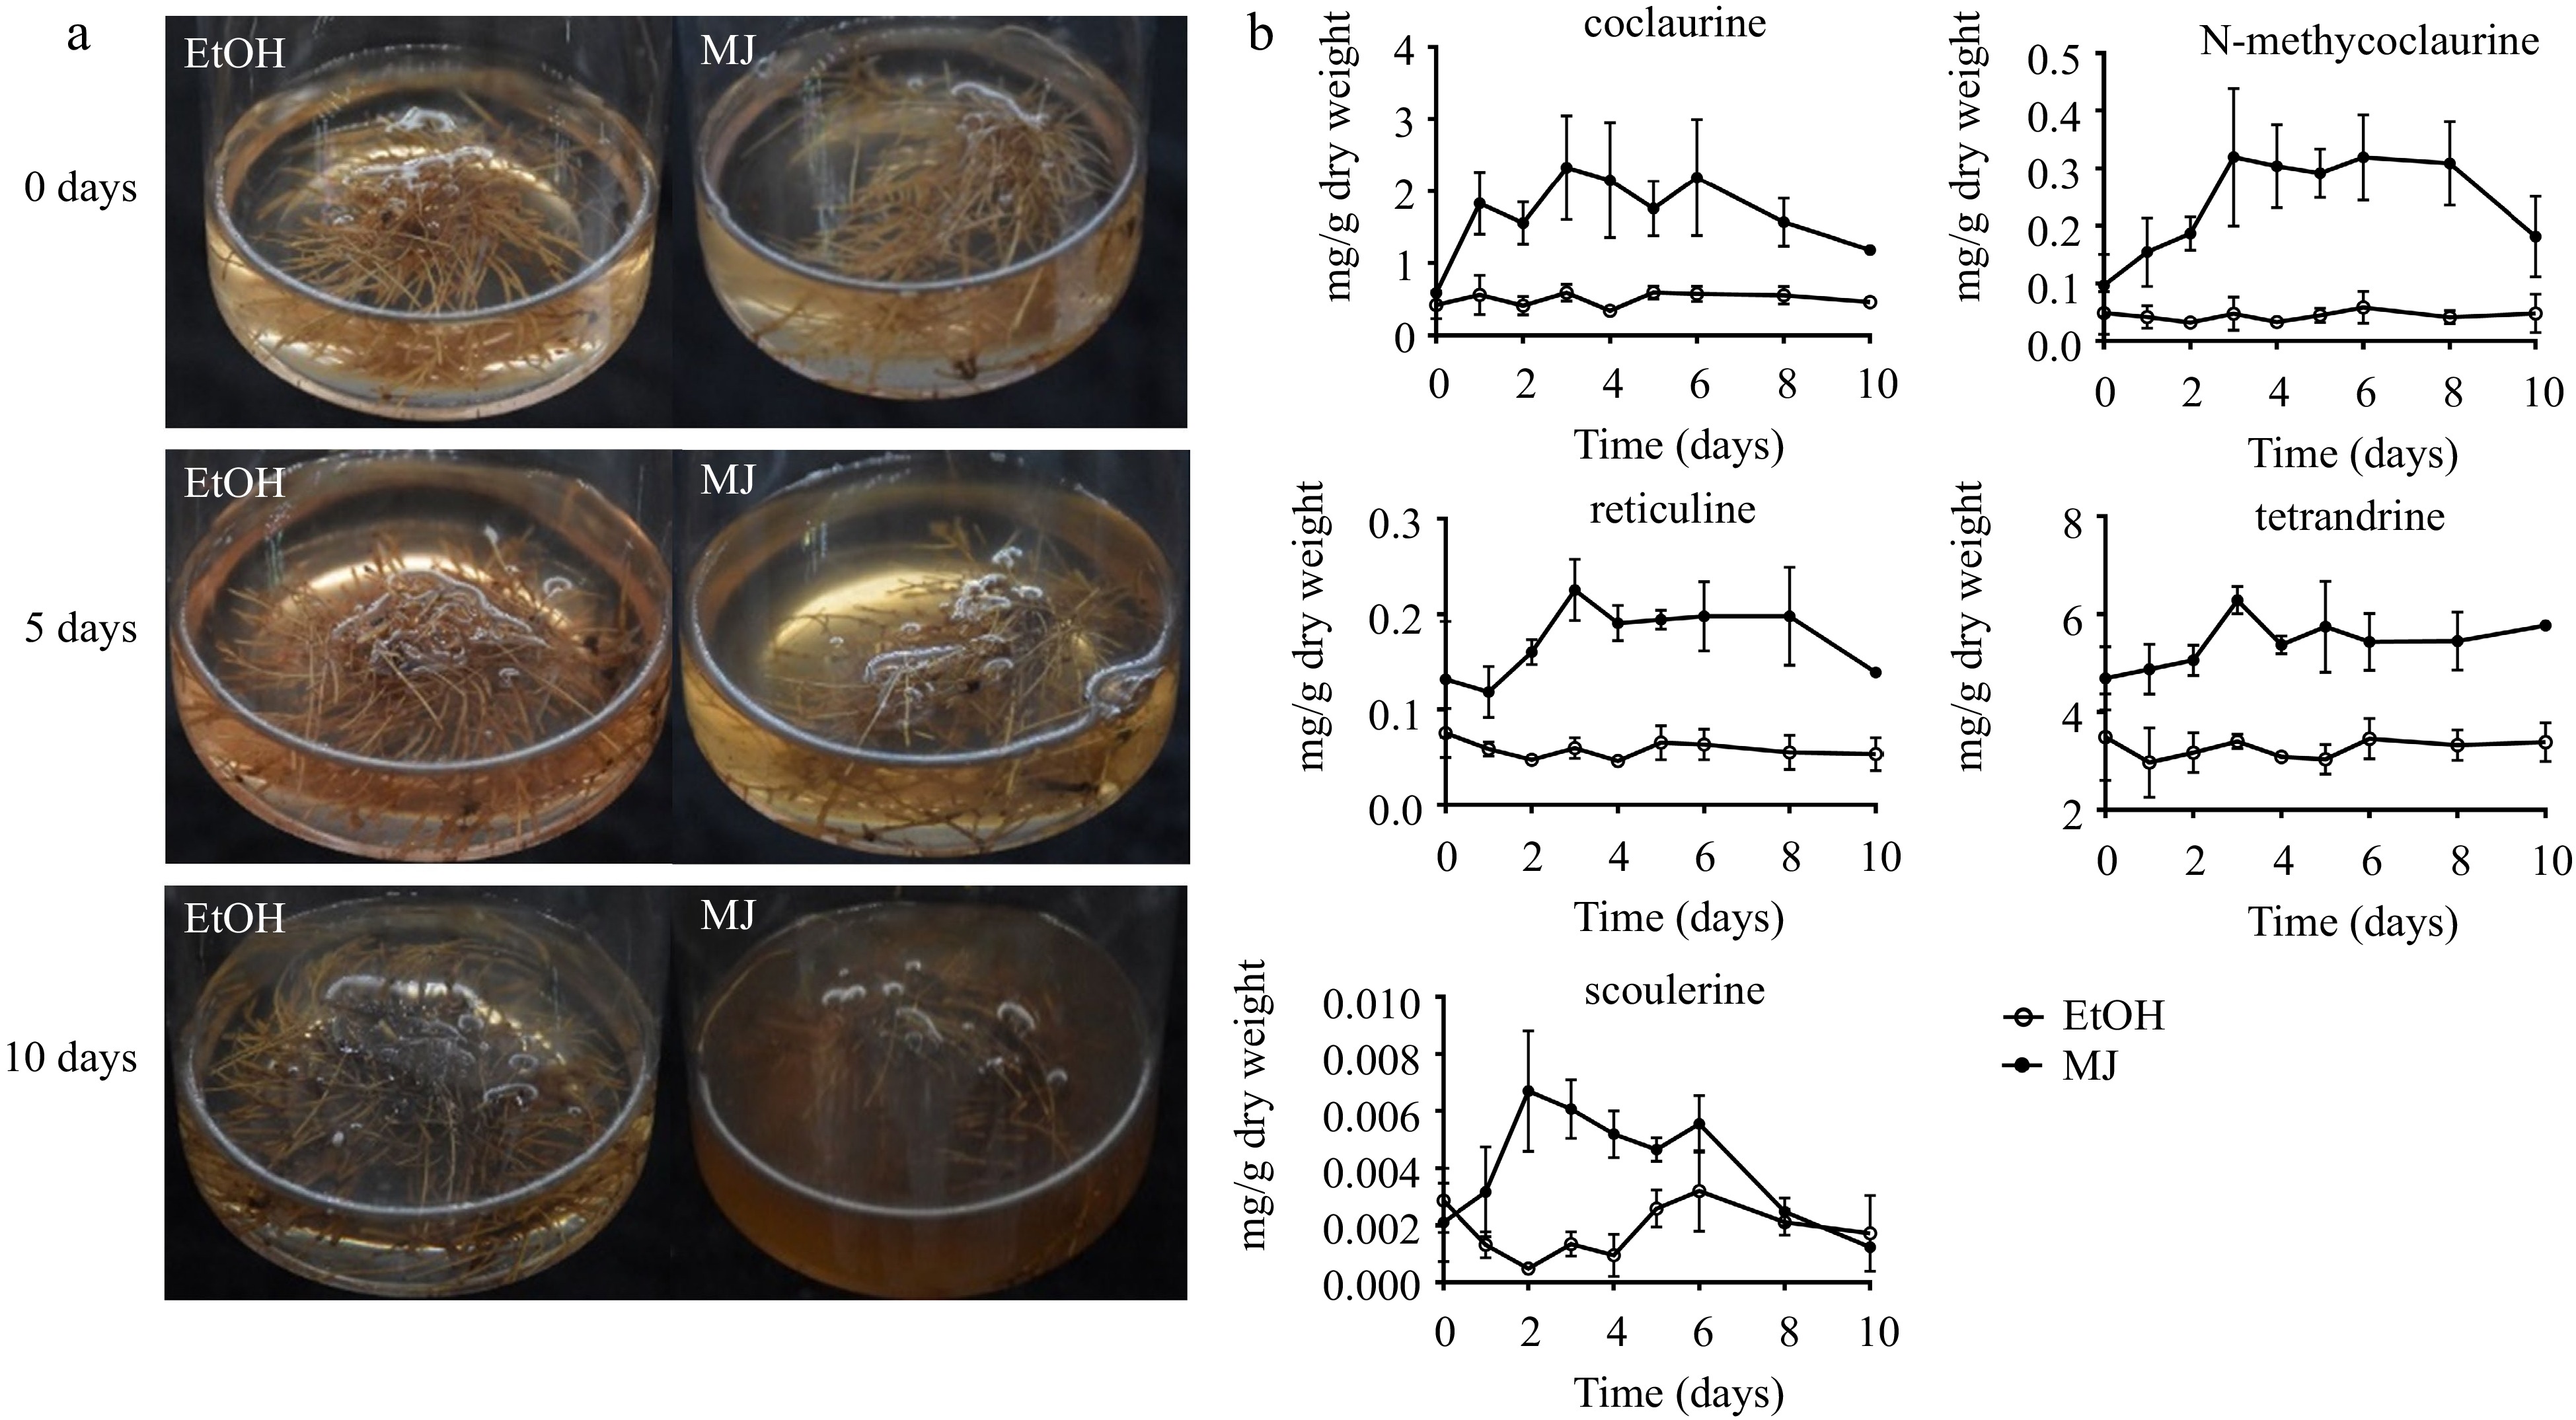
Figure 4.
S. tetrandra hairy root culture elicited with MJ. (a) Hairy roots were treated with ethyl alcohol (EtOH, control) or methyl jasmonate (MJ) for 0, 5 and 10 d. (b) Contents of alkaloids in hairy roots treated with MJ for 10 d. The bars showed standard deviation.
-

Figure 5.
Hairy root culture and genetic transformation of Stephania tetrandra S. Moore.
-
Gene Primer F (5'-3') Primer R (5'-3') rolB GCTCTTGCAGTGCTAGATTT GAAGGTGCAAGCTACCTCTC rolC CTCCTGACATCAAACTCGTC TGCTTCGACTTATGGGTACA virD ATGTCGCAAGGCAGTAAG CAAGGAGTCTTTCAGCATG eGFP CATGGTCCTGCTGGAGTTCGTG TGAAACTGATGCATTGAACT CyOMT7 TGATAGTAGGCTCGTTACT TTAAGGATAAGCCTCAATCA Table 1.
Primer sequences used for PCR analysis.
Figures
(5)
Tables
(1)