-

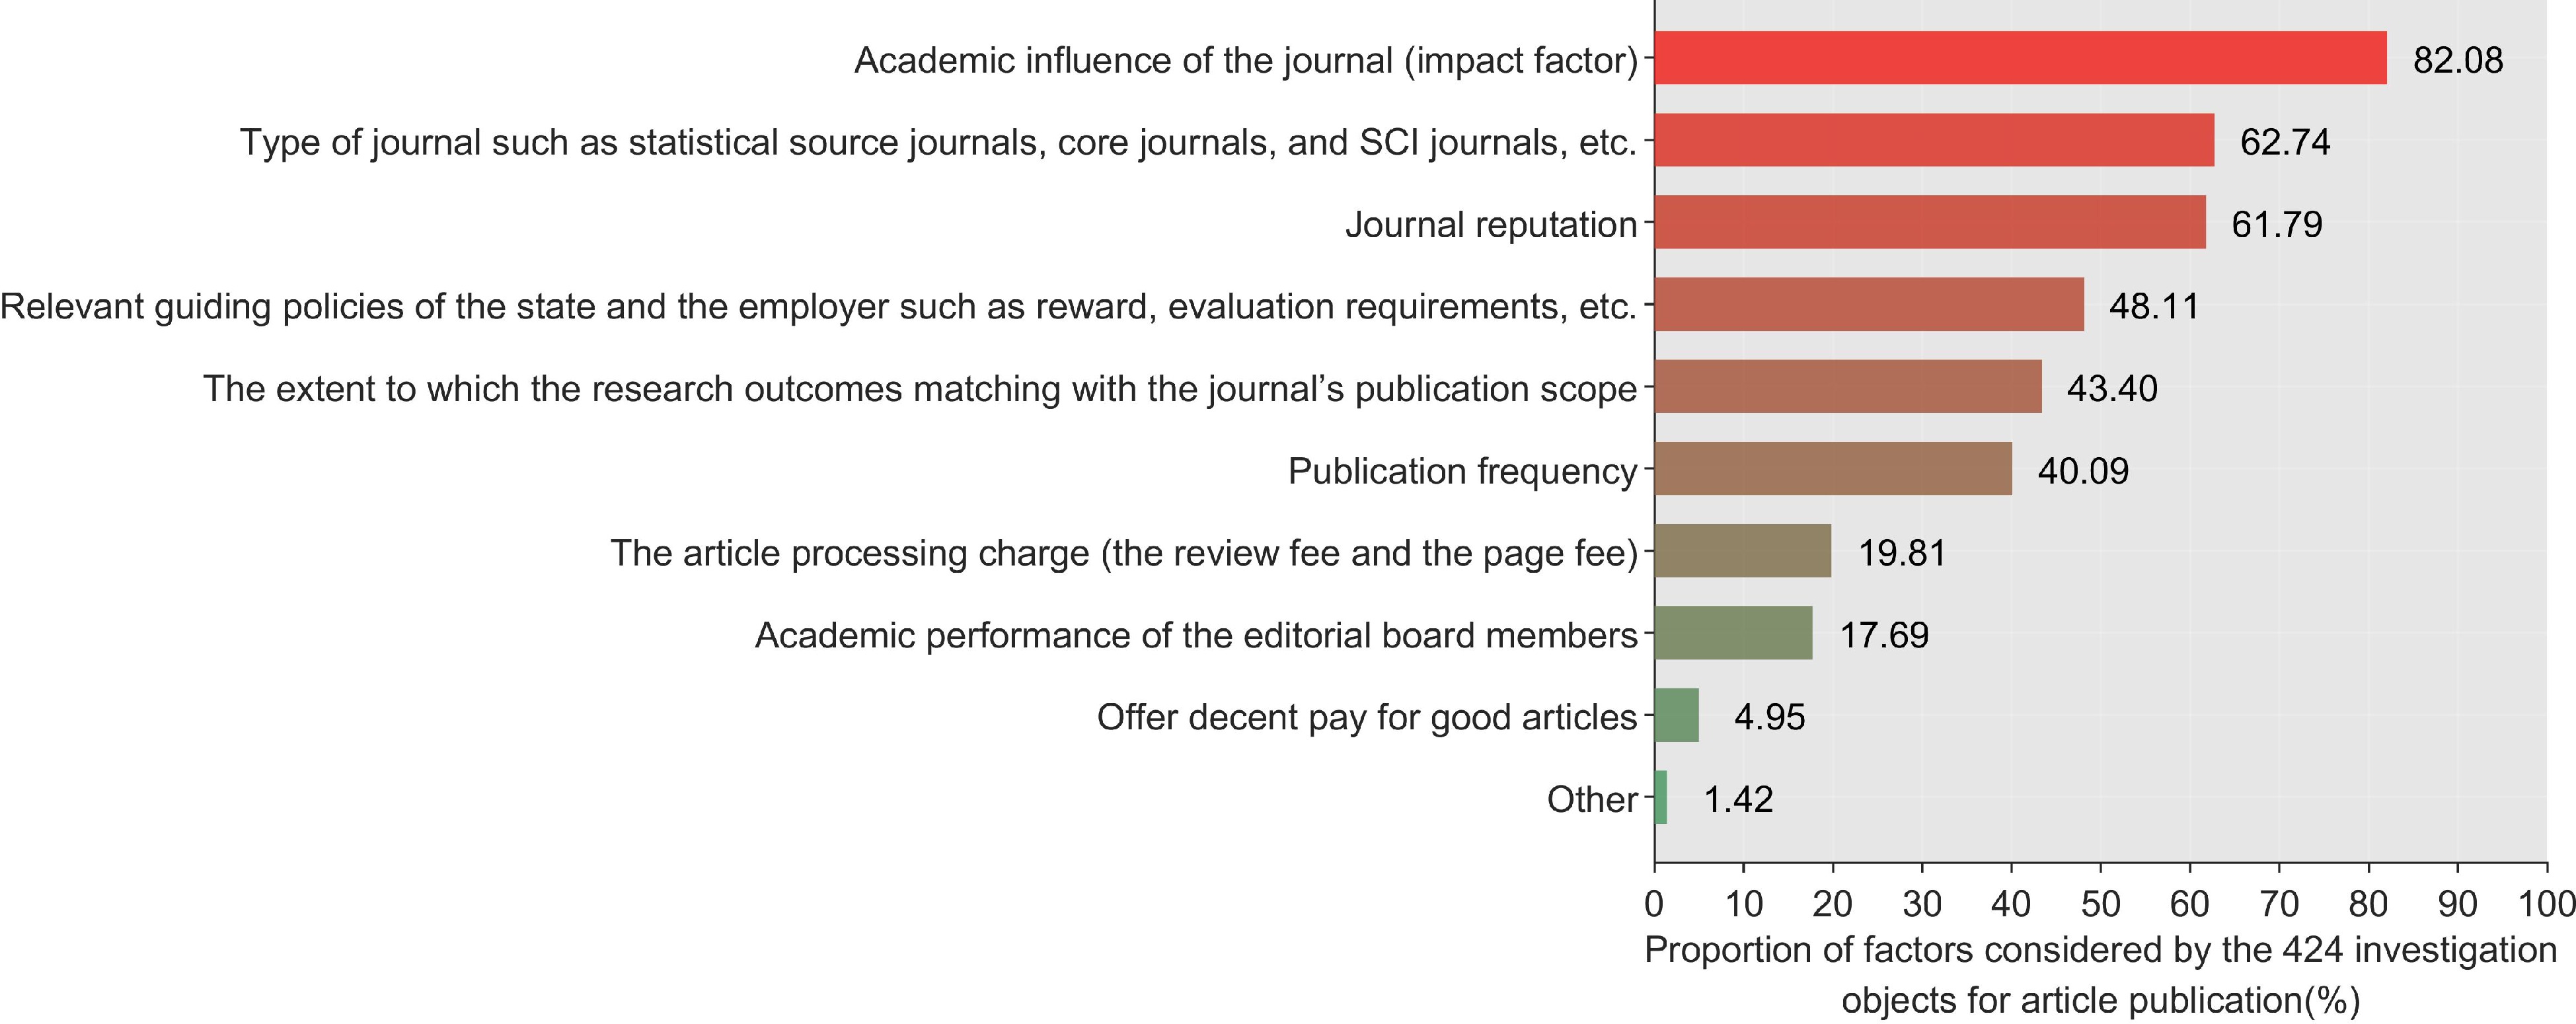
Figure 1.
Factors considered by the 424 respondents for article publication.
-

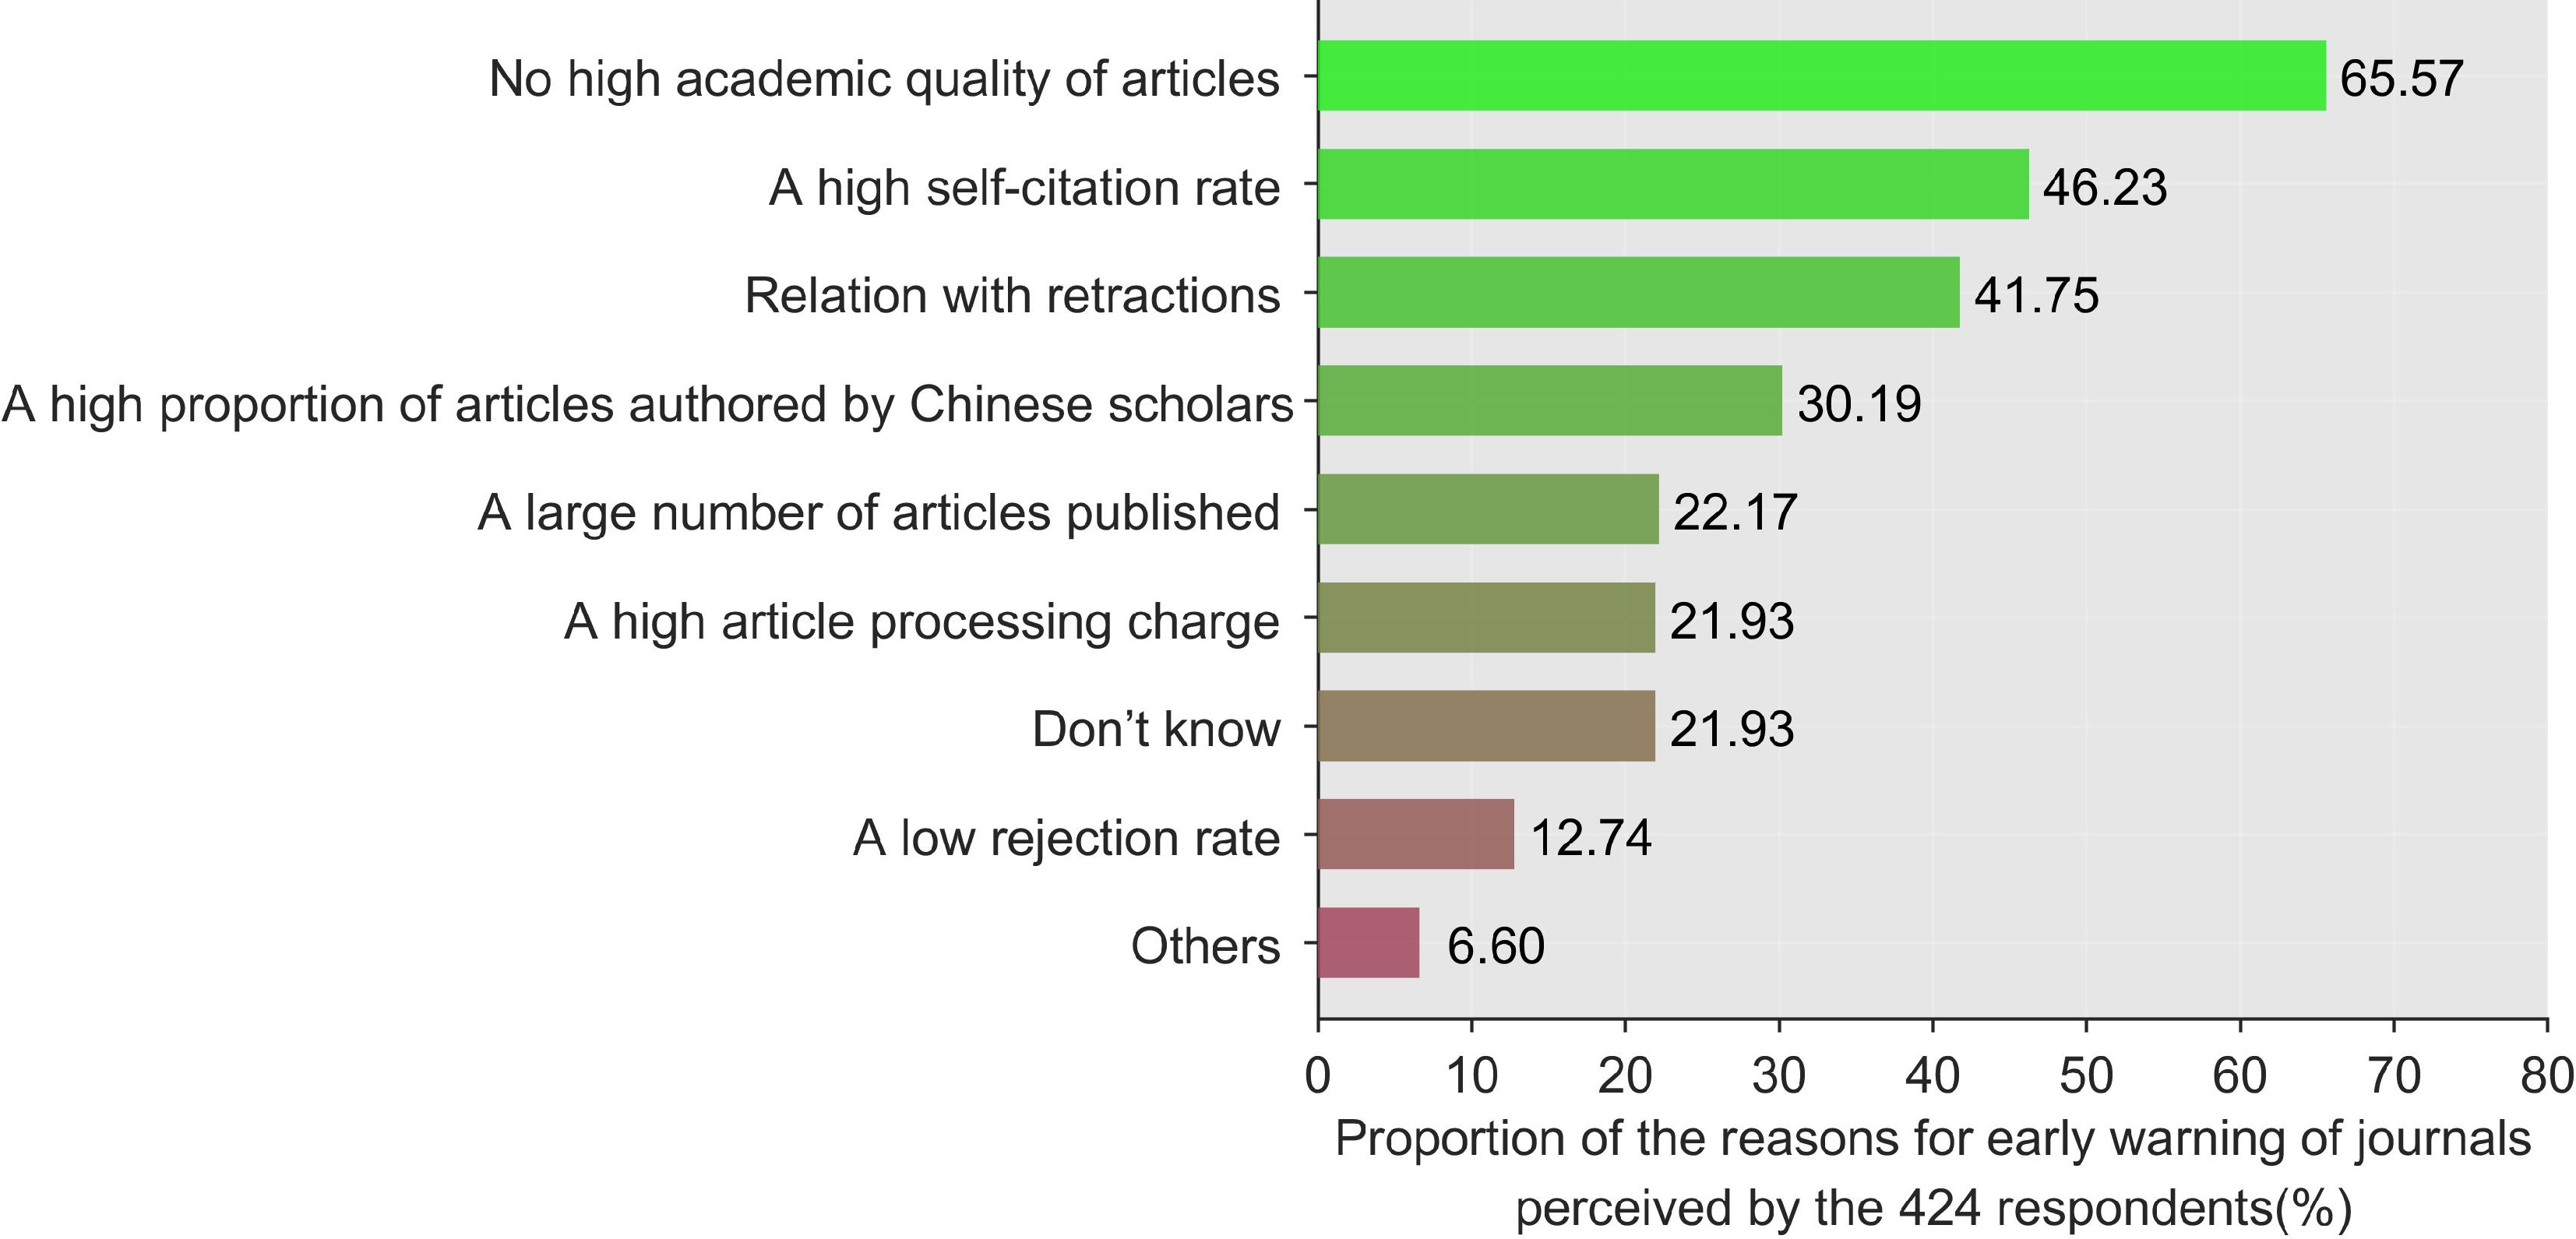
Figure 2.
Reasons for early warning of journals perceived by the 424 respondents.
-
Category Option Total High risk (n = 4) Medium risk (n = 18) Low risk (n = 4) X2/H P value JCR quartile Q1 4 0 3 1 3.888 0.692 Q2 10 1 7 2 Q3 6 1 5 0 Q4 6 2 3 1 CAS quartile Q2 3 0 2 1 5.096 0.278 Q3 9 0 7 2 Q4 14 4 9 1 Whether OA No 1 0 1 0 3.160 0.531 Optional 8 0 7 1 Yes 17 4 10 3 Publication cycle <12 editions/year 6 0 5 1 10.138 0.038 = 12 editions/year 17 3 13 1 >12 editions/year 3 1 0 2 2019 IF Med (P25−P75) 2.58(1.727−3.422) 0.902(1.88−2.656) 2.705 (1.997−3.713) 3.076(0.899−3.561) 4.343 0.114 5-year (2014−2018) IF Med (P25−P75) 2.42 (1.91−3.31) 1.59 (0.76−2.34) 2.71 (2.01−3.65) 2.84(0.83−3.41) 3.169 0.205 Global total number of articles published between 2016 and 2020 Med (P25−P75) 3 603.5
(1 134.5−7 006.25)7 760
(4 939.5−18 604.75)3 086.5
(858−5 088.5)5 438.5
(2 469−17 201.75)7.078 0.029 Proportion of articles authored by Chinese scholars between 2016 and 2020 Med (P25−P75) 74.3 (54.95−86.7) 83.97 (68.07−94.33) 74.94 (61.79−86.7) 37.53 (12.27−54.06) 9.004 0.011 2016-2020 Combined retraction rate Med (P25−P75) 0.33(0.08−0.71) 0.44(0.2−2.44) 0.33(0.06−0.61) 0.46(0.05−0.97) 1.152 0.562 5-year (2014−2018) self-citation rate Med (P25−P75) 0.03 (0.01−0.43) 0.03 (0.01−0.15) 0.03 (0.01−0.04) 0.03 (0.01−0.11) 0.446 0.800 2019 self-citation rate Med (P25−P75) 0.04 (0.02−0.07) 0.06 (0.04−0.21) 0.03 (0.02−0.05) 0.08 (0.04−0.16) 4.832 0.089 CAS is Chinese Academy of Sciences; The sample size of 2019 IF and self-citation rate are 26. The sample size of the 5-year (2014–2018) IF and the 5-year (2014–2018) self-citation rate are 25 during 2016 to 2020 M (P25, P75). Table 1.
Characteristics of the 26 SCI indexed medical journals at different risk levels.
-
Category Option Number (persons) Ratio (%) Awareness of the policy of early warning journals Don't know 86 20.3 Know but don’t understand 101 23.8 Know and understand a little bit 171 40.3 Know and understand a lot 66 15.6 Whether know the EWL or not Don’t know the EWL 98 23.1 Know the EWL but don’t know the specific journals 213 50.2 Know the EWL and know the journals on the list 113 26.7 Will EWL affect the article submission choice? No 54 12.7 Won’t consider the journals on the EWL at all 167 39.4 Yes, to some extent 203 47.9 The effect of EWL on boosting research integrity No effect 10 2.4 Obvious effect 166 39.2 Some effect 248 58.5 The effect of EWL on improving journal quality management No effect 4 0.9 Some effect 241 56.8 Obvious effect 179 42.2 The impact of EWL on the desire to publish research outcome No impact 114 26.9 Some impact 240 56.6 Obvious impact 70 16.5 The impact of EWL on selecting Chinese journals as the first choice No 63 14.9 Yes, will consider 317 74.8 Yes, first choice 44 10.4 EWL is Early Warning List. Table 2.
Understanding of the policy of early warning journals by the 424 respondents.
-
Journal name Warning level Number of articles published 2019 2020 2021 2022 Total Chinese scholars n(%) Total Chinese scholars n(%) Total Chinese scholars n(%) Total Chinese scholars n(%) European Review for Medical and Pharmacological Sciences High 1375 1129(82%) 1614 1221(76%) 1001 380(38%) 1186 313(26%) International Journal of Clinical and Experimental Pathology High 514 468(91%) 384 336(88%) – – – – Medicine High 4689 2897(62%) 5292 3537(67%) 4583 2689(59%) 4079 2132(52%) International Journal of Clinical and Experimental Medicine High 1703 1643(96%) 1222 1185(97%) – – – – Biomedicine & Pharmacotherapy Medium 1431 987(69%) 1338 995(74%) 1603 700(44%) 1422 701(49%) Experimental and Molecular Pathology Medium 122 60(49%) 174 88(51%) 114 51(45%) 74 31(42%) Brazilian Journal of Medical and Biological Research Medium 150 79(53%) 148 90(61%) 184 82(45%) 108 23(21%) Cancer Biomarkers Medium 149 113(76%) 163 119(73%) 130 82(63%) 147 70(48%) International Journal of Immunopathology and Pharmacology Medium 64 27(42%) 69 37(54%) 114 38(33%) 90 35(39%) Oncology Research Medium 117 111(95%) 95 74(78%) 36 22(61%) 16 8(50%) American Journal of Cancer Research Medium 206 152(74%) 320 222(69%) 400 220(55%) 380 225(59%) Medical Science Monitor Medium 1126 996(88%) 982 895(91%) 535 412(77%) 352 219(62%) Oncology Letters Medium 1509 1178(78%) 1196 924(77%) 845 573(68%) 466 252(54%) Experimental and Therapeutic Medicine Medium 1271 1069(84%) 1261 989(78%) 1485 1058(71%) 757 479(63%) OncoTargets and Therapy Medium 1075 960(89%) 1170 1057(90%) 521 391(75%) 191 61(32%) Oncology Reports Medium 608 440(72%) 436 332(76%) 378 229(61%) 219 74(34%) Molecular Medicine Reports Medium 1172 1066(91%) 846 740(87%) 876 721(82%) 370 248(67%) International Journal of Molecular Medicine Medium 455 351(77%) 379 303(80%) 288 231(80%) 147 80(54%) Journal of International Medical ReSearch Medium 888 685(77%) 1271 1026(81%) 995 759(76%) 596 333(56%) American Journal of Translational Research Medium 636 576(91%) 644 589(91%) 1479 1391(94%) 752 672(89%) Journal of Biomaterials and Tissue Engineering Medium 259 236(91%) 280 270(96%) 346 334(97%) 326 310(95%) Aging-US Medium 889 546(61%) 1620 1252(77%) 1580 1272(81%) 658 441(67%) LIFE SCIENCES Low 908 484(53%) 1300 713(55%) 1320 576(44%) 817 208(25%) Journal of Clinical Medicine Low 2230 31(1%) 4133 39(1%) 5986 67(1%) 7535 517(7%) International Journal of Environmental Research and Public Health Low 5164 1376(27%) 9594 1728(18%) 13429 1857(14%) 17089 4099(24%) Acta Medica Mediterranea Low 555 409(74%) 607 485(80%) 629 505(80%) 623 555(89%) Table 3.
Data of Published articles in 26 warning medical journals from 2019 to 2022.
Figures
(2)
Tables
(3)