-
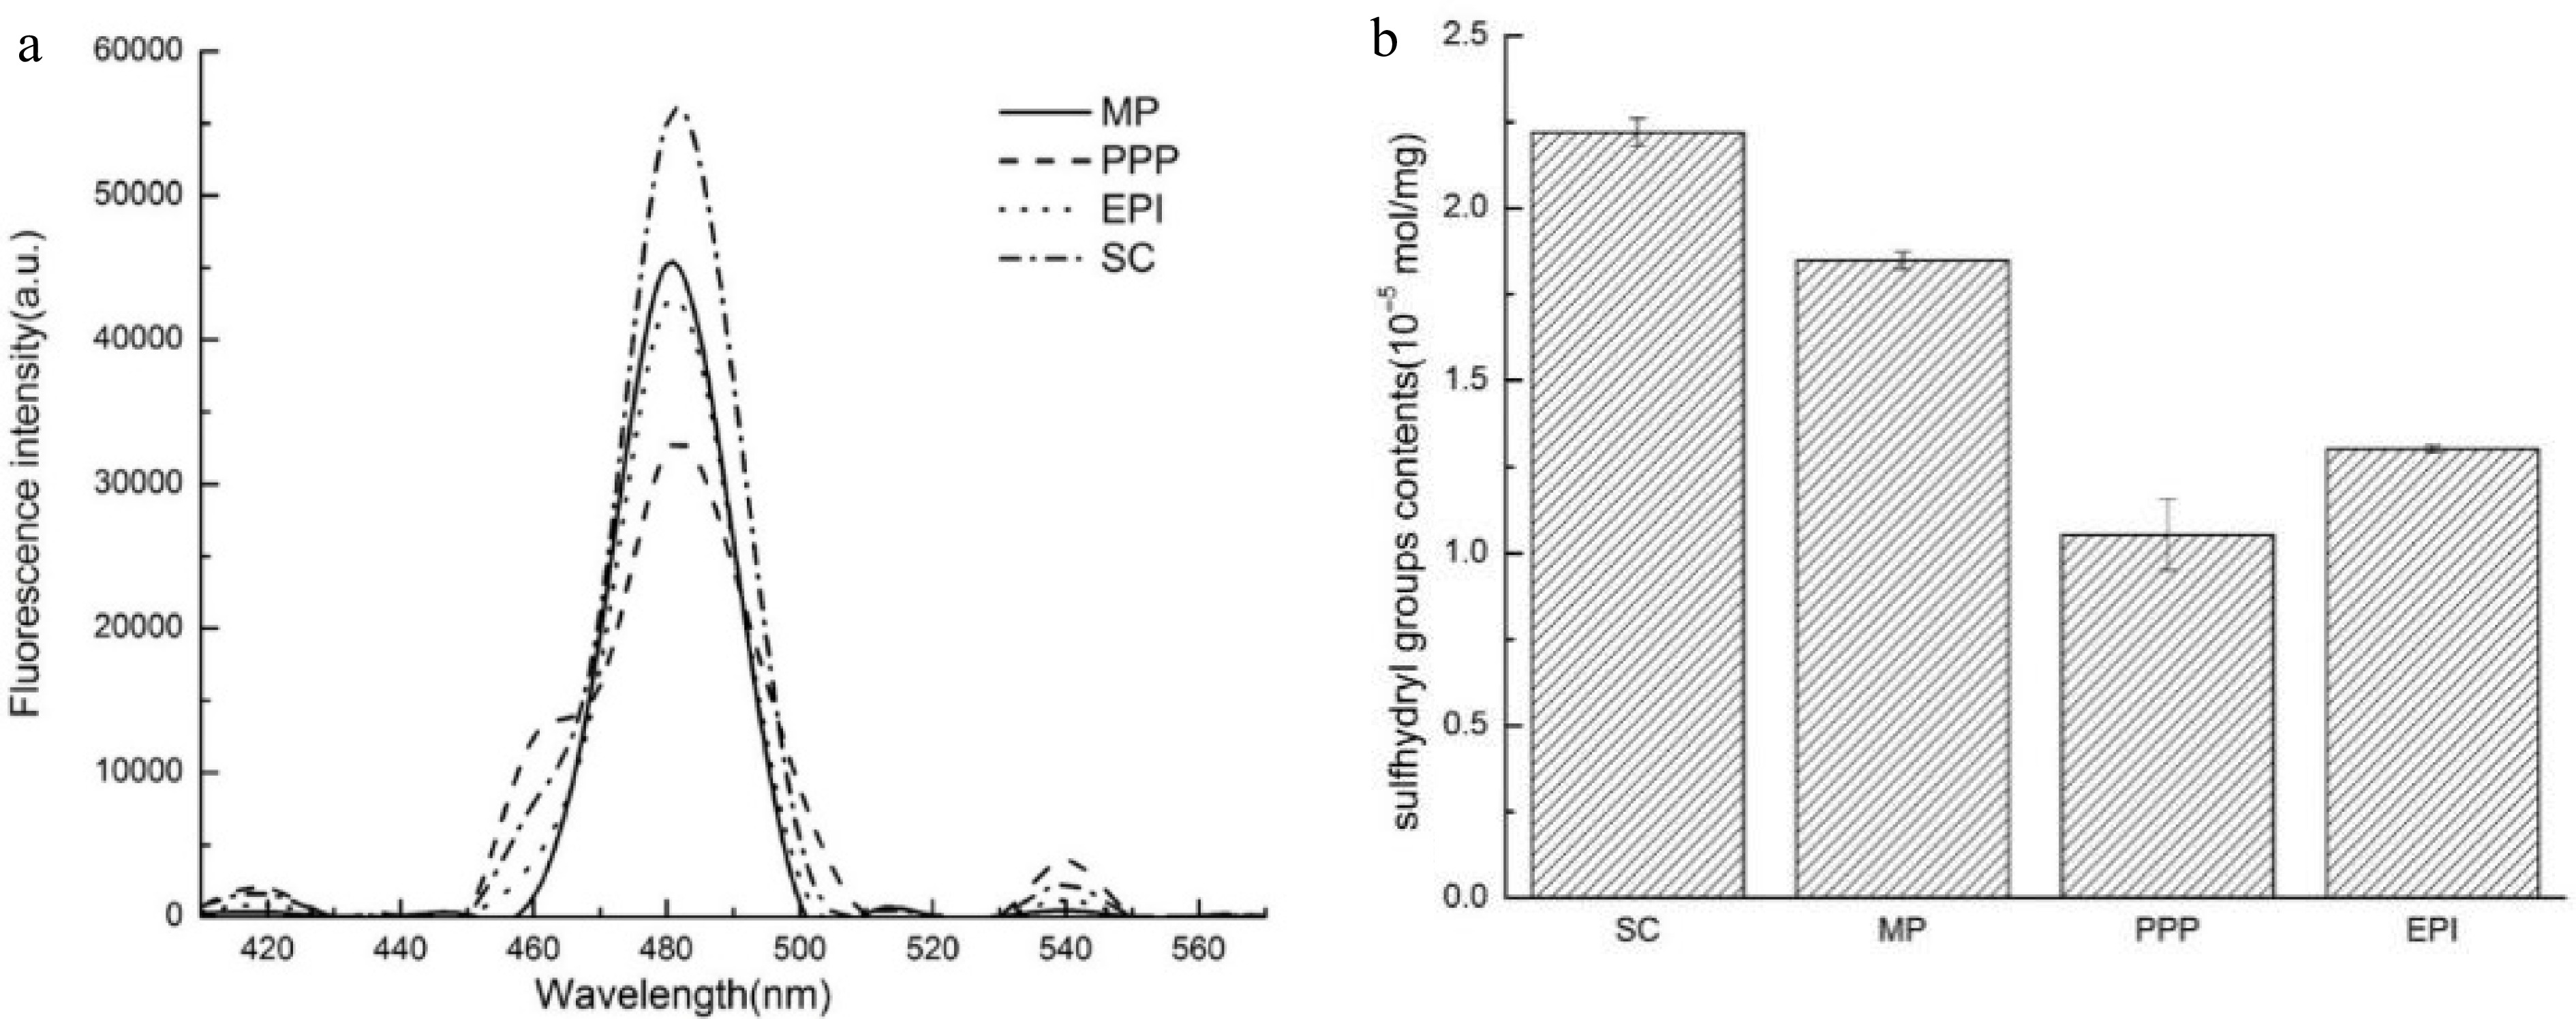
Figure 1.
(a) H0 of different proteins (MP, PPP, EPI, and SC). (b) R–SH contents (10−5 mol·mg−1) of different proteins (SC, MP, PPP, and EPI).
-
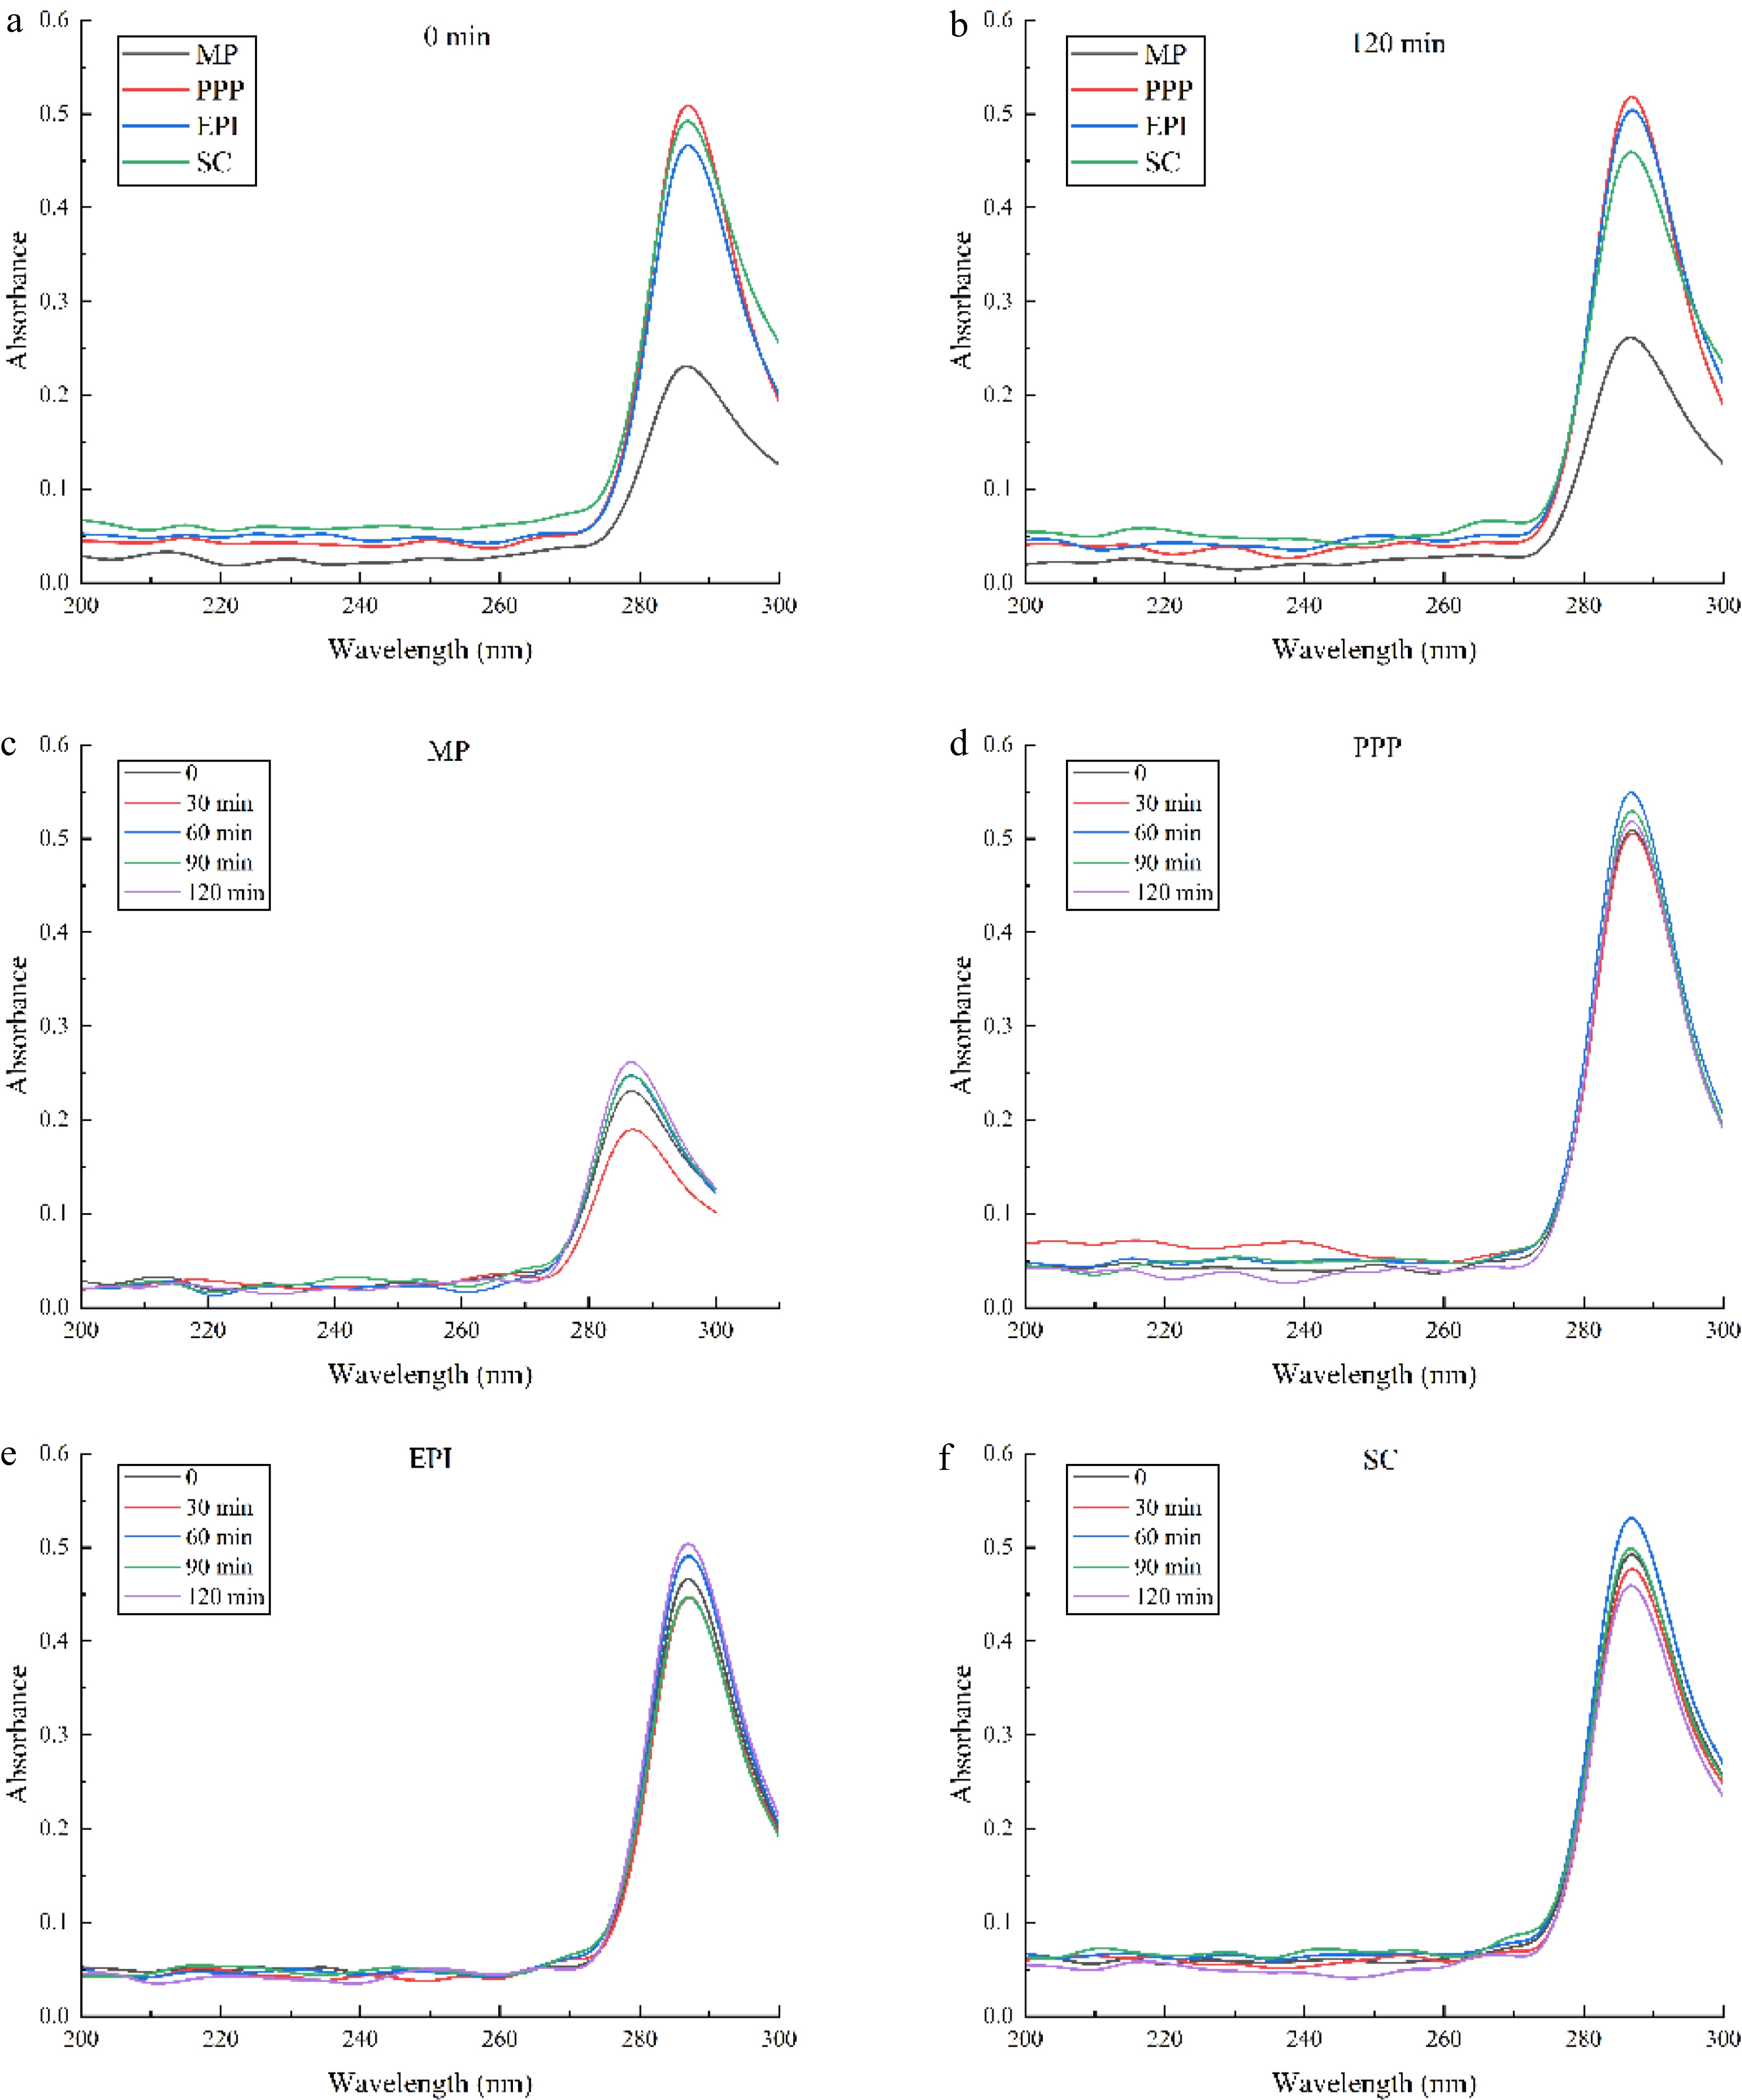
Figure 2.
The absorbance of different active proteins monitored at different times ((a) 0 min, (b) 120 min). The absorbance of (c) MP, (d) PPP, (e) EPI, (f) SC changed at different times (0, 30, 60, 90, 120 min).
-
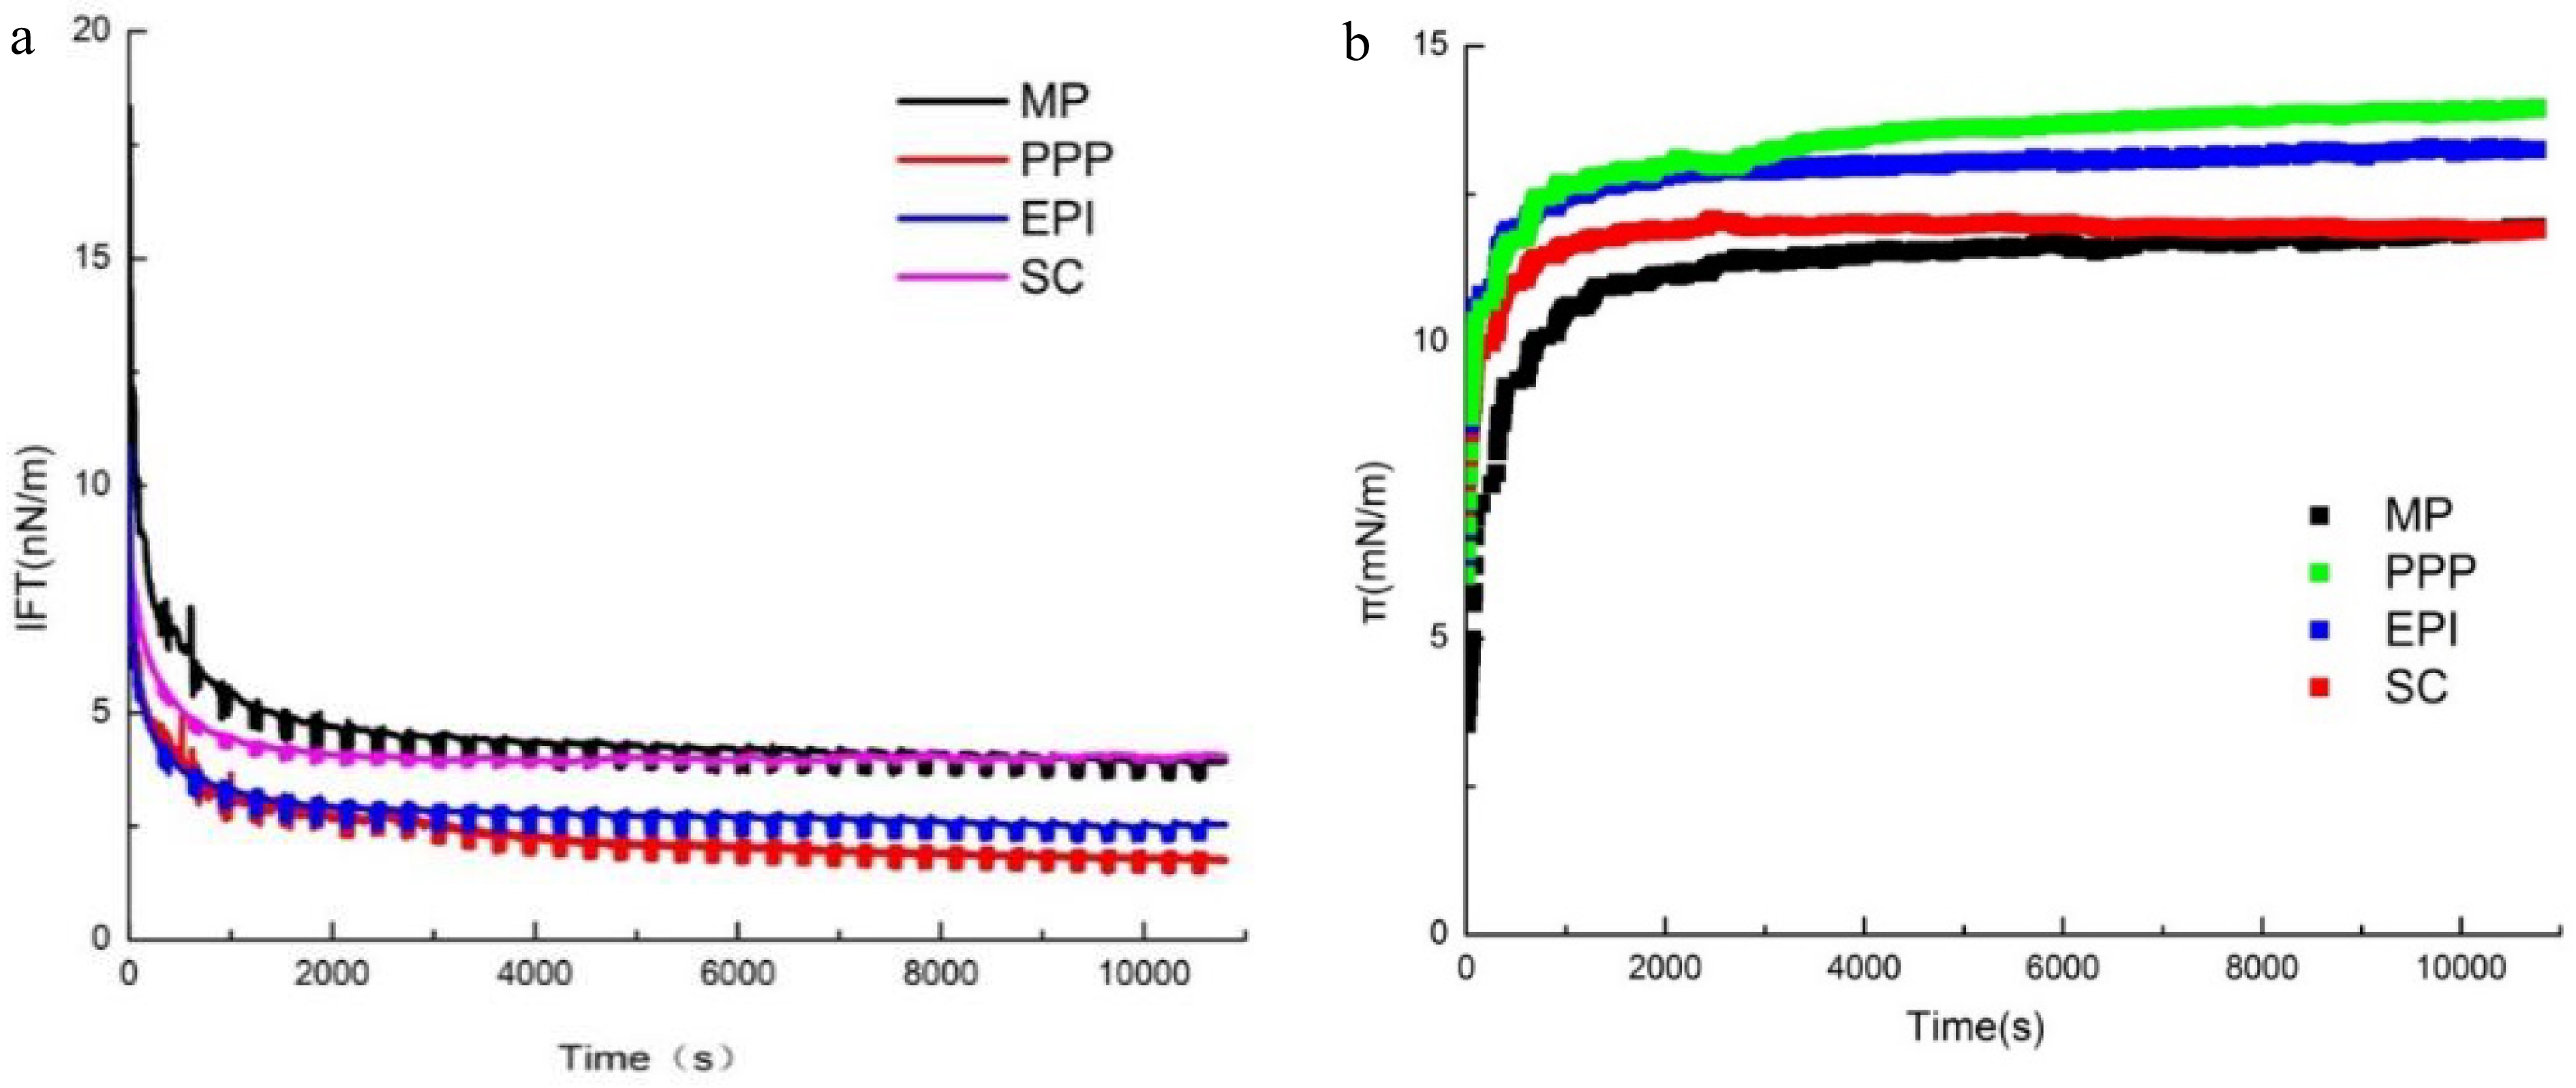
Figure 3.
(a) IFT and (b) dynamic interfacial pressure of O/W interface coated with different proteins (MP, PPP, EPI, and SC).
-
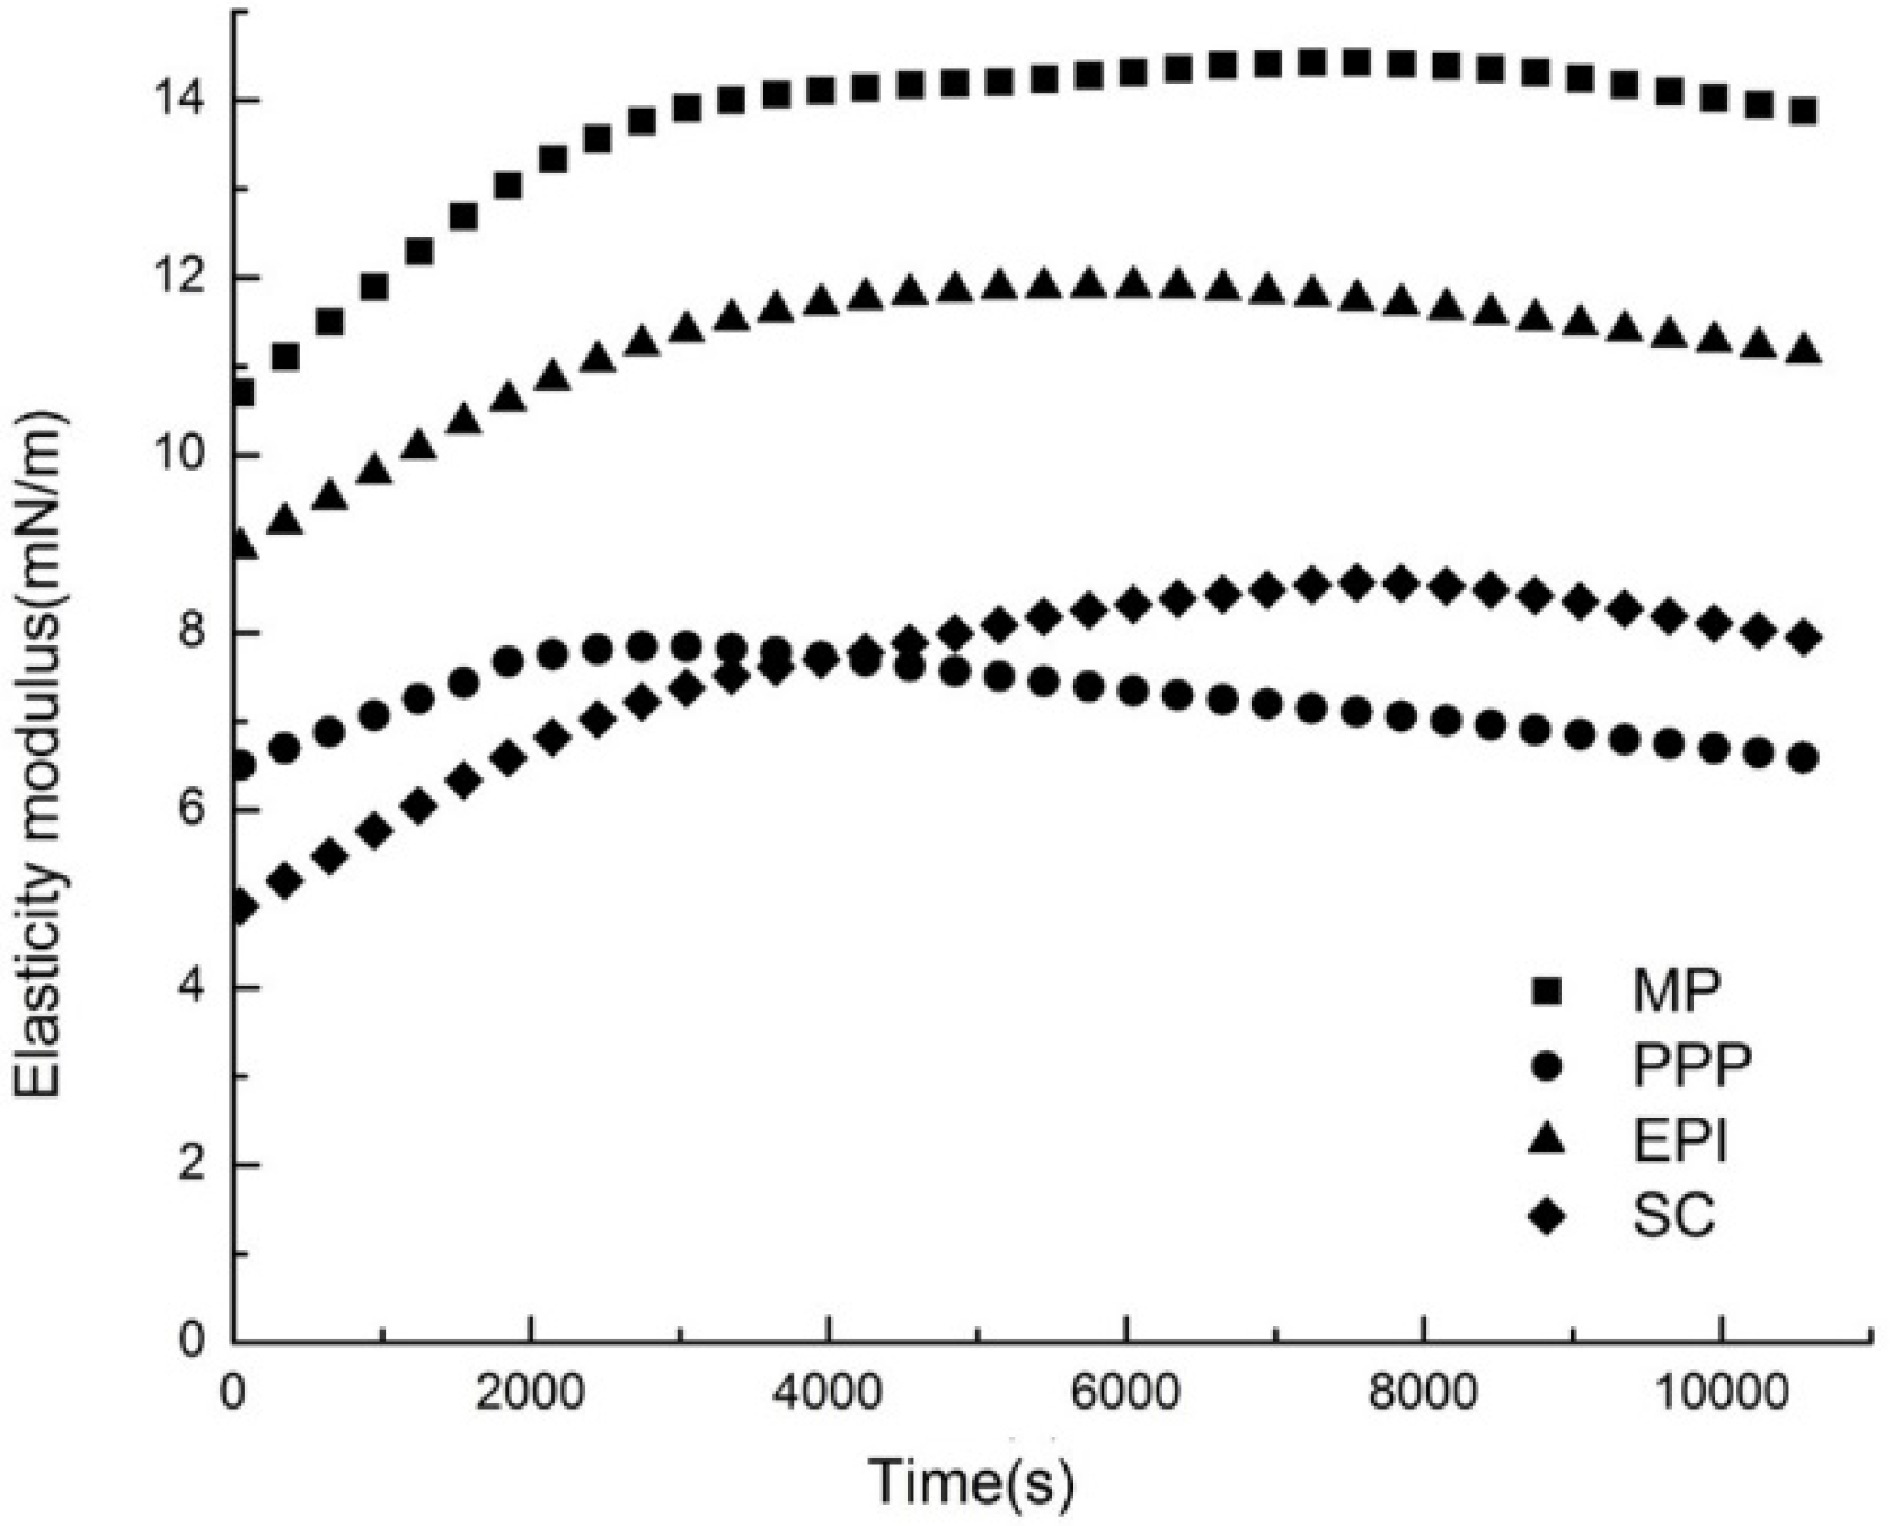
Figure 4.
The Ed of different proteins (MP, PPP, EPI, and SC).
-
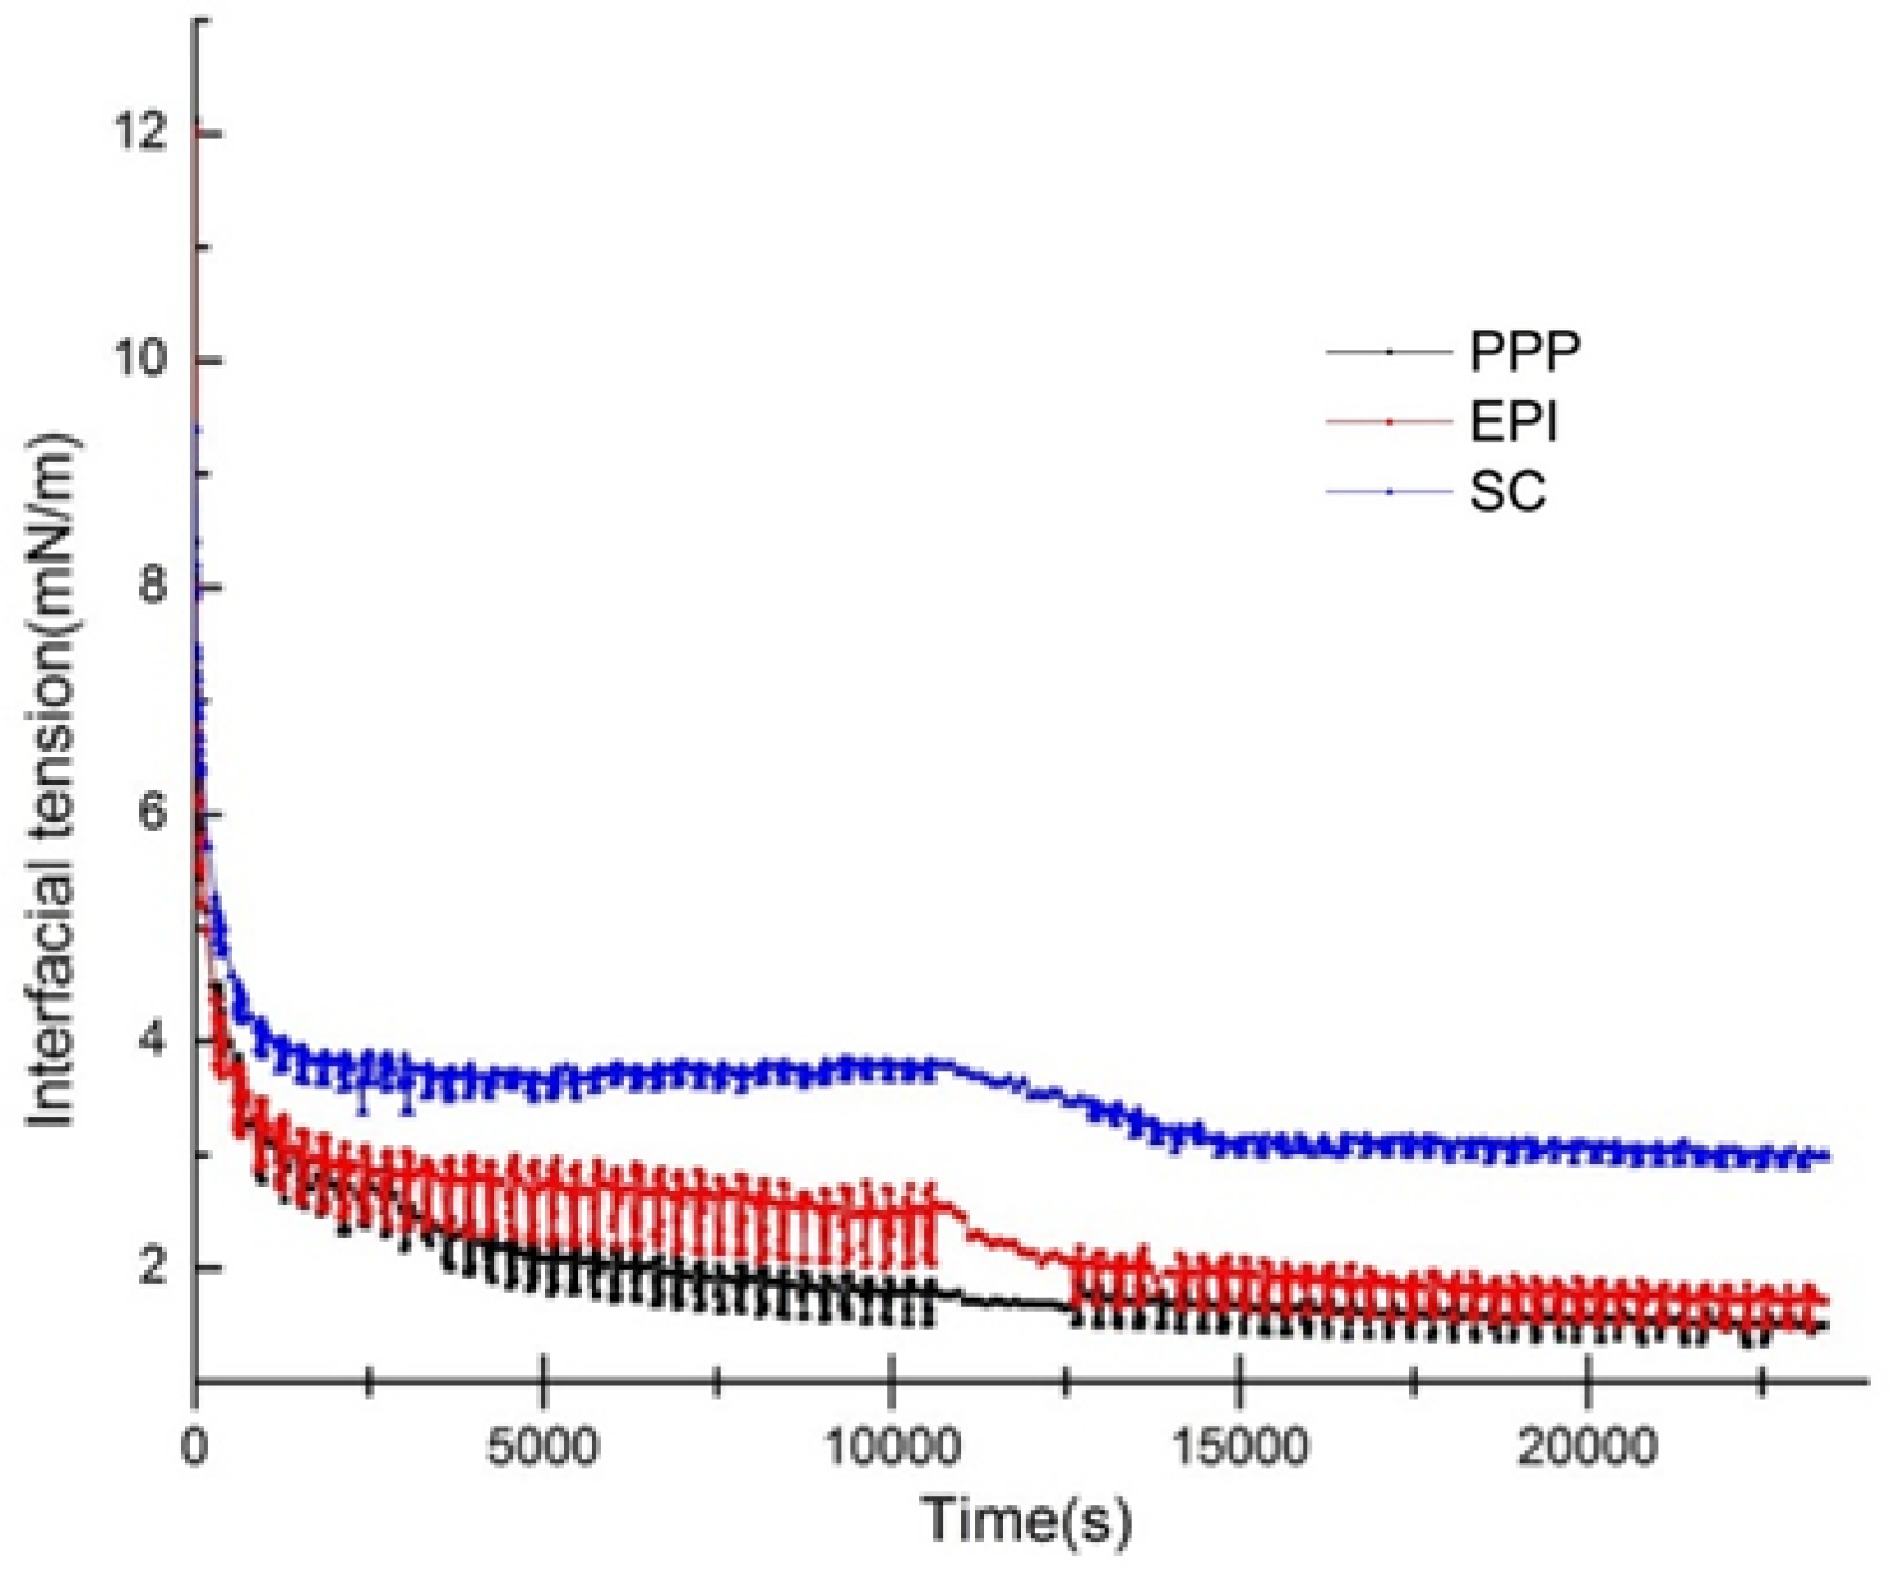
Figure 5.
The competitive adsorption between non-meat proteins (PPP, EPI, and SC) and MP.
-
Protein Kdiff /mN·m−1·s−1/2 PPP 0.5549 ± 0.0084b EPI 0.5636 ± 0.0103b SC 0.2956 ± 0.0077c MP 0.5969 ± 0.0171a Values are means ± SD. Different letters (a-c) represent means of Kdiff in same line with differ significantly (p < 0.05). Table 1.
The Kdiff of meat protein and non-meat proteins.
Figures
(5)
Tables
(1)