-
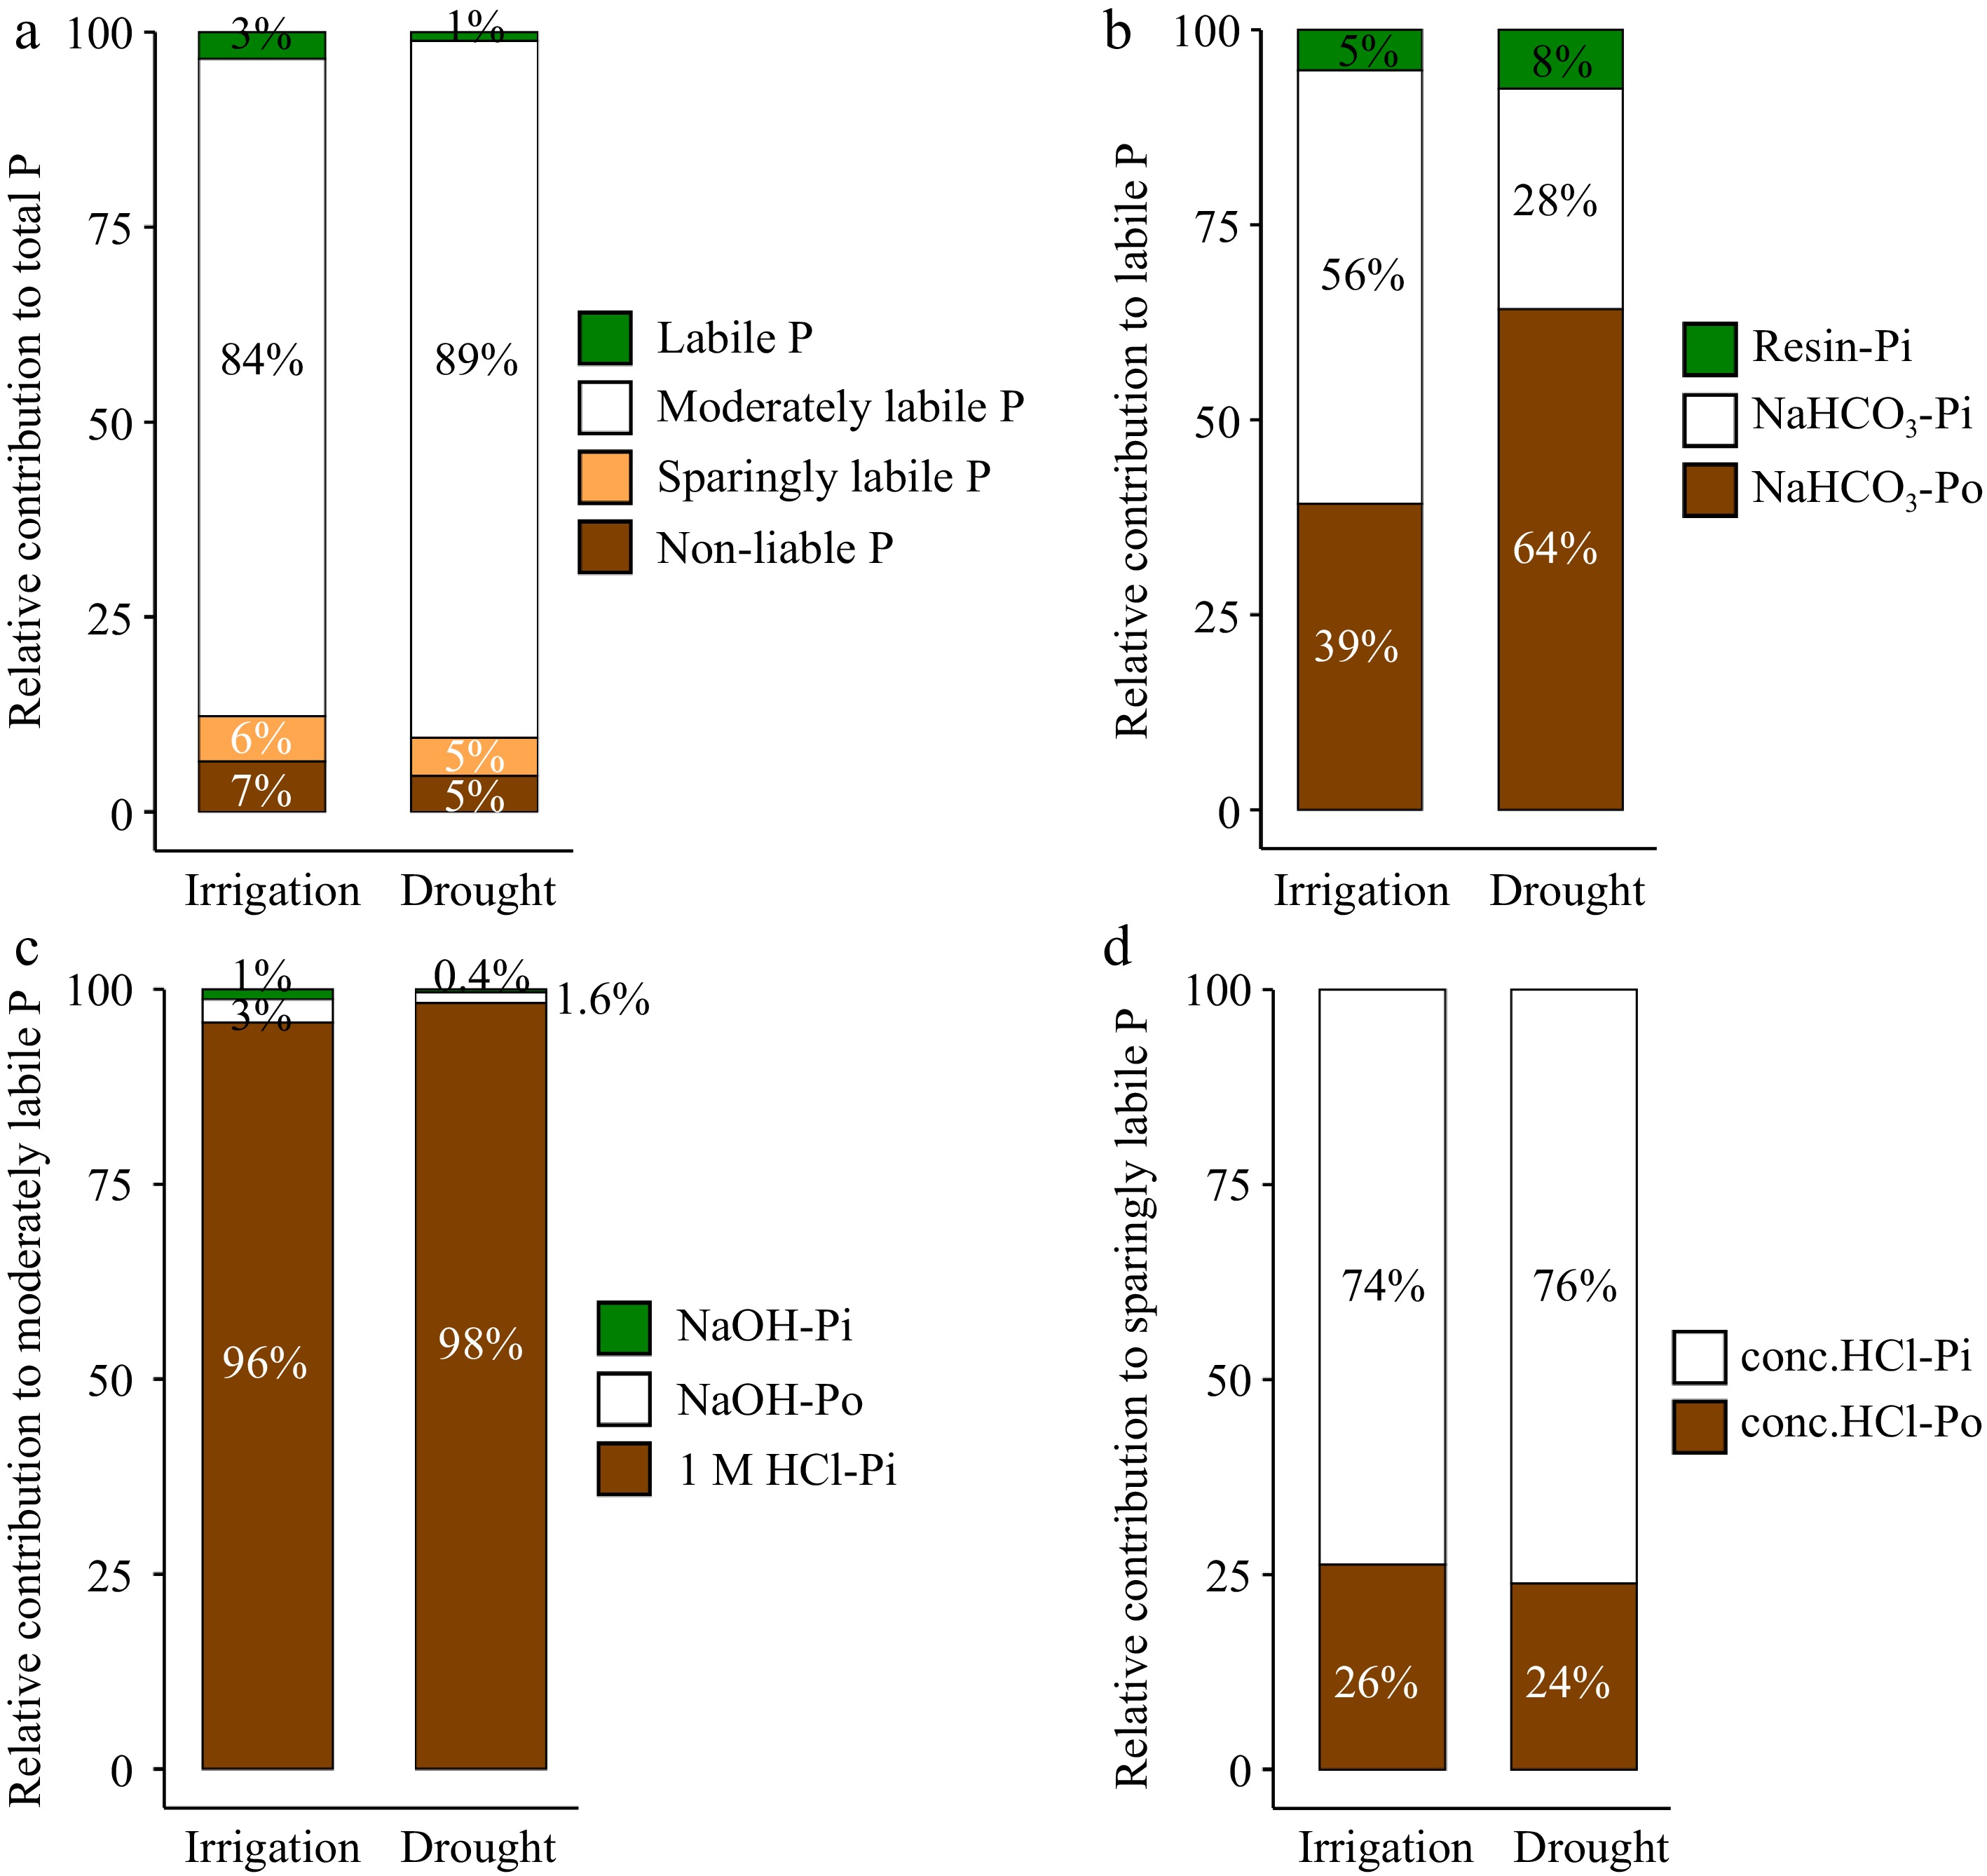
Figure 1.
Percentage of each phosphorus (P) fraction under different water management treatments. (a) Total P. (b) Labile P. (c) Moderately labile P. (d) Sparingly labile P.
-
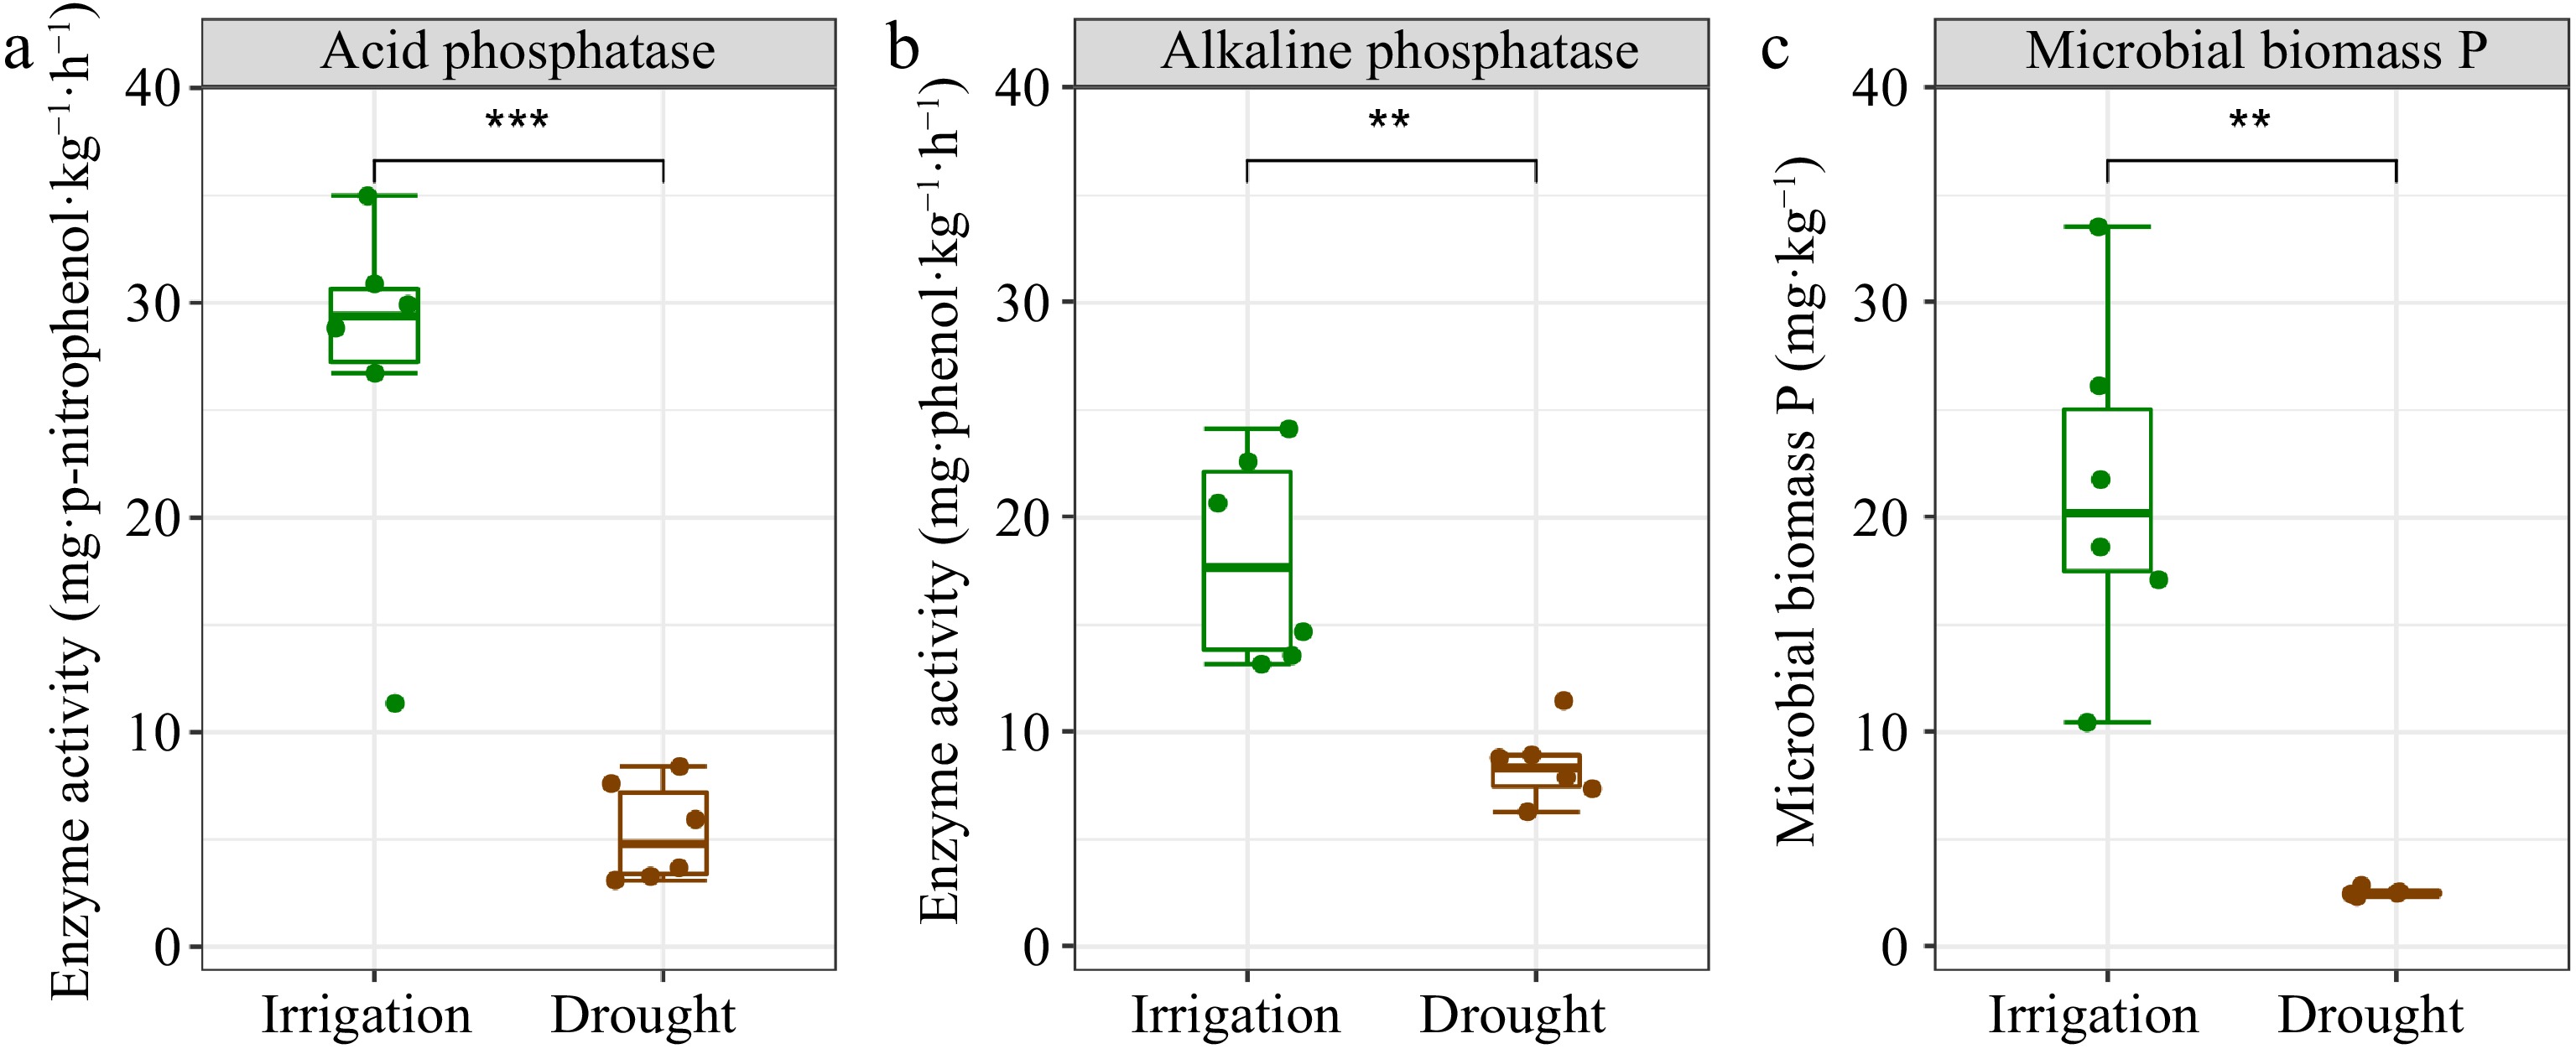
Figure 2.
Soil phosphatase and microbial biomass P in P. euphratica plantations under different water management treatments. (a) Acid phosphatase activity. (b) Alkaline phosphatase activity. (c) Microbial biomass P. The error bars indicate the SE of the mean (n = 6). Asterisks indicate the level of significance: ** p < 0.01, *** p < 0.001.
-

Figure 3.
Spearman's correlation analysis among soil P fractions and soil phosphatase (acid and alkaline phosphatase) activity and microbial biomass P. Significance of changes in each P fraction: * p < 0.05; ** p < 0.01.
-
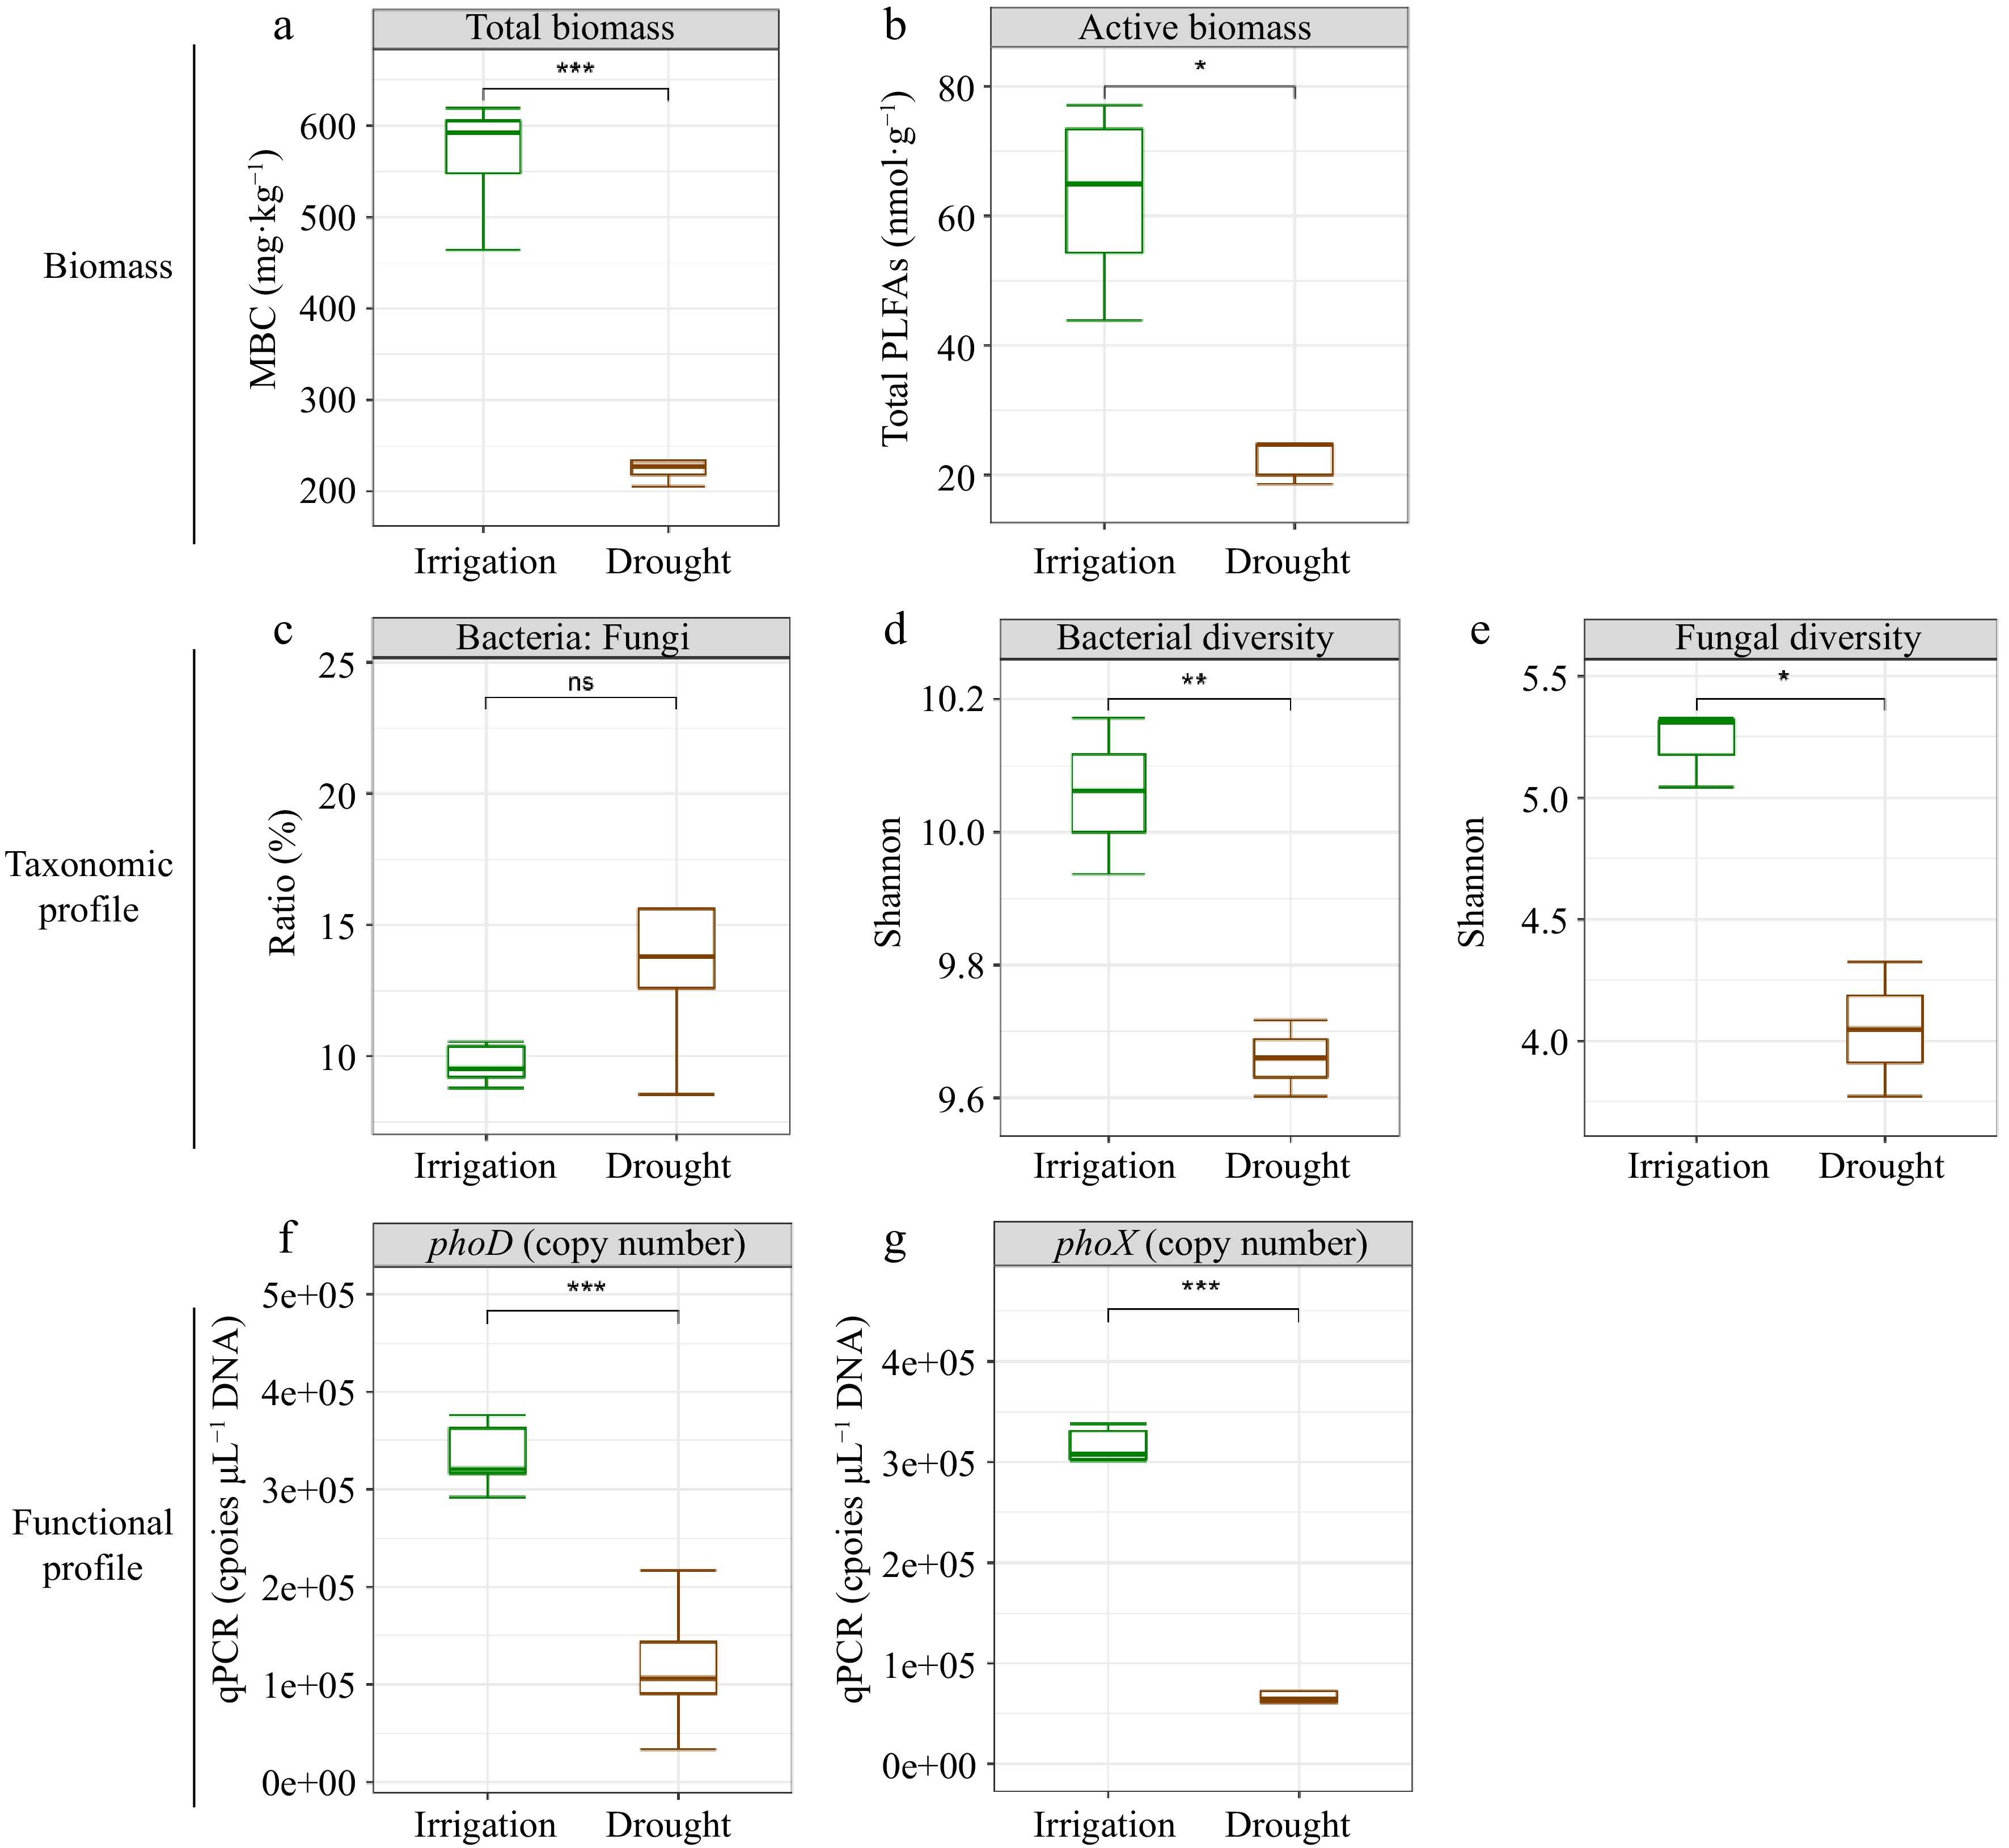
Figure 4.
Effects of water management on soil microbial characteristics (biomass change, taxonomic profile and functional profile). (a) Total microbial biomass C. (b) Total PLFAs. (c) Bacteria to fungi ratio. (d) Shannon diversity of bacteria. (e) Shannon diversity of fungi. (f) phoD copies. (g) phoX copies. Significance levels were standardized across the panels (* p < 0.05; ** p < 0.01 and *** p < 0.001).
-

Figure 5.
Redundancy analysis of soil P fractions impacted by soil microbial characteristics. (a) RDA across all experimental units. (b) The variation in soil microbial characteristics explaining soil P fractions. Red arrows represent soil microbial characteristics. Blue crosses represent soil P fractions. Significance is indicated by ** p < 0.01; * p < 0.05.
-

Figure 6.
Procrustean analyses and spearman's correlations between soil P fractions and alkaline phosphatase gene communities. (a) Procrustean analyses of phoD community composition and soil P fractions across samples. (b) Procrustean analyses of phoX community composition and soil P fractions across samples. (c) Spearman’s correlations of soil P fractions and the relative abundance of phoD at family level. (d) Spearman's correlations of soil P fractions and the relative abundance of phoX at family level. (e) Spearman's correlations of soil P fractions and the relative abundance of phoD at genus level. (f) Spearman's correlations of soil P fractions and the relative abundance of phoX at genus level. Significance of each bacteria taxa: * p < 0.05; ** p < 0.01.
-
Soil properties Irrigation Drought p value WC (%) 25.26 ± 0.54 6.93 ± 0.95 < 0.01 pH 8.41 ± 0.05 8.72 ± 0.02 < 0.01 TN (g·kg−1) 1.18 ± 0.05 0.76 ± 0.02 0.03 SOC (g·kg−1) 40.13 ± 0.22 32.12 ± 0.29 < 0.01 $ {\text{NO}^-_3}$ 6.35 ± 1.82 4.55 ± 0.90 0.16 ${\text{NH}^+_4} $ 2.15 ± 0.23 1.25 ± 0.11 < 0.01 TP (g kg−1) 0.65 ± 0.01 0.57 ± 0.01 0.01 DON (mg·kg−1) 7.96 ± 0.47 9.65 ± 0.27 0.05 AK (g·kg−1) 0.41 ± 0.09 0.32 ± 0.05 0.12 DOC (g·kg−1) 0.26 ± 0.03 0.39 ± 0.07 0.17 Na+ (g·kg−1) 1.85 ± 0.06 1.82 ± 0.16 0.37 Ca2+ (g·kg−1) 15.75 ± 0.51 13.95 ± 0.34 0.86 Mg2+ (g·kg−1) 0.83 ± 0.08 0.61 ± 0.03 0.06 TPi (g·kg−1) 0.57 ± 0.01 0.53 ± 0.01 0.01 Pi/Pt (%) 88.15 ± 0.91 92.29 ± 0.30 0.68 Po/Pt (%) 11.85 ± 0.91 7.71 ± 0.30 0.16 Bold numbers indicate significant differences (p < 0.05) between treatments. WC: water content, TN: total nitrogen, SOC: soil organic carbon, DON: dissolved organic nitrogen, AK: available K, DOC: dissolved organic carbon. Total P is the sum of all P fractions; total Pi is the sum of Resin-Pi, NaHCO3-Pi, NaOH-Pi, 1 M HCl-Pi, and conc. HCl-Pi; total Po is the sum of NaHCO3-Po, NaOH-Po, and conc. HCl-Po. Table 1.
Effects of irrigation on soil properties (mean ± standard error) in P. euphratica plantations.
-
P fraction (mg·kg−1) Irrigation Drought p value Labile P Resin-Pi 1.15 ± 0.27 0.50 ± 0.06 0.04 NaHCO3-Pi 12.31 ± 2.40 1.88 ± 0.51 < 0.01 NaHCO3-Po 8.69 ± 0.82 4.25 ± 0.49 0.03 ΣLabile P 22.15 ± 1.67 6.62 ± 0.54 < 0.01 Moderately labile P NaOH-Pi 7.02 ± 0.79 2.07 ± 0.12 < 0.01 NaOH-Po 16.41 ± 1.83 6.98 ± 0.17 < 0.01 1 M HCl-Pi 521.10 ± 12.37 505.52 ± 1.56 0.03 ΣModerately labile P 544.53 ± 13.51 511.58 ± 1.54 0.02 Sparingly labile P Conc. HCl-Pi 27.50 ± 1.84 21.35 ± 1.73 0.01 Conc. HCl-Po 9.79 ± 1.38 6.68 ± 1.50 0.02 ΣSparingly labile P 37.29 ± 2.75 28.04 ± 1.95 0.17 Nonlabile P Residual P 41.76 ± 5.11 26.22 ± 0.82 0.49 Bold numbers indicate significant differences (p < 0.05) between treatments. Table 2.
Soil phosphorus (P) sequential fractionation under different water management treatments.
Figures
(6)
Tables
(2)