-

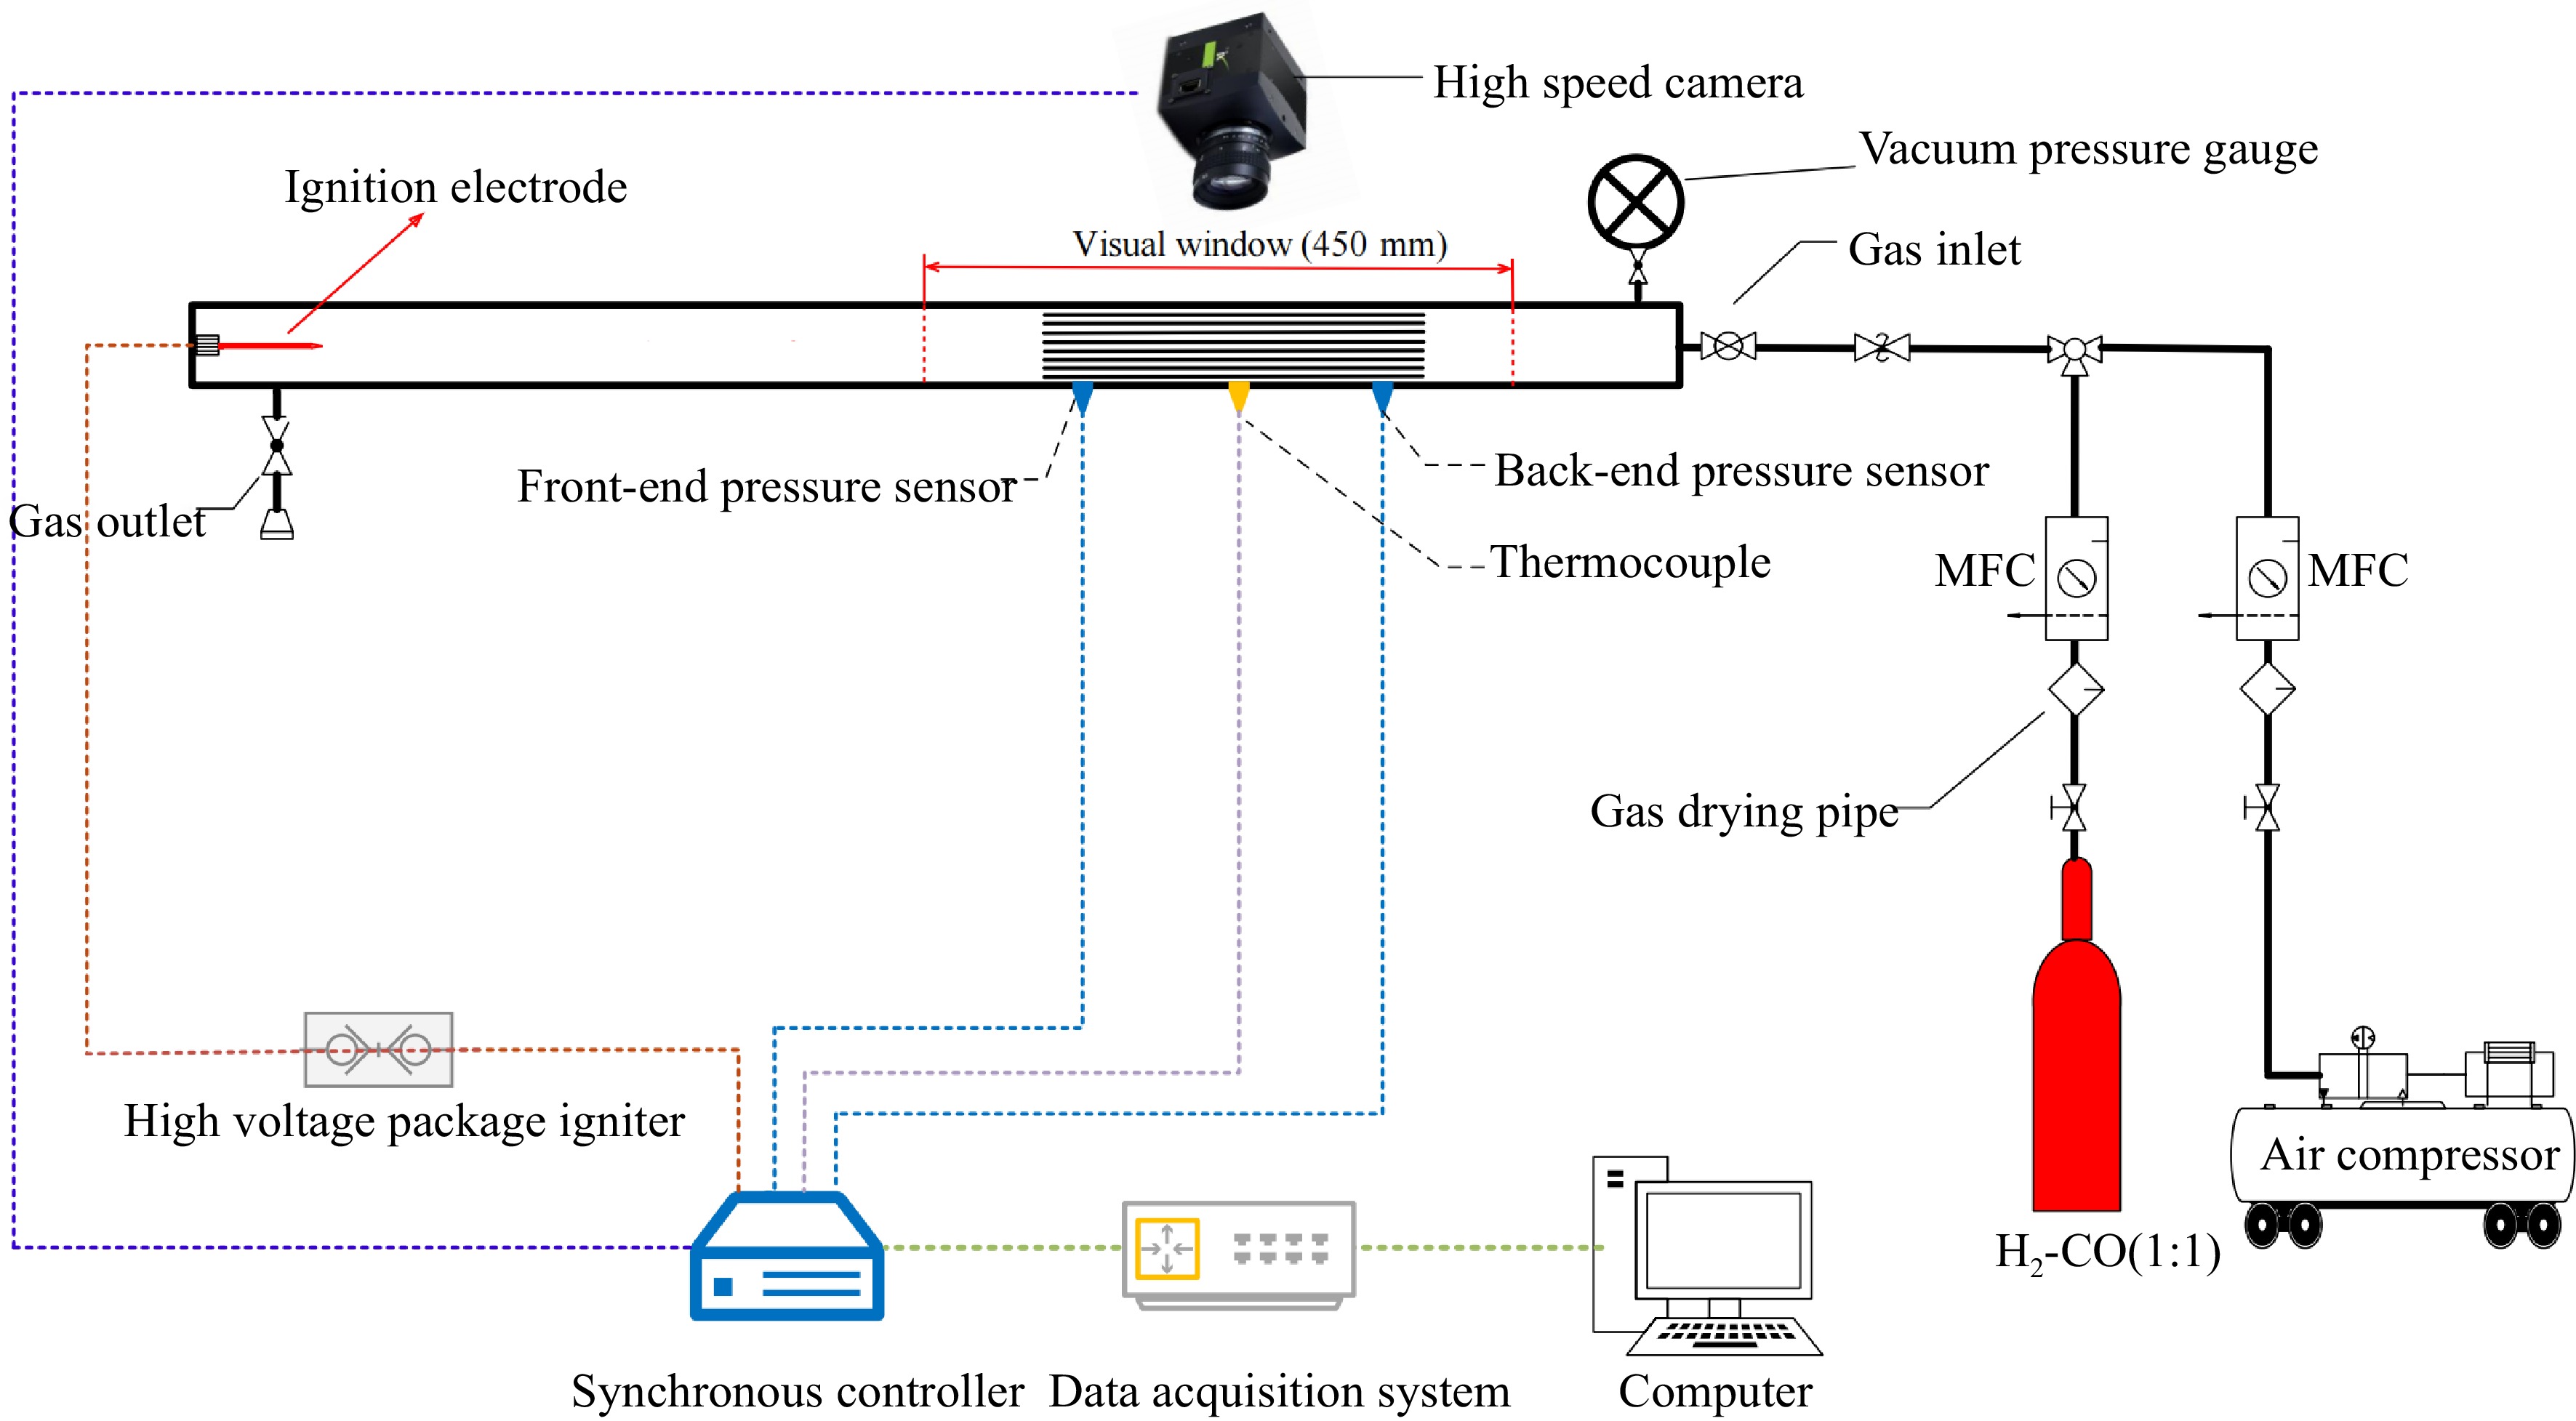
Figure 1.
Schematic diagram of the experimental setup.
-

Figure 2.
Parallel narrow channel device.
-

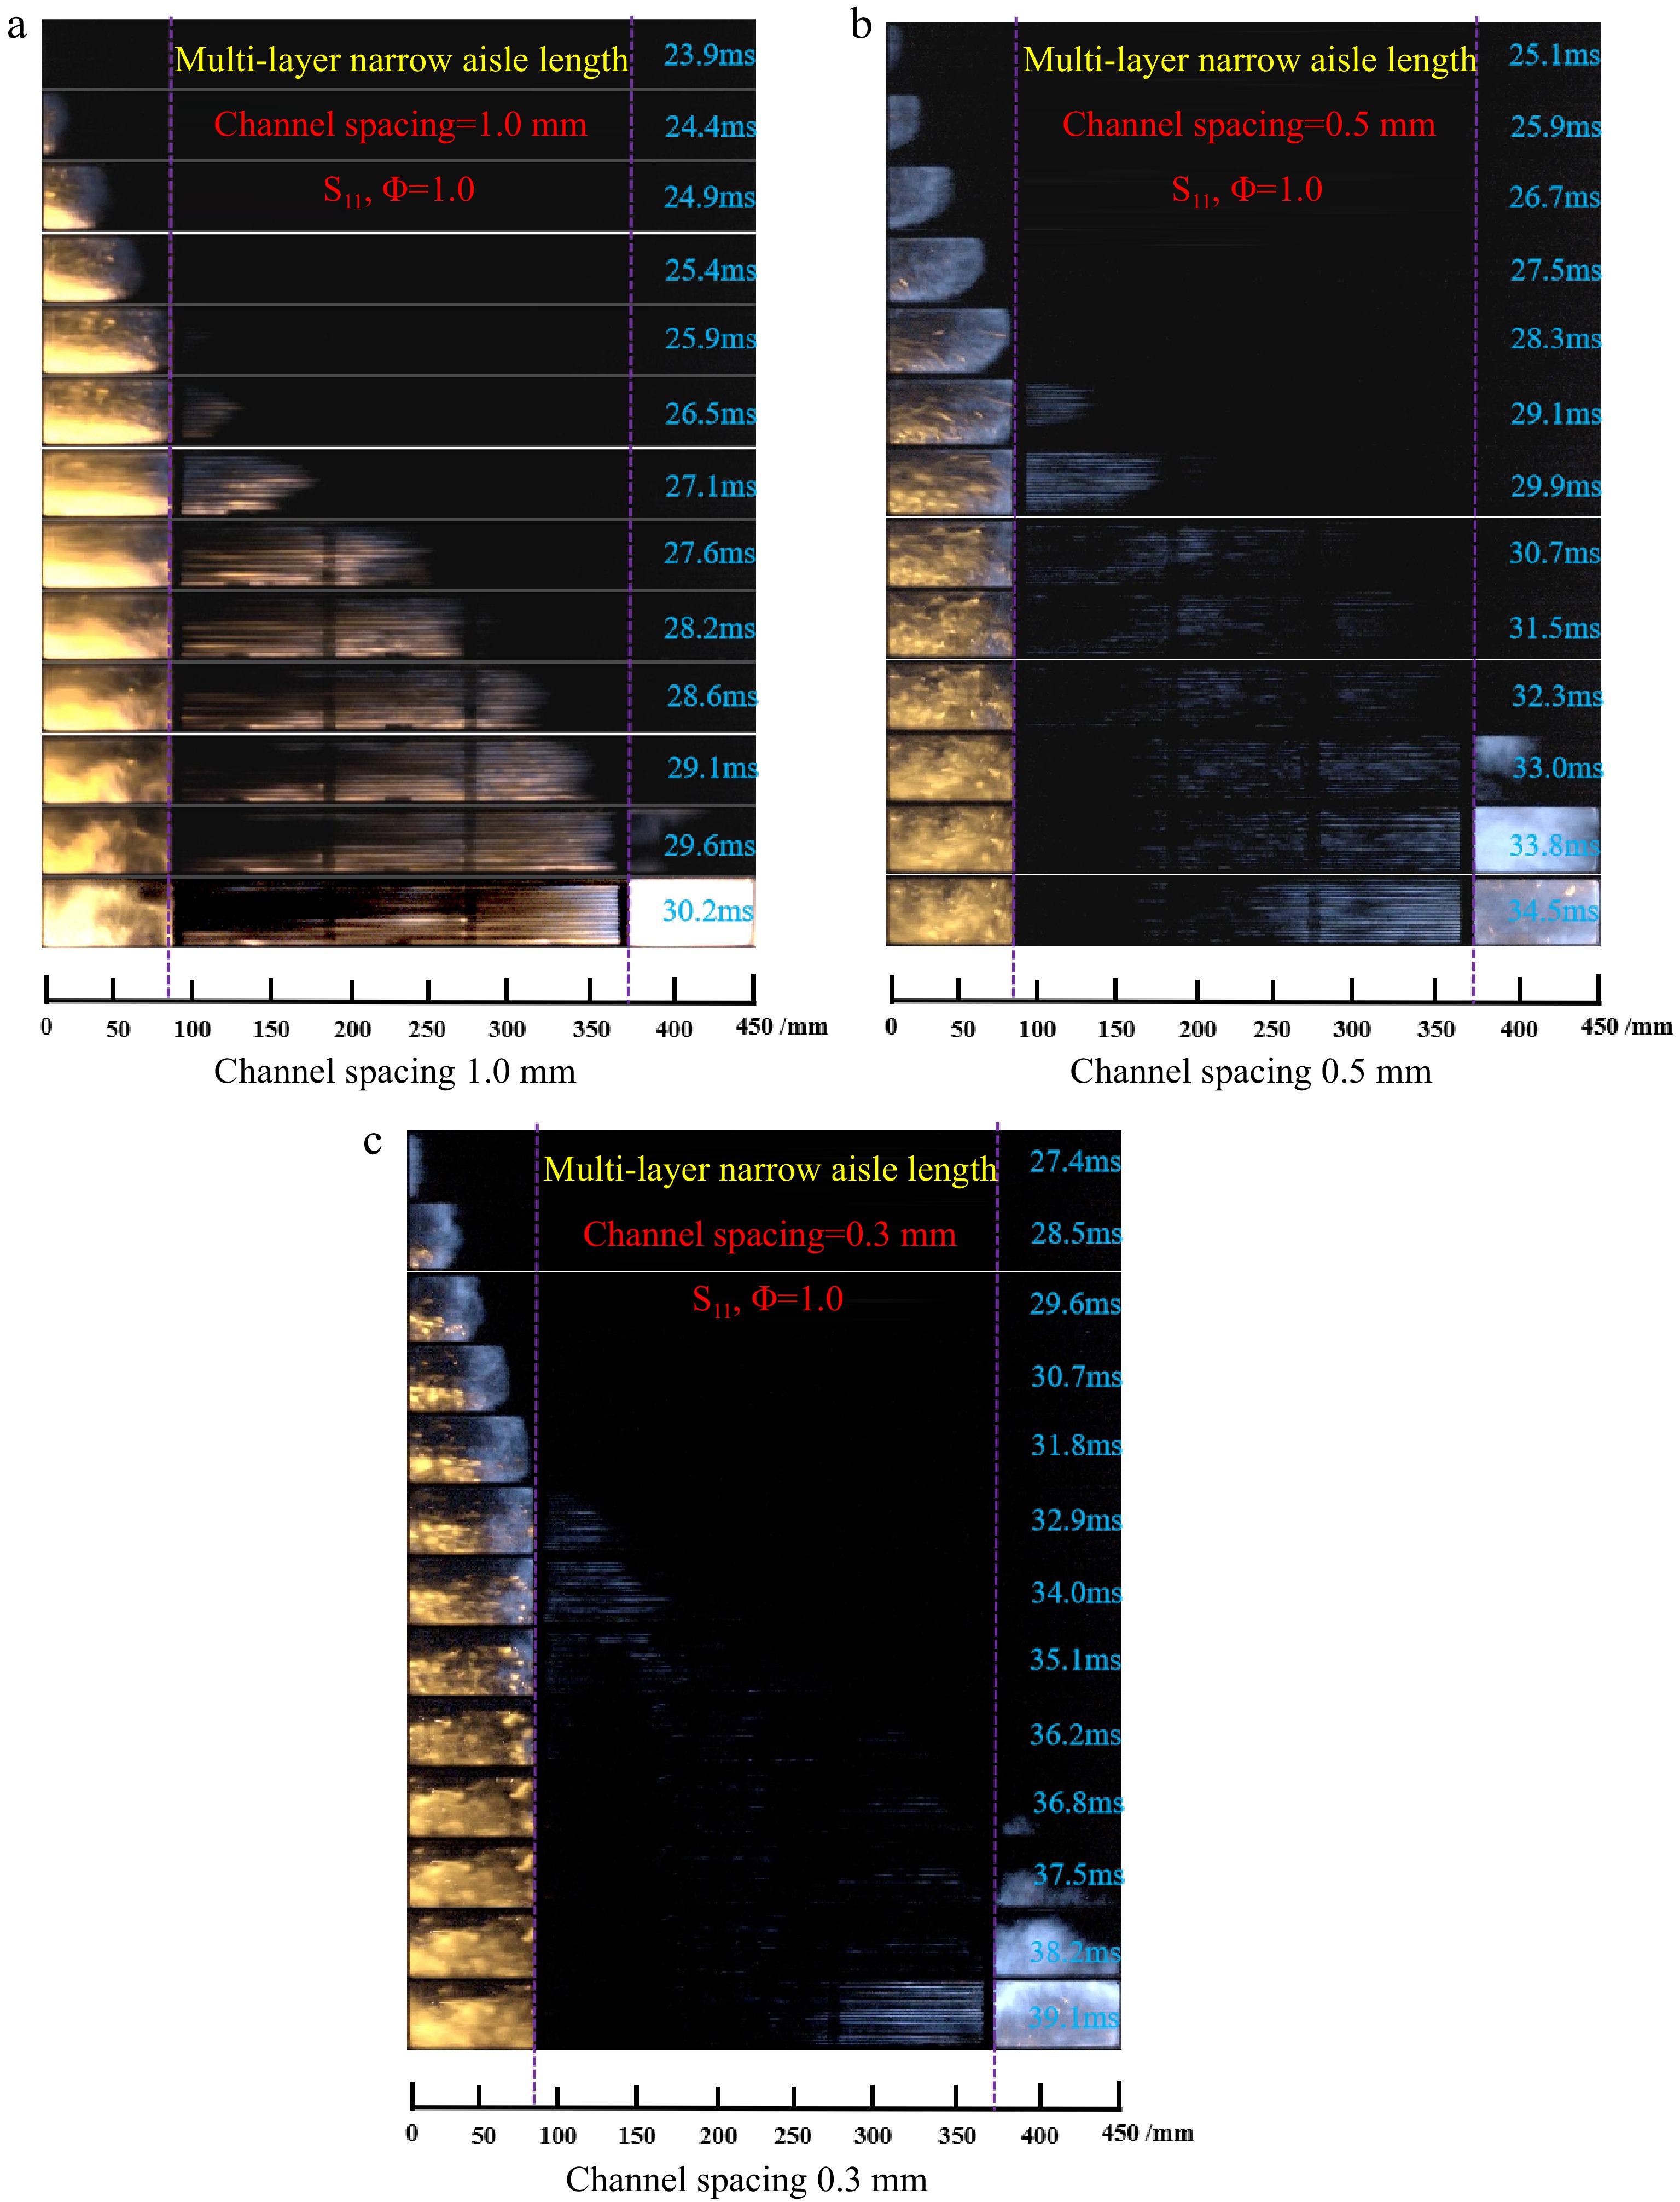
Figure 3.
Flame propagation images at different channel spacing for equivalent ratio 1.0.
-

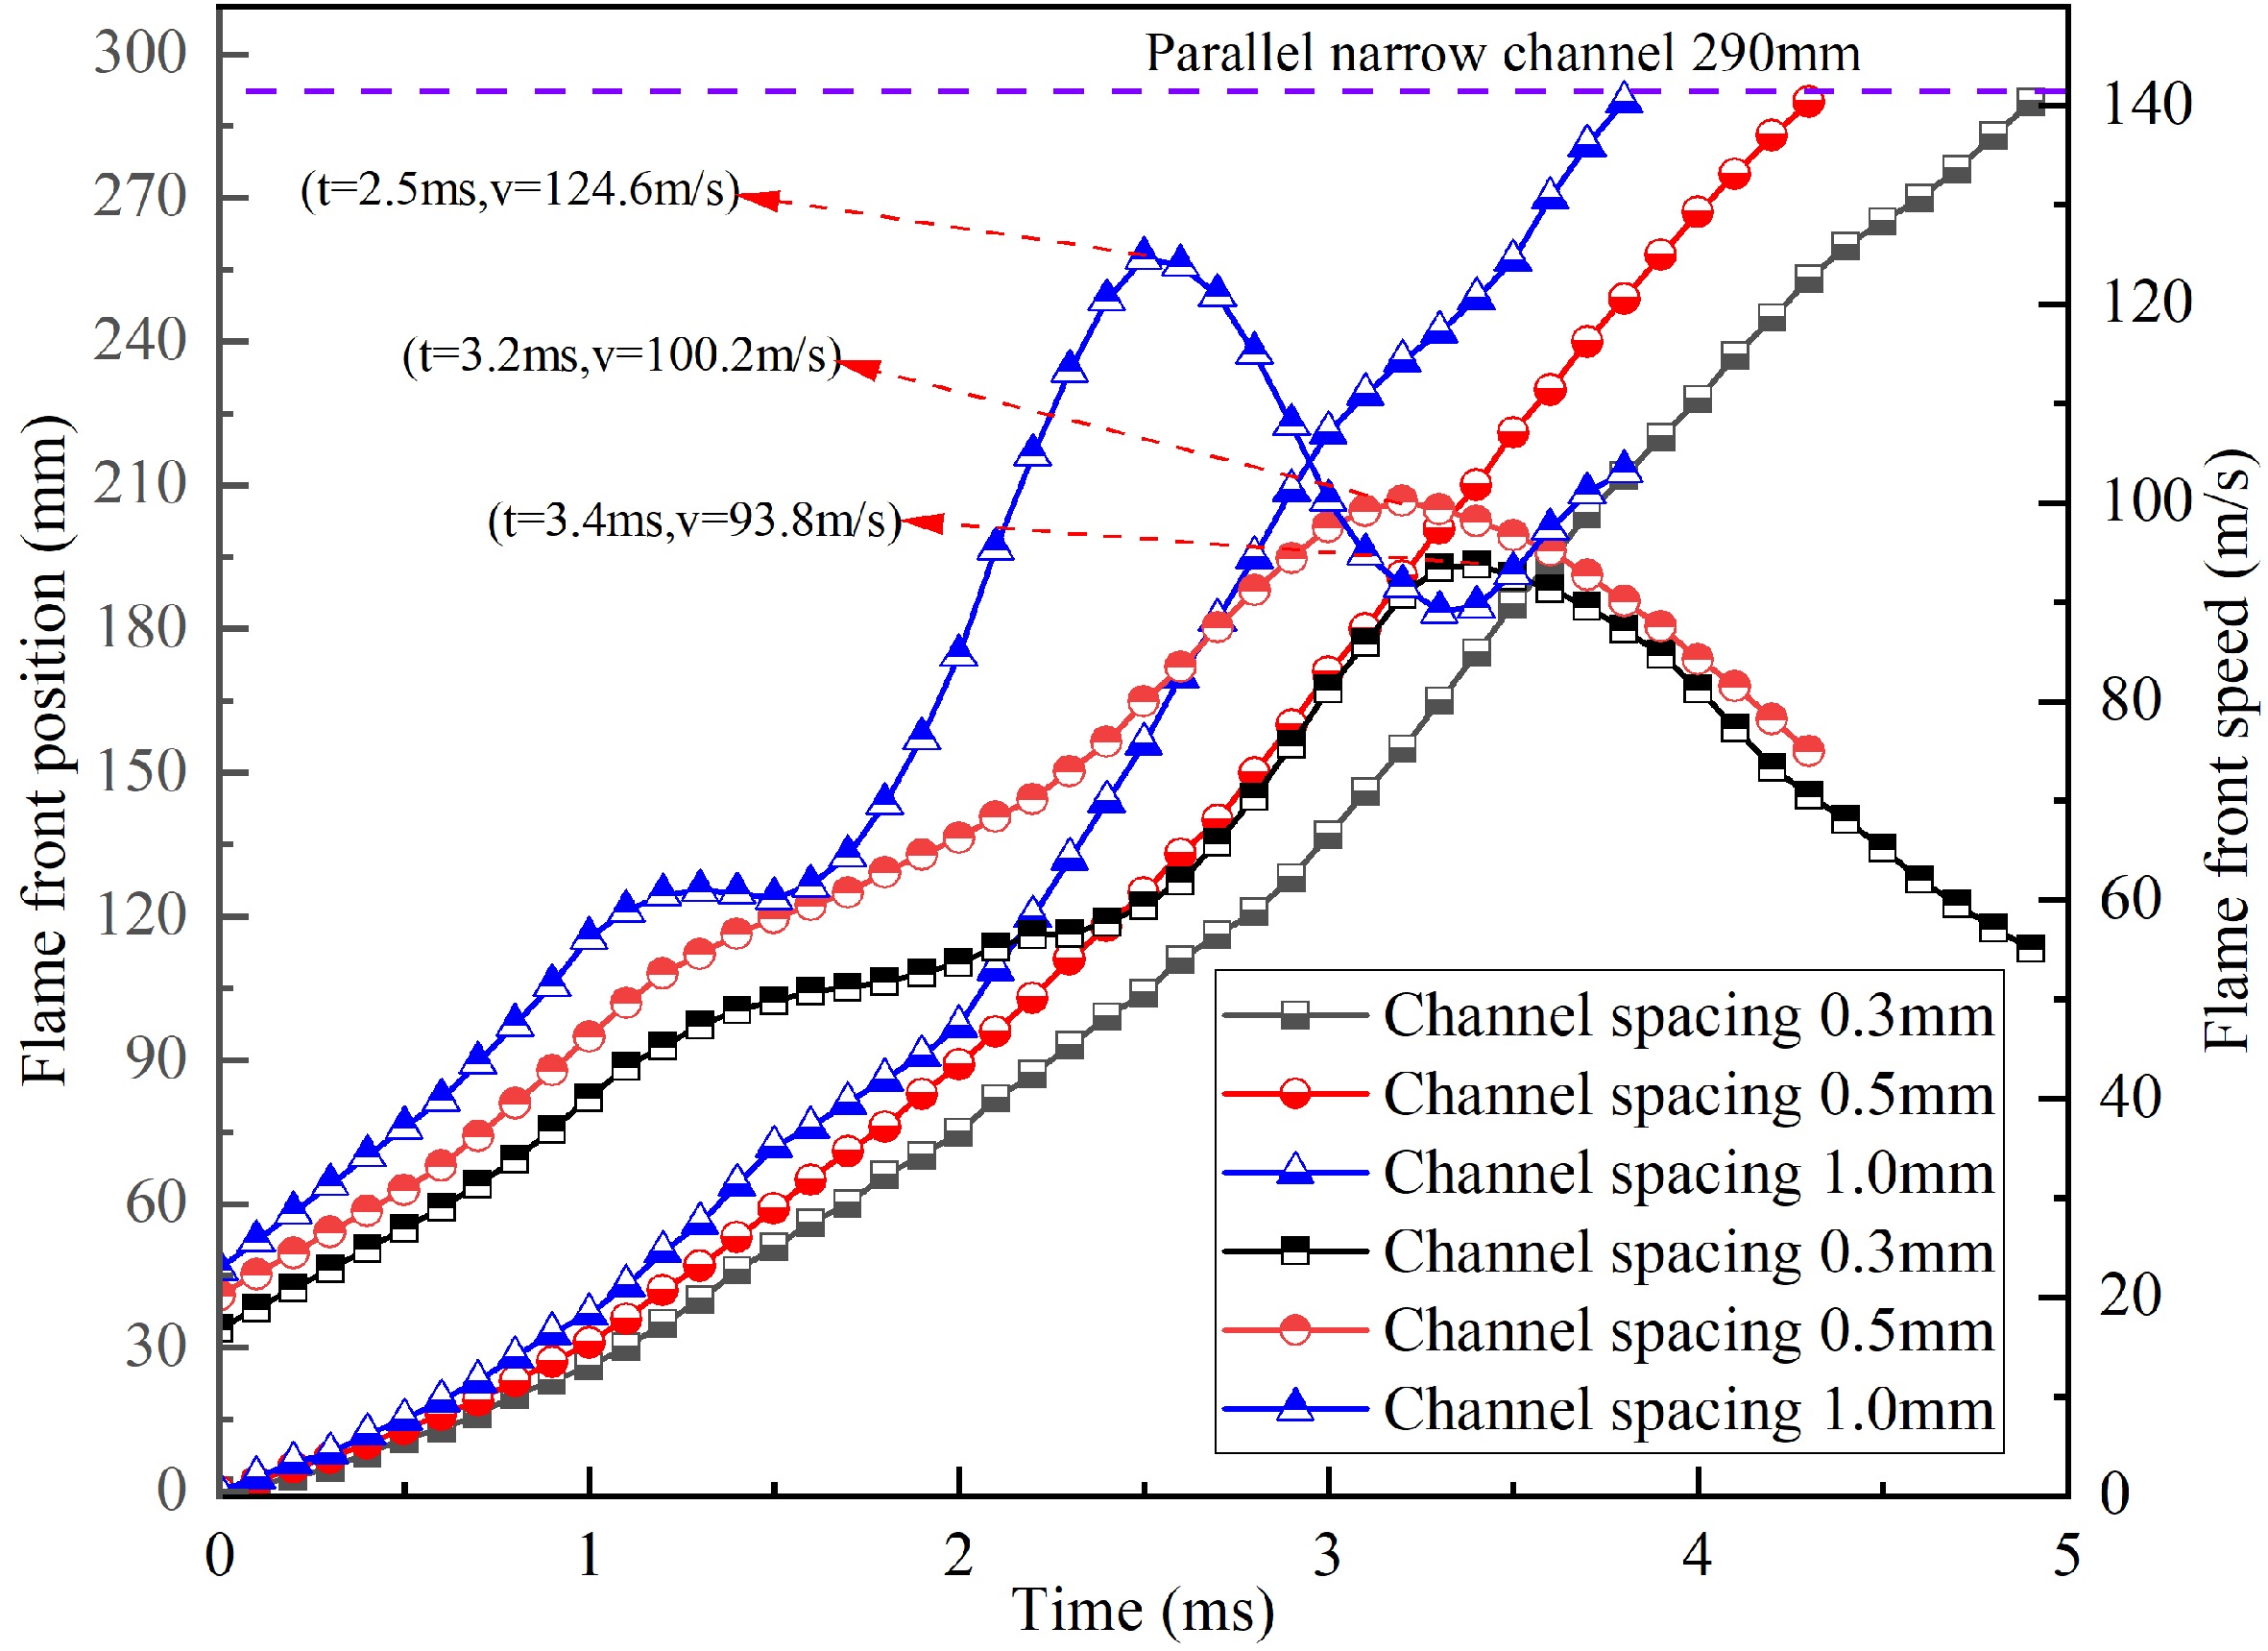
Figure 4.
Flame front position and velocity variation curves for different channel spacing.
-

Figure 5.
Pmax variation curves before and after with different channel spacing.
-

Figure 6.
Variation of pressure rise rate for different channel spacing.
-

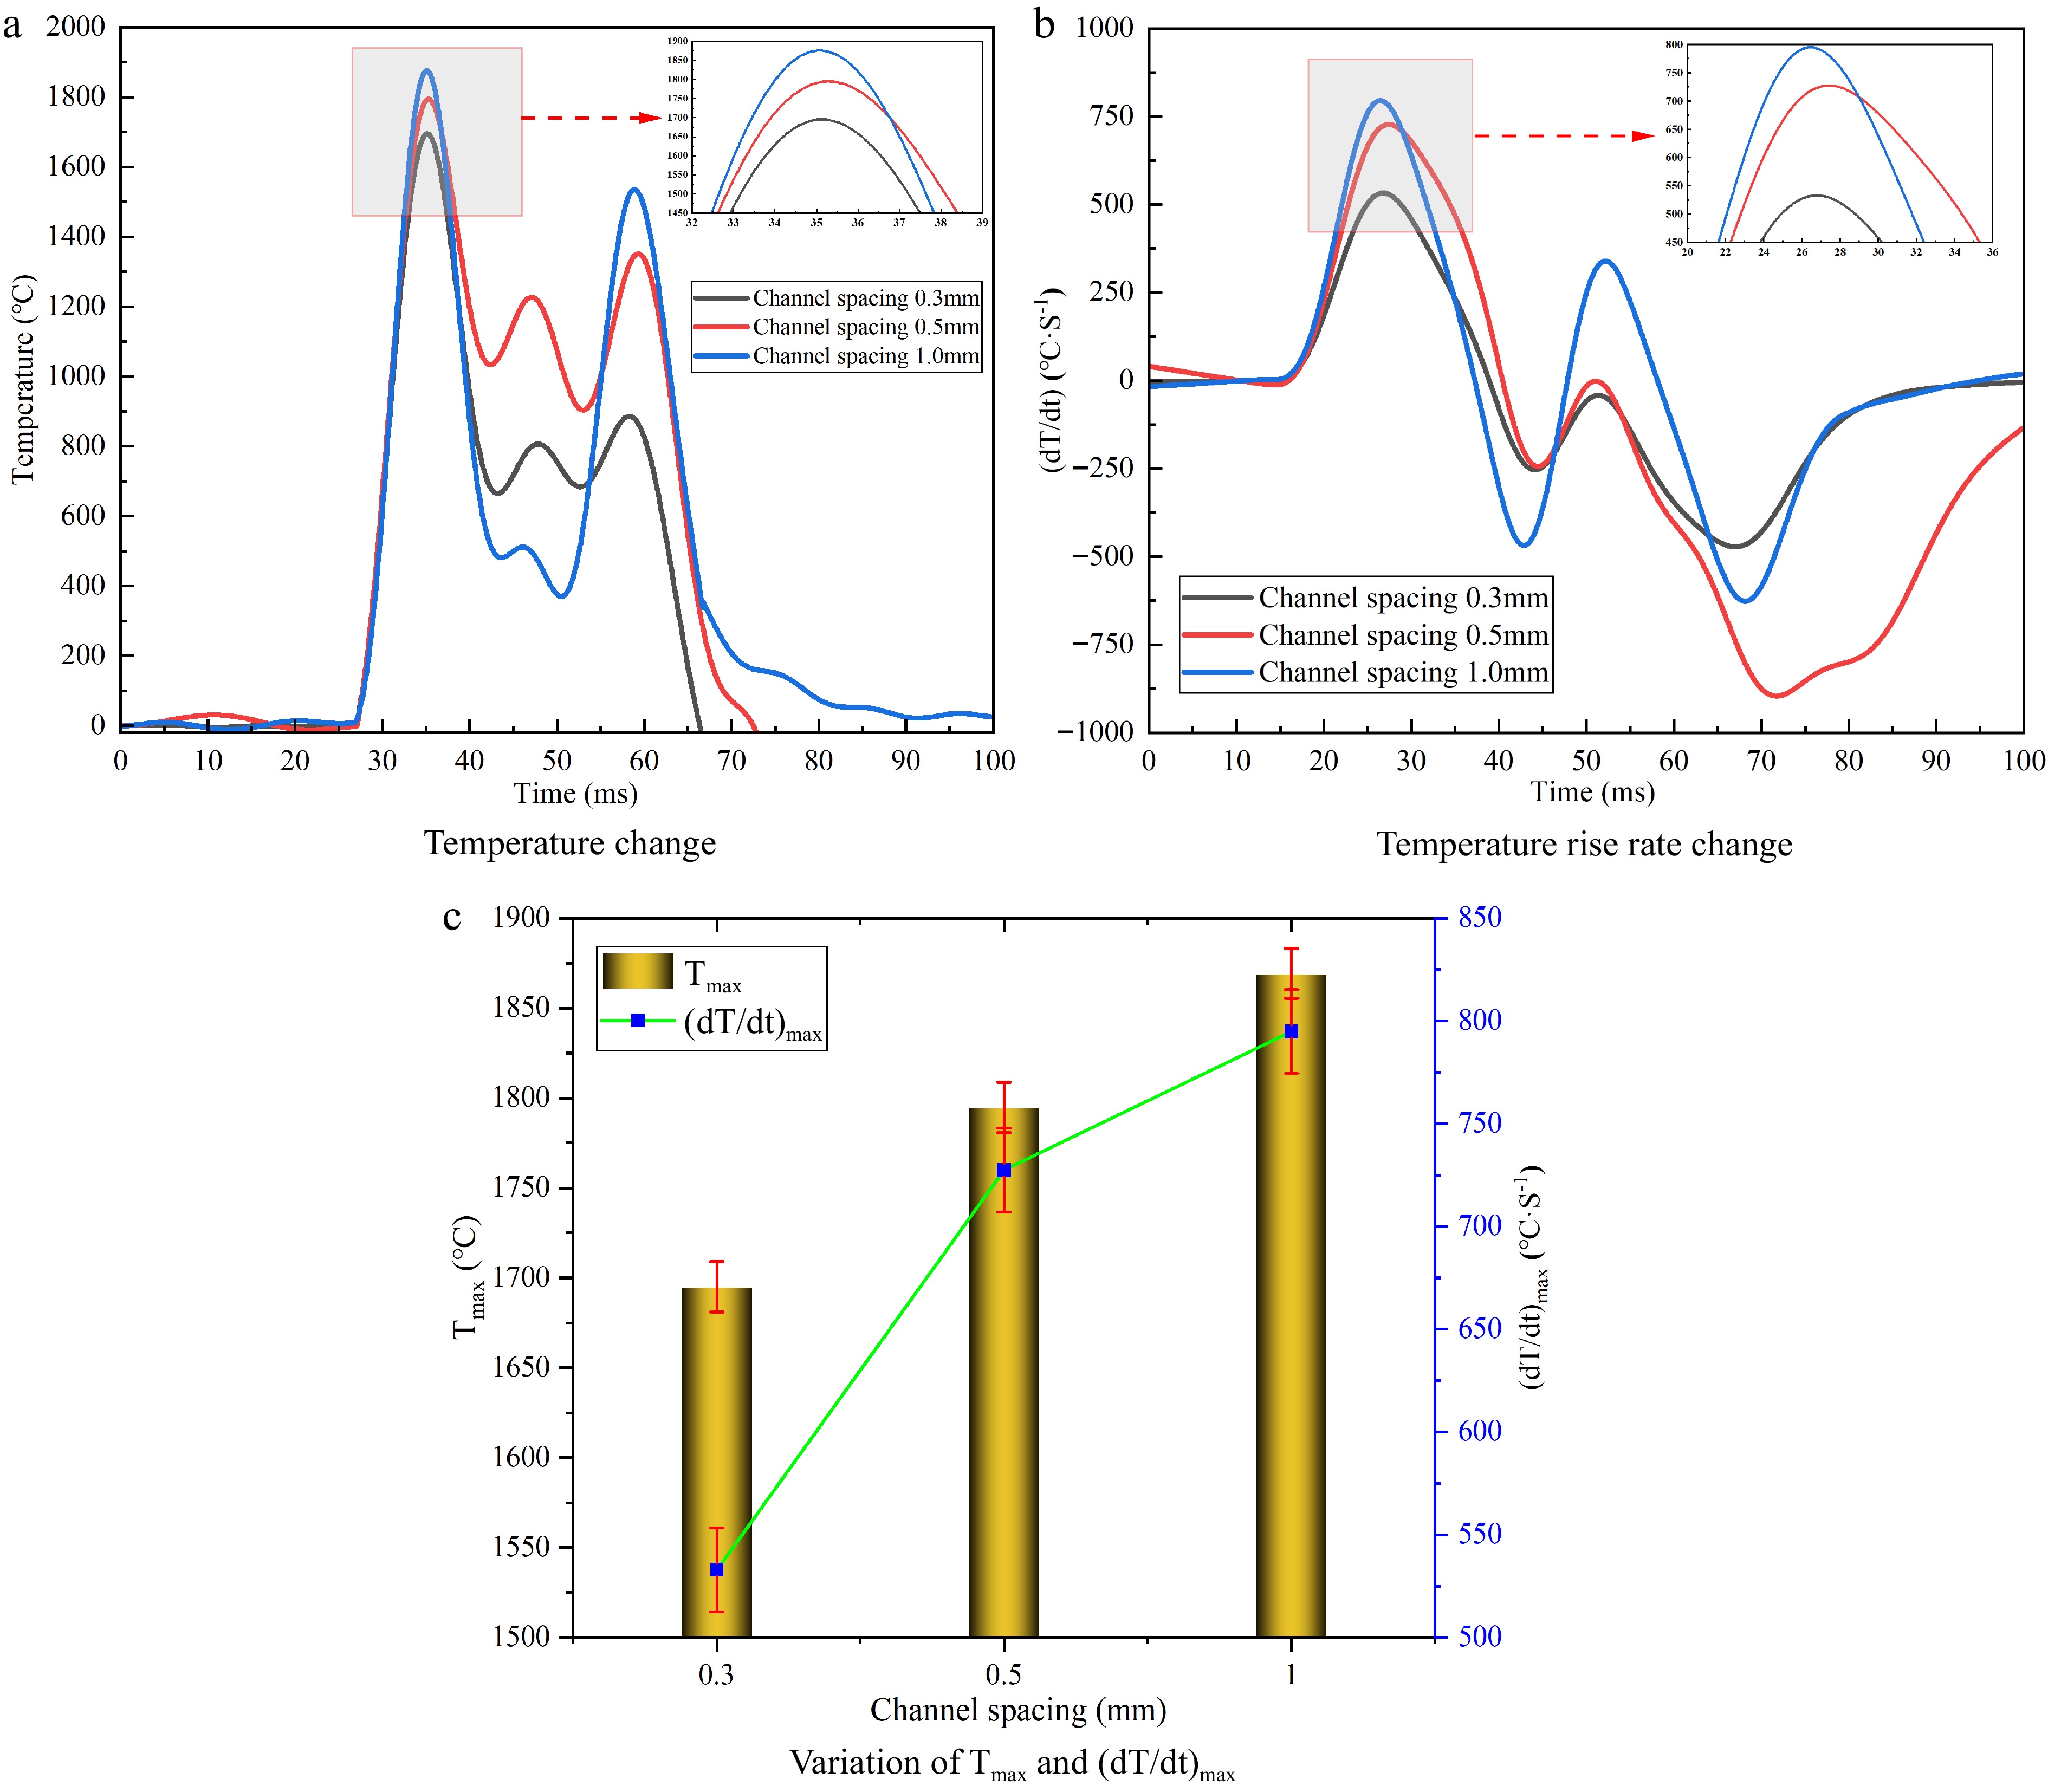
Figure 7.
Variation of temperature and temperature rise rate for different channel spacing.
Figures
(7)
Tables
(0)