-
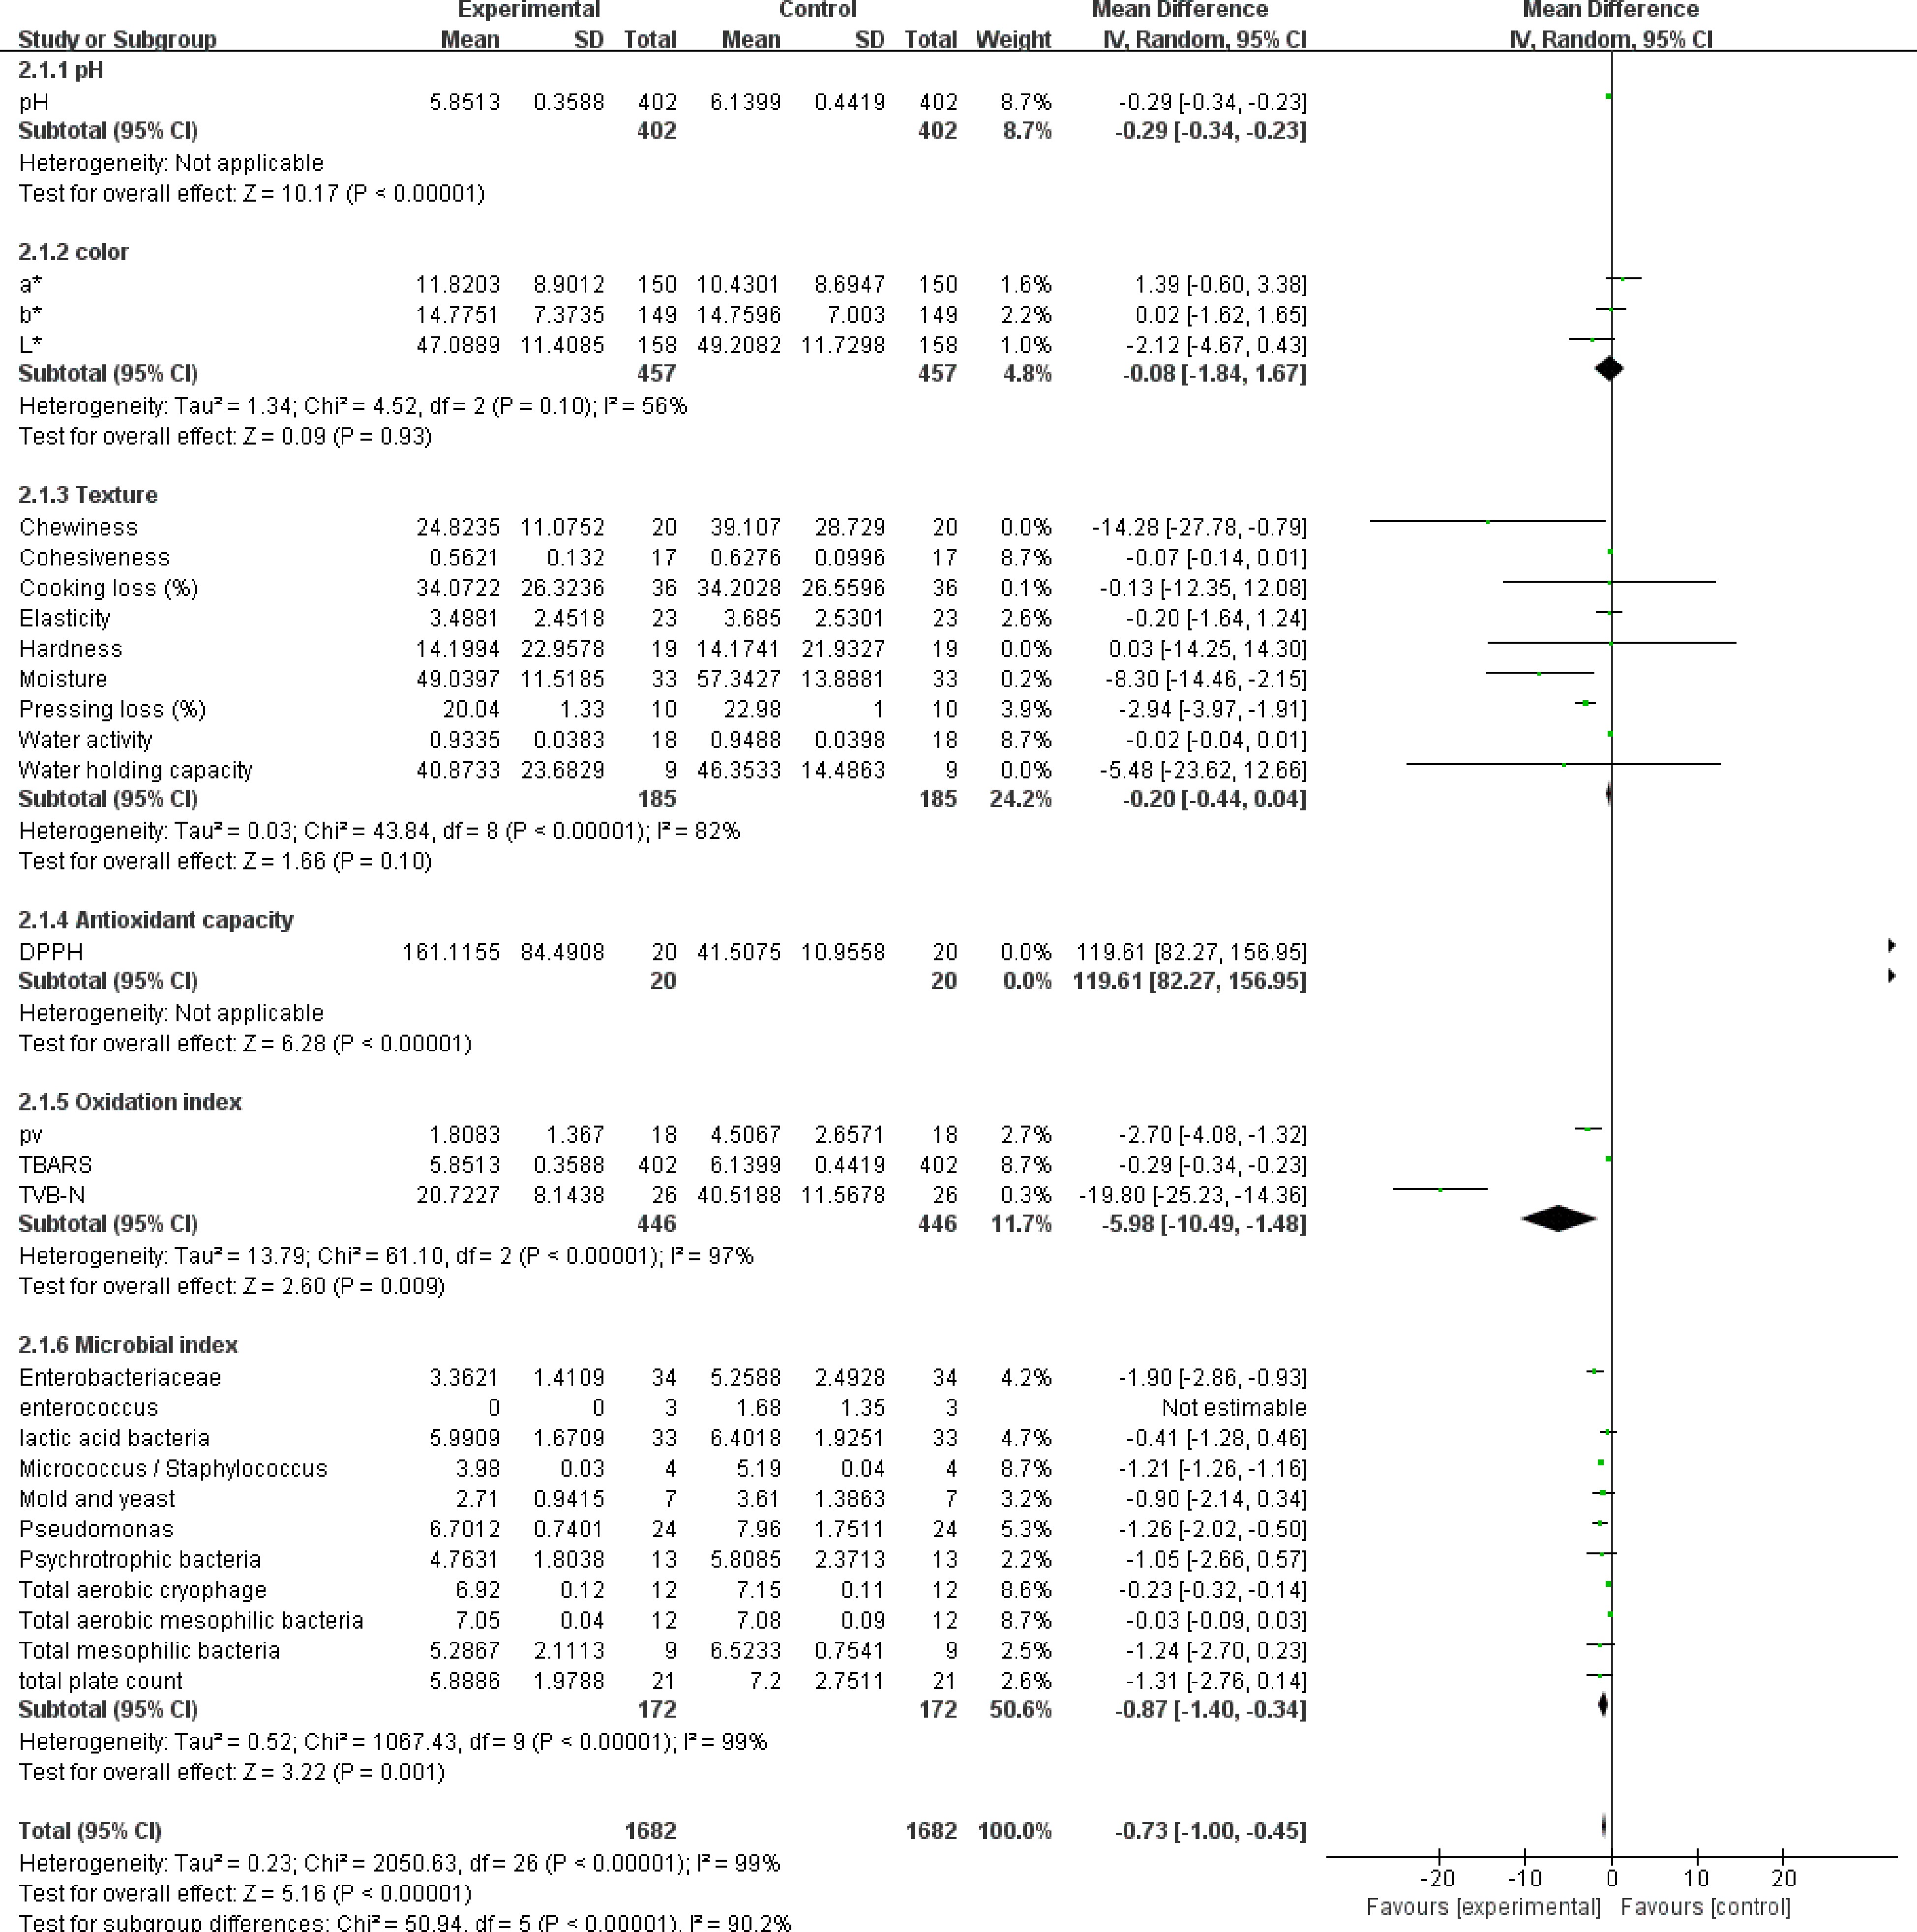
Figure 1.
The forest plot on the effect of NPE addition on the quality of meat products. The forest plot was extracted by RevMan Software (Version 5.4.1). The first author and year of publication is listed in the first column. (Complete list can be referred to from the References). CI, confidence interval; IV, inverse variance; S.D., standard deviation; std, standard. Vertical line in last column indicates no effect line, horizontal line indicates individual study—where the length determined by sample size. Diamond symbol indicates overall effect tendency. p-values following Chi2 stands for heterogeneity, whereas the p-value following Z stands for statistical significance.
-
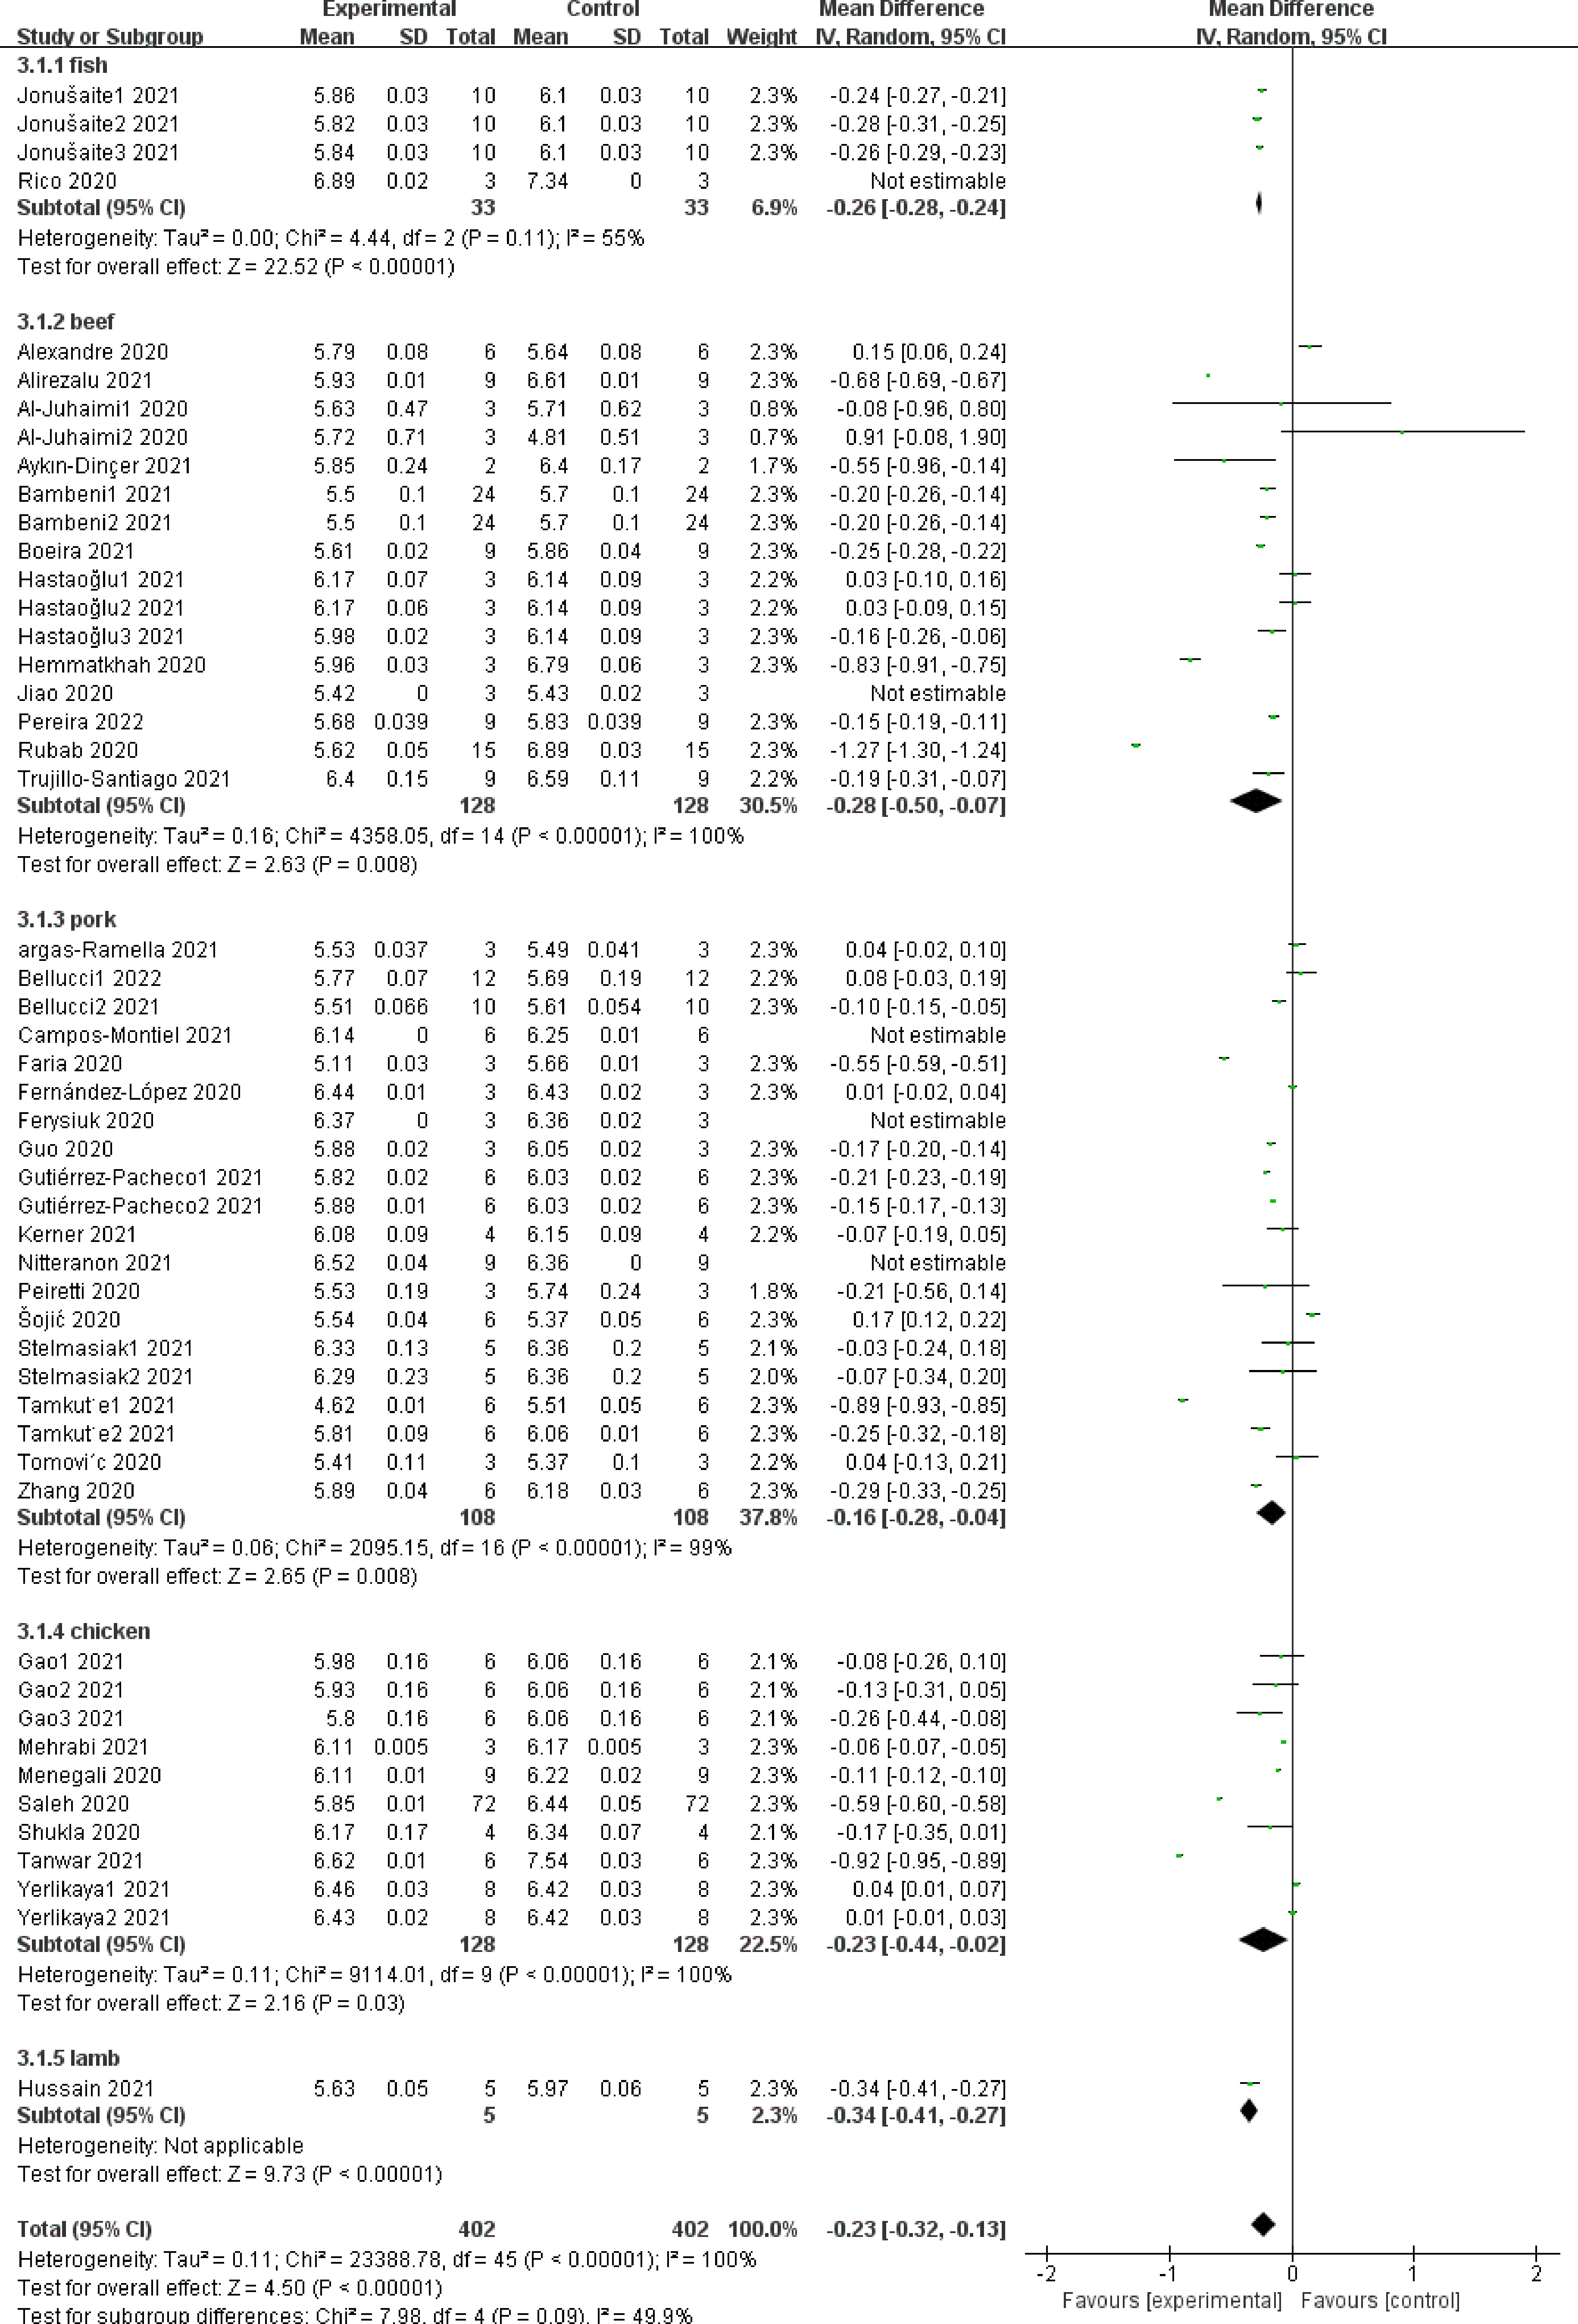
Figure 2.
The forest plot on the effect of NPE on pH of meat products produced with different raw materials.
-
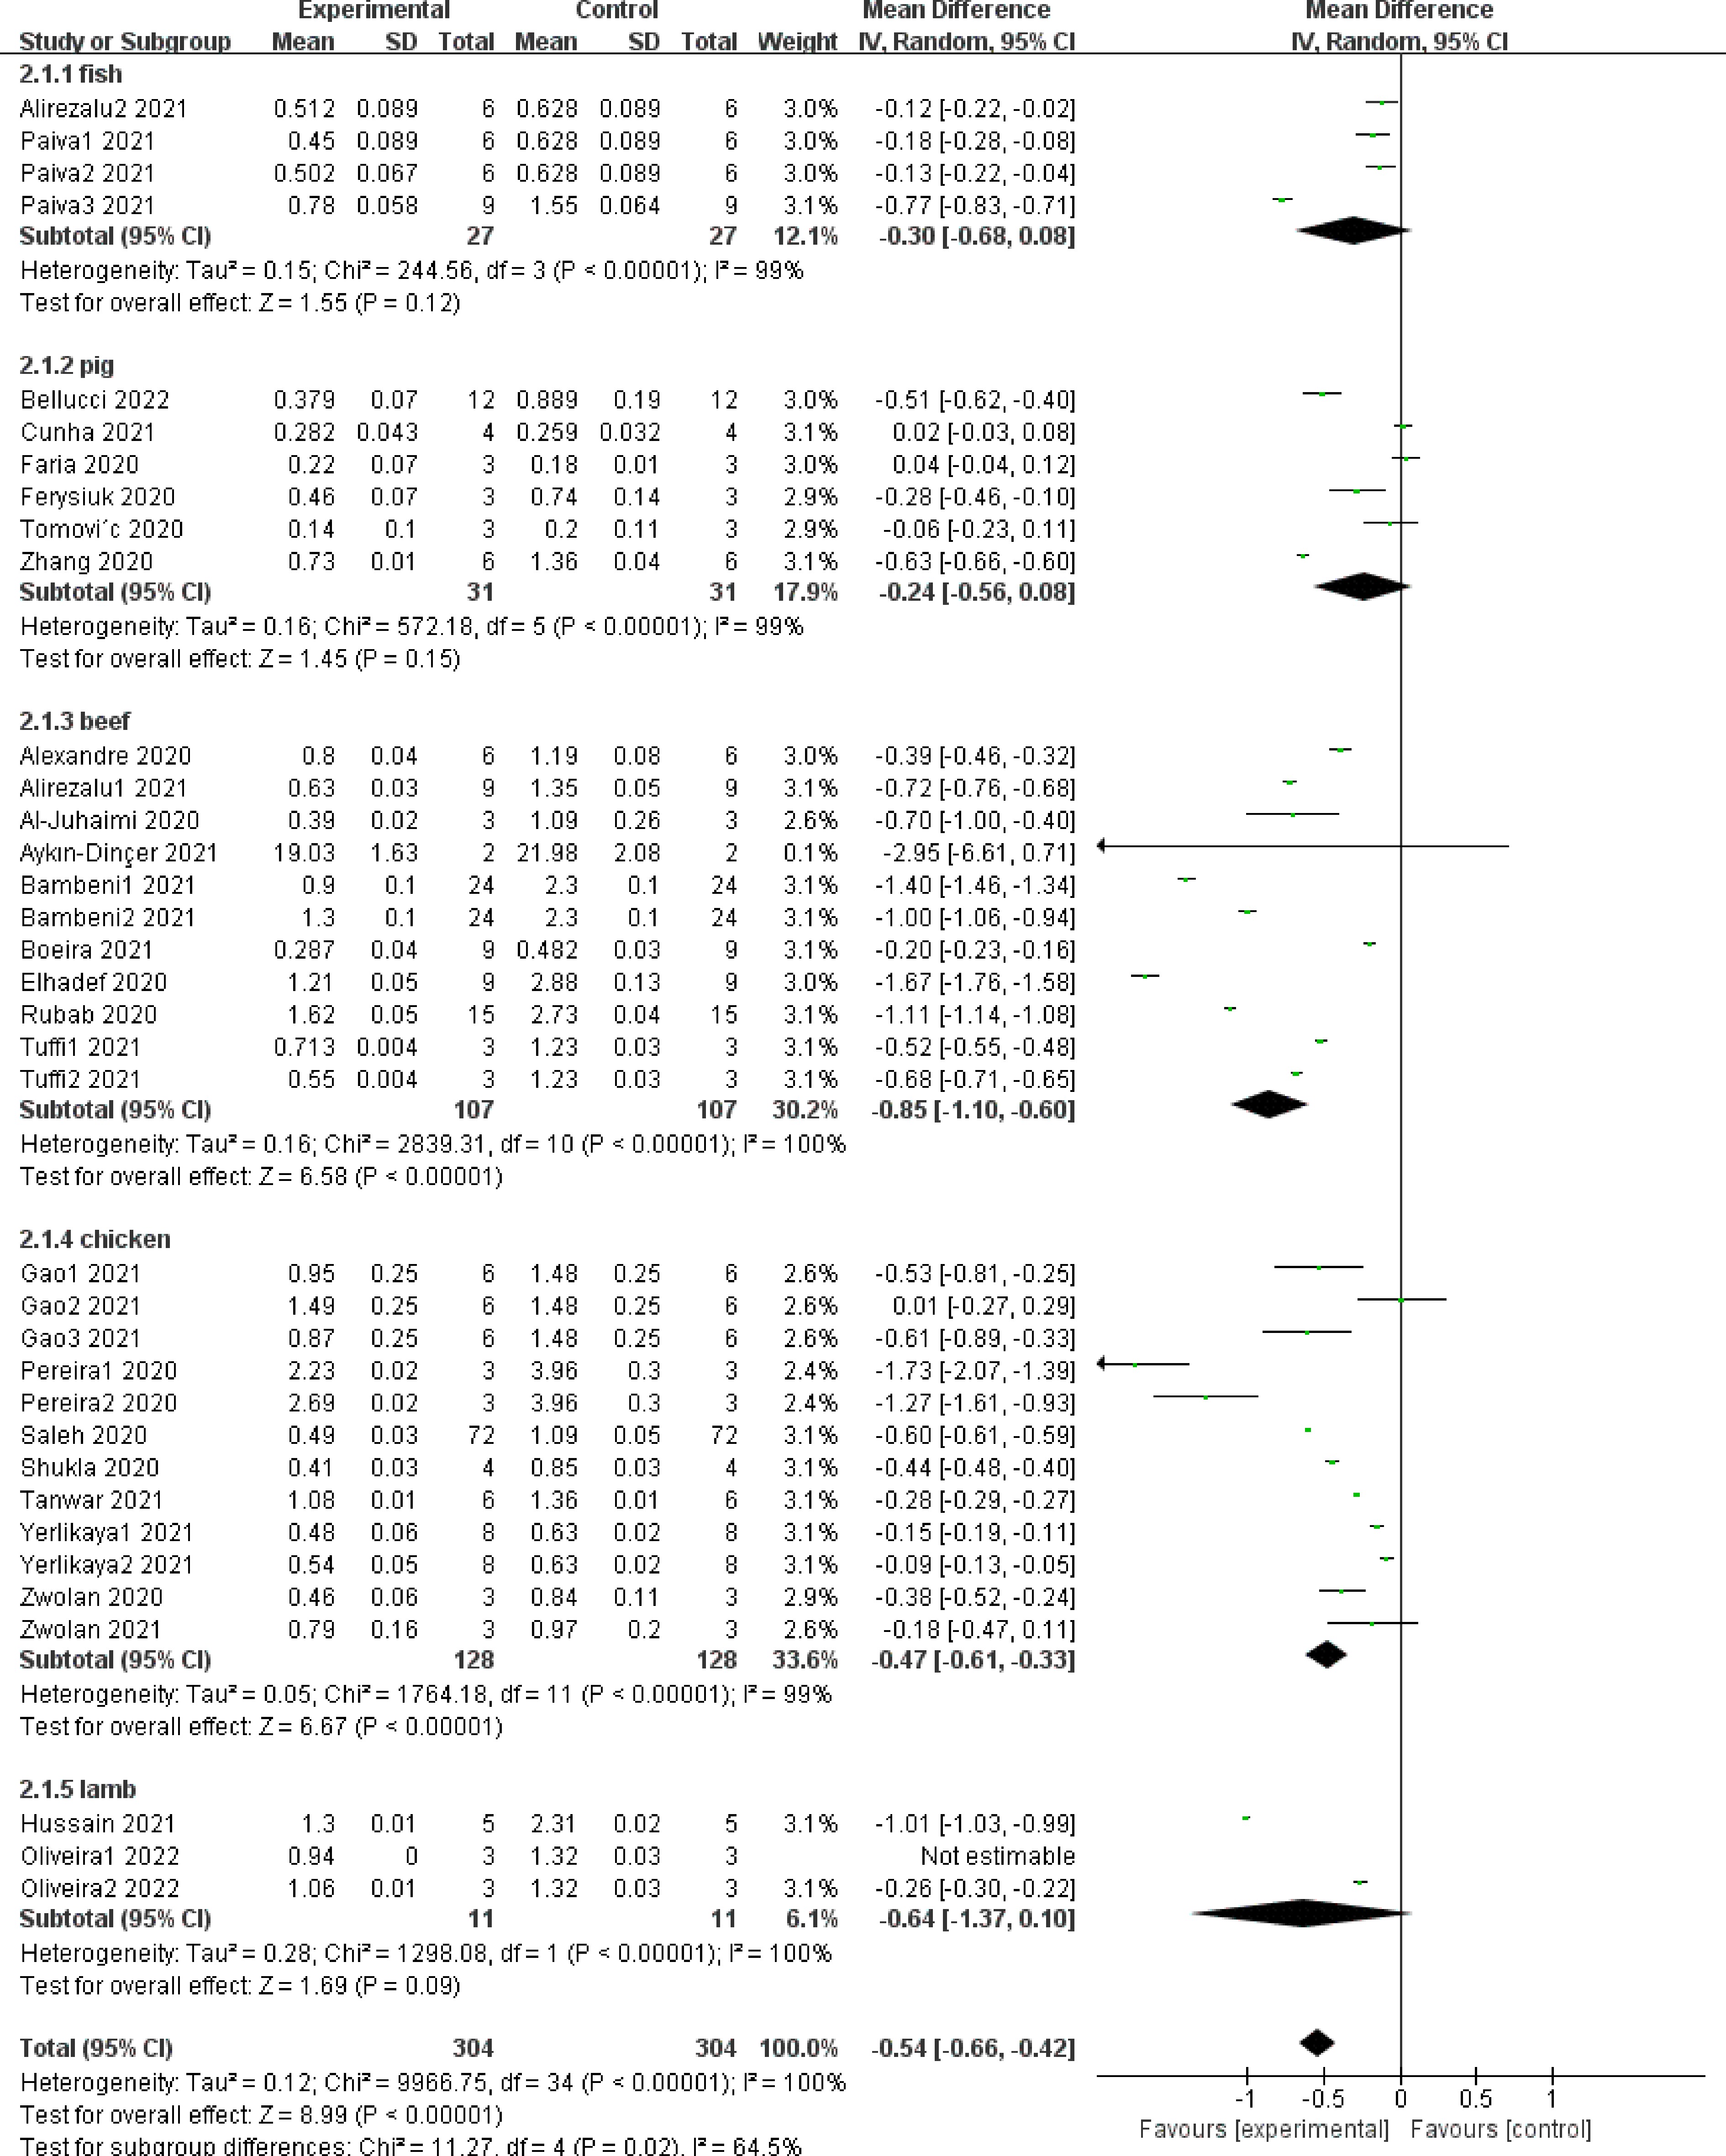
Figure 3.
Forest plot on the effect of NPE on TBARS of meat products produced with different raw materials.
-
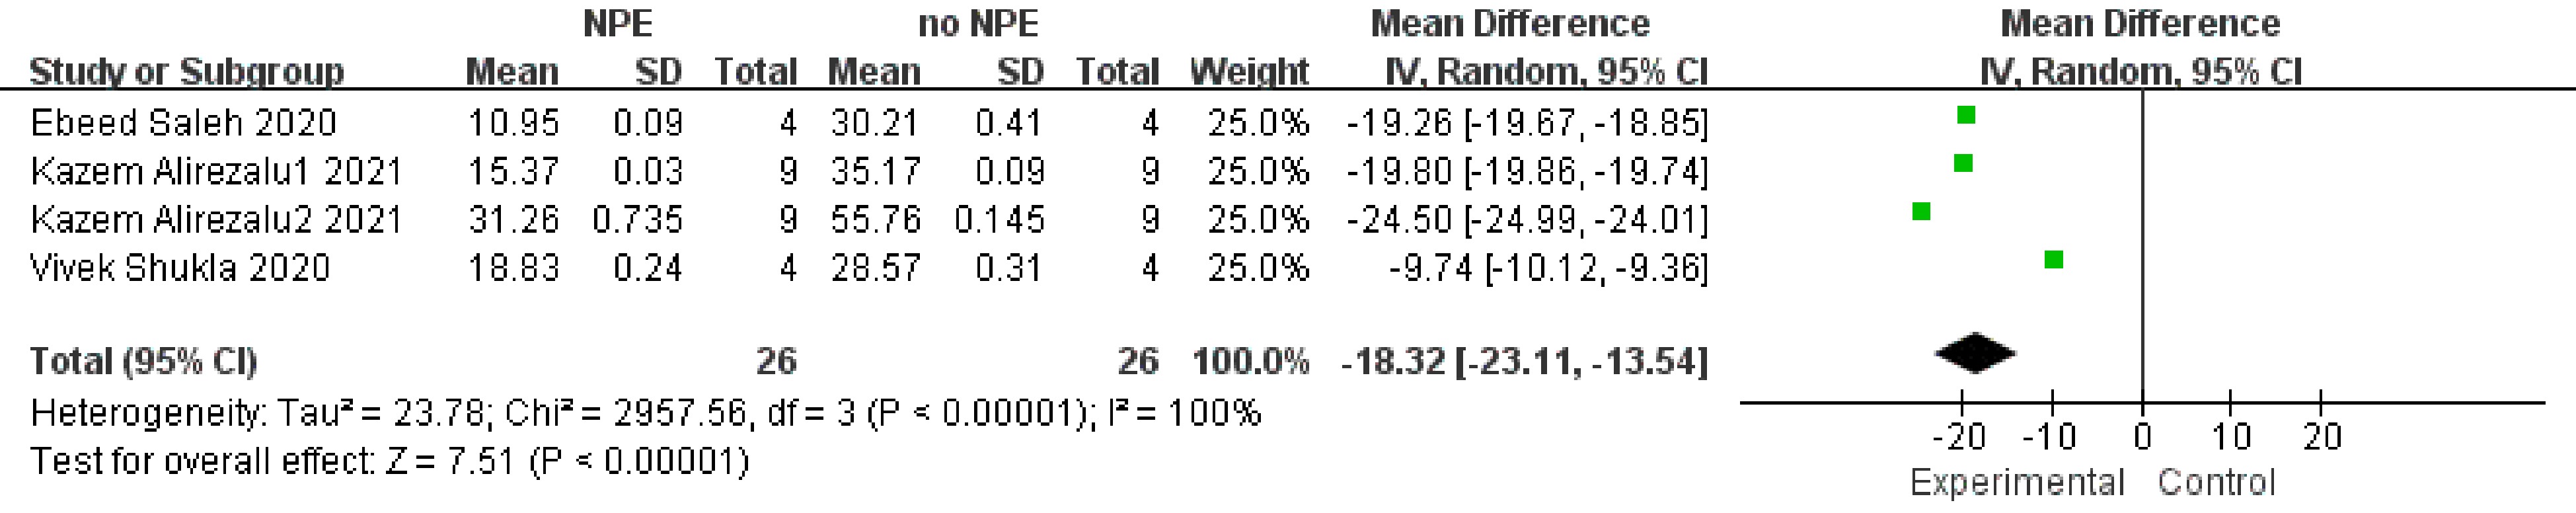
Figure 4.
Forest plot on the effect of NPE on TVBN of meat products produced with different raw materials.
-
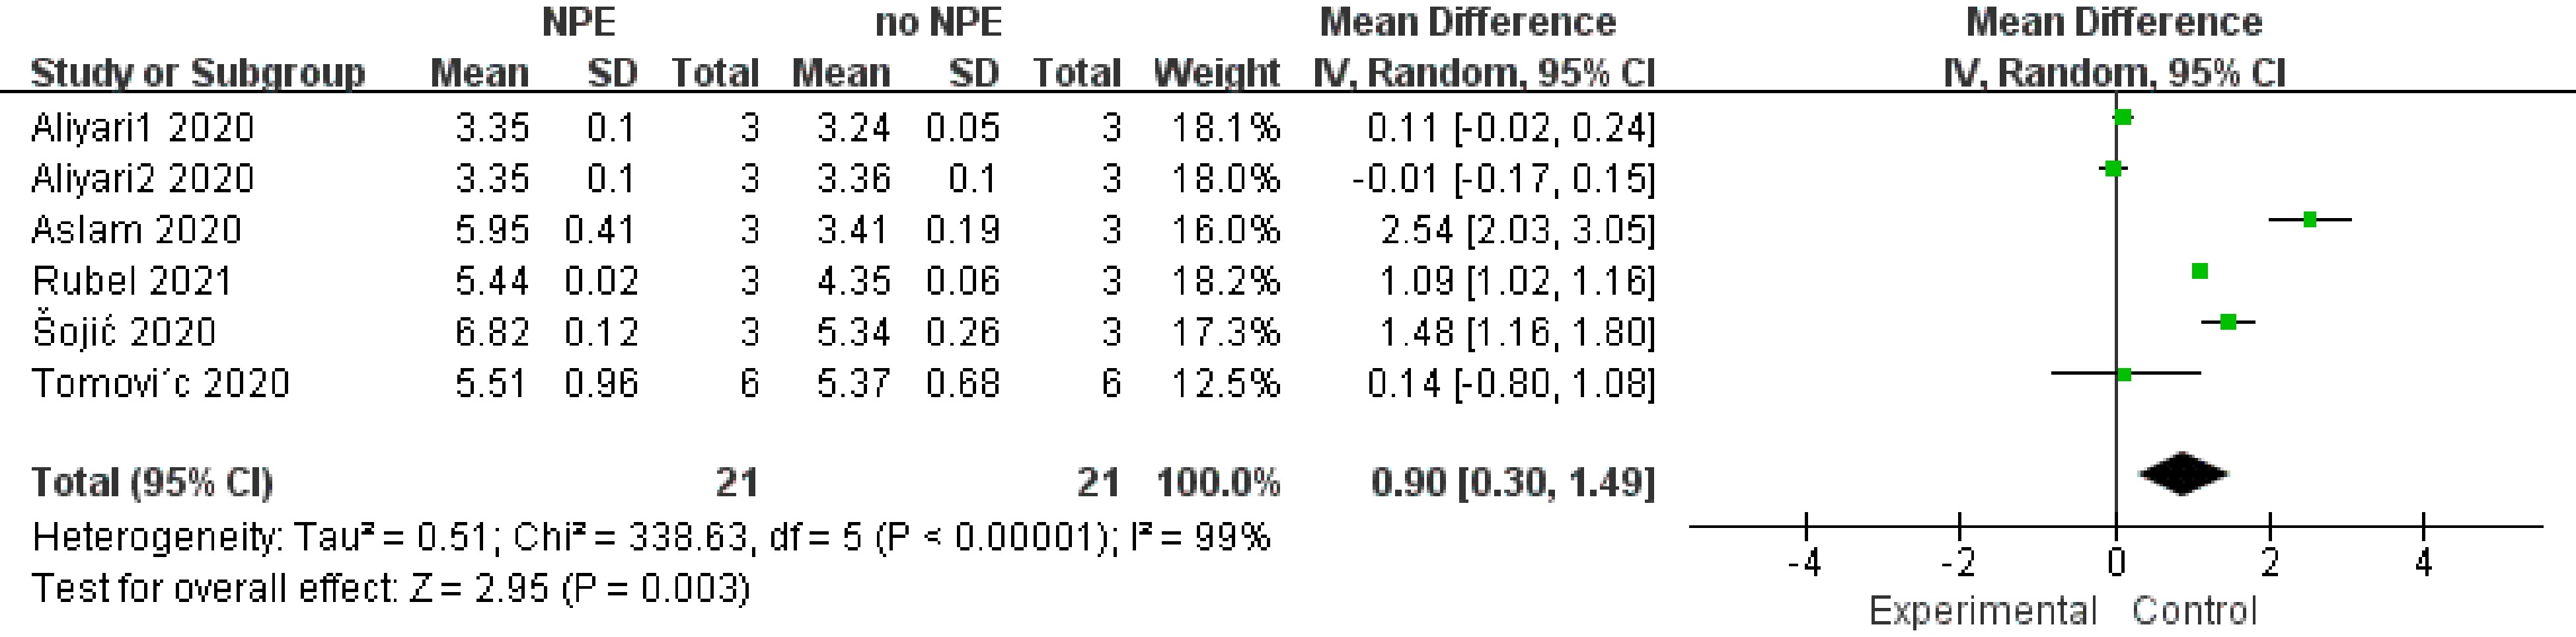
Figure 5.
The forest plot on the effect of NPE on total plate count (TPA) of meat products produced with different raw materials.
-
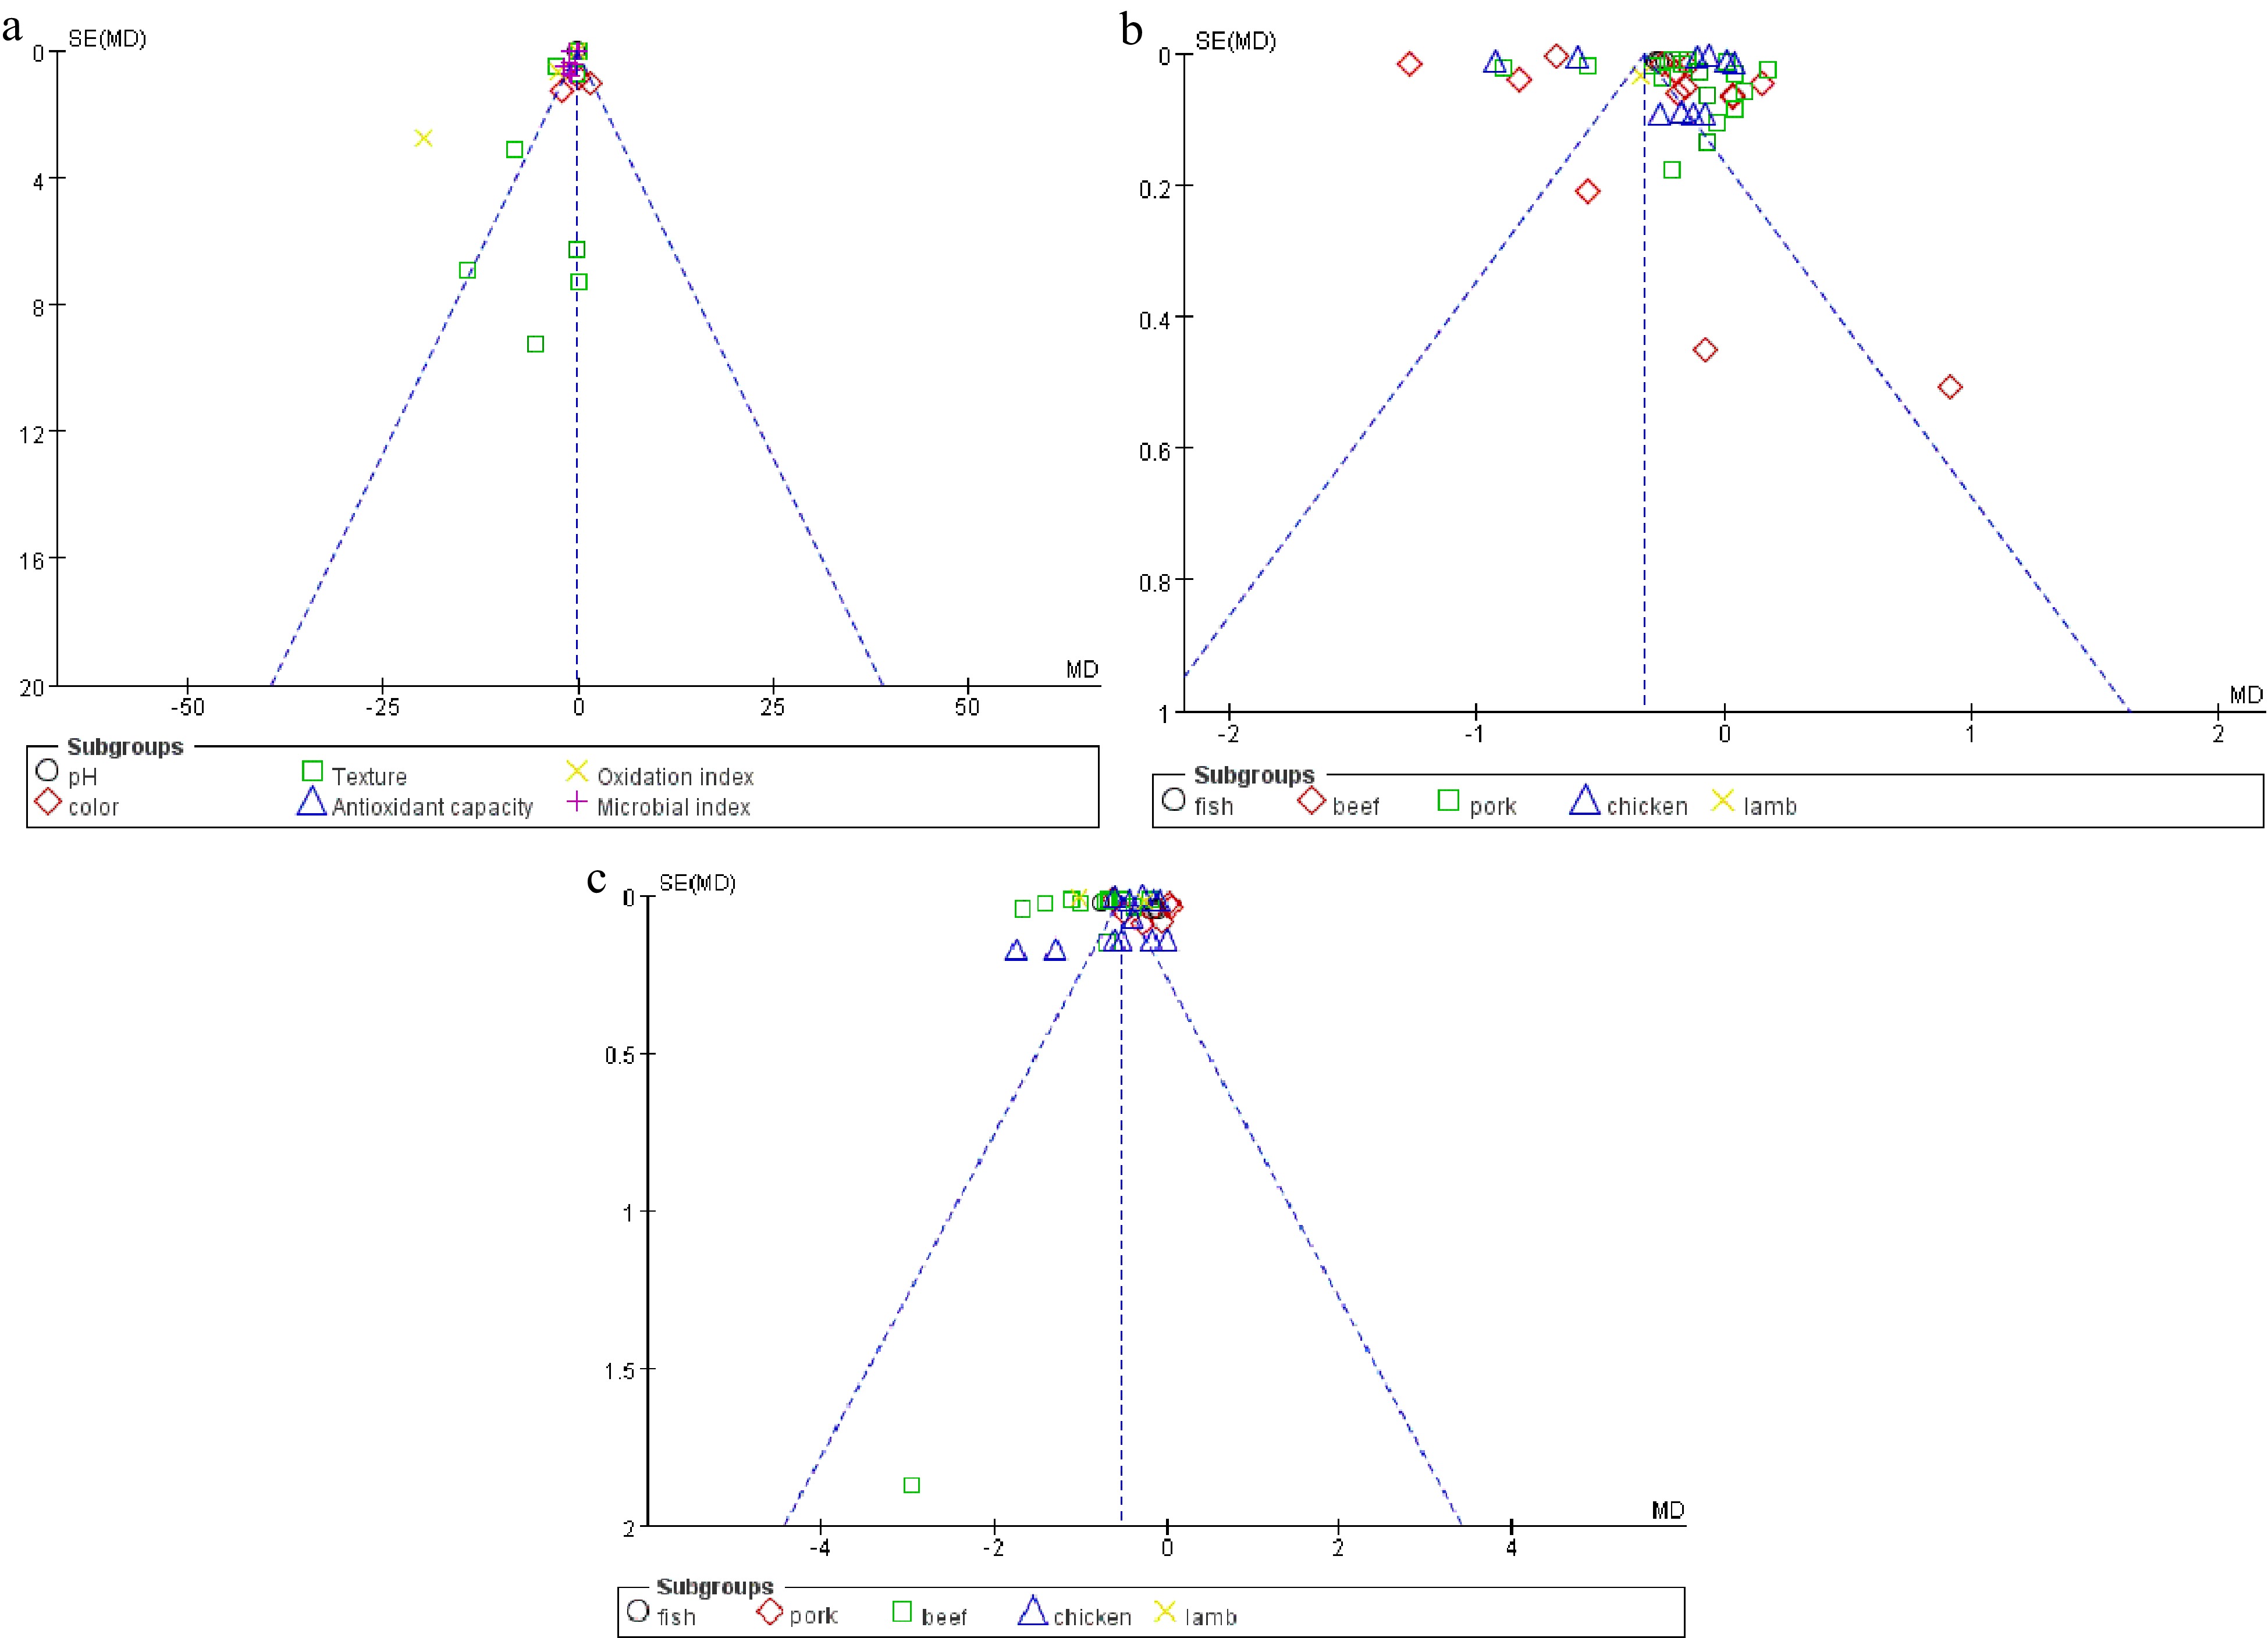
Figure 6.
Funnel plot of studies to detect the publication bias for the selected parameters. (a) Overall effect. (b) pH. (c) TBARS.
-
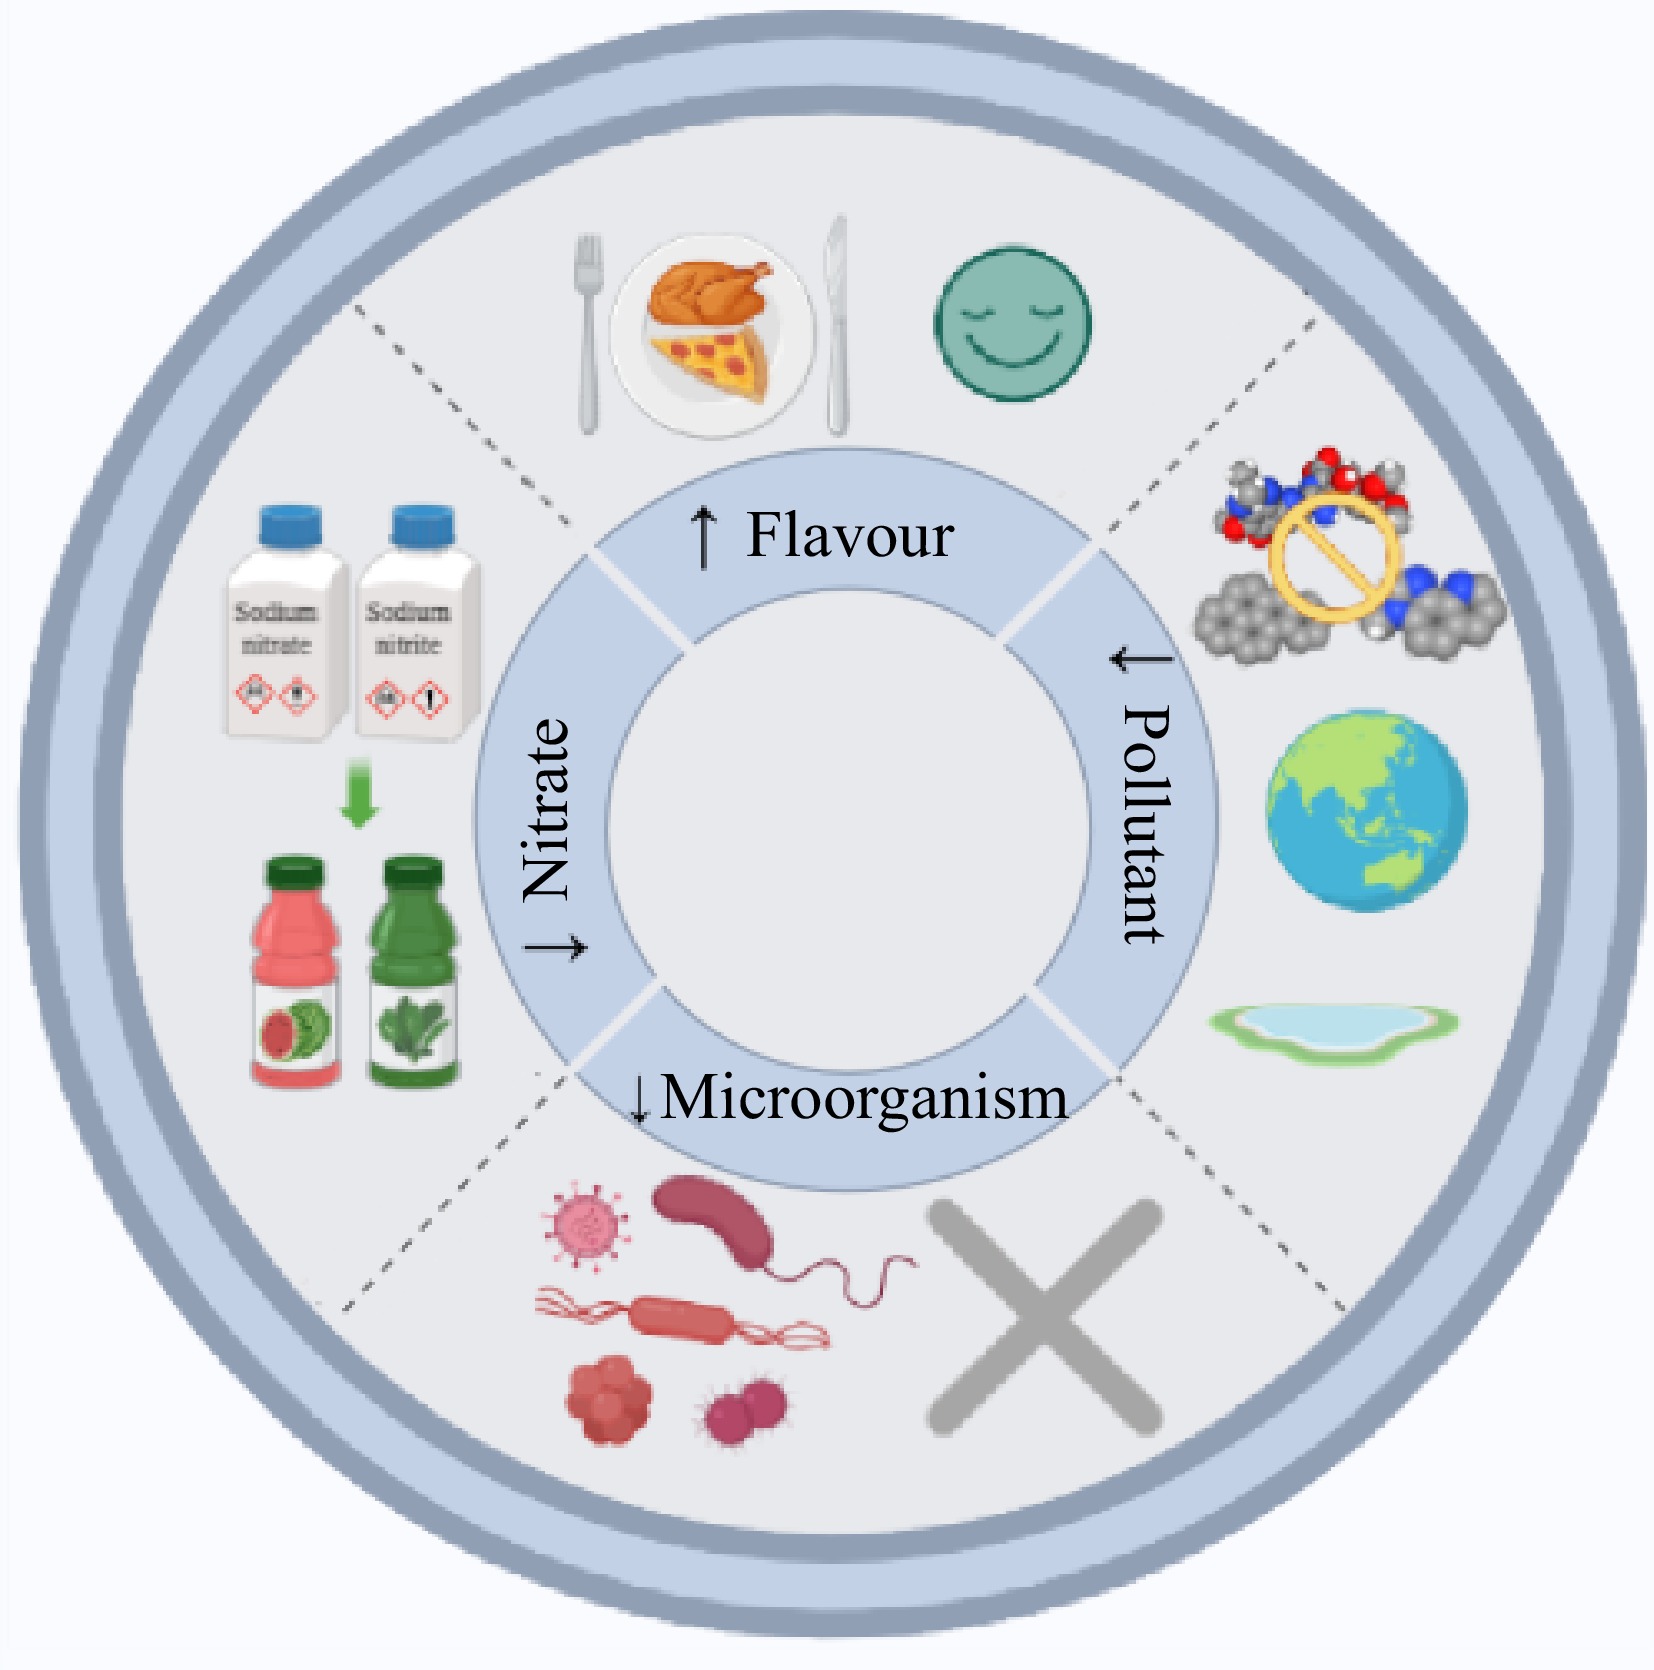
Figure 7.
Effect of NPE based on antioxidant properties on meat product quality.
-
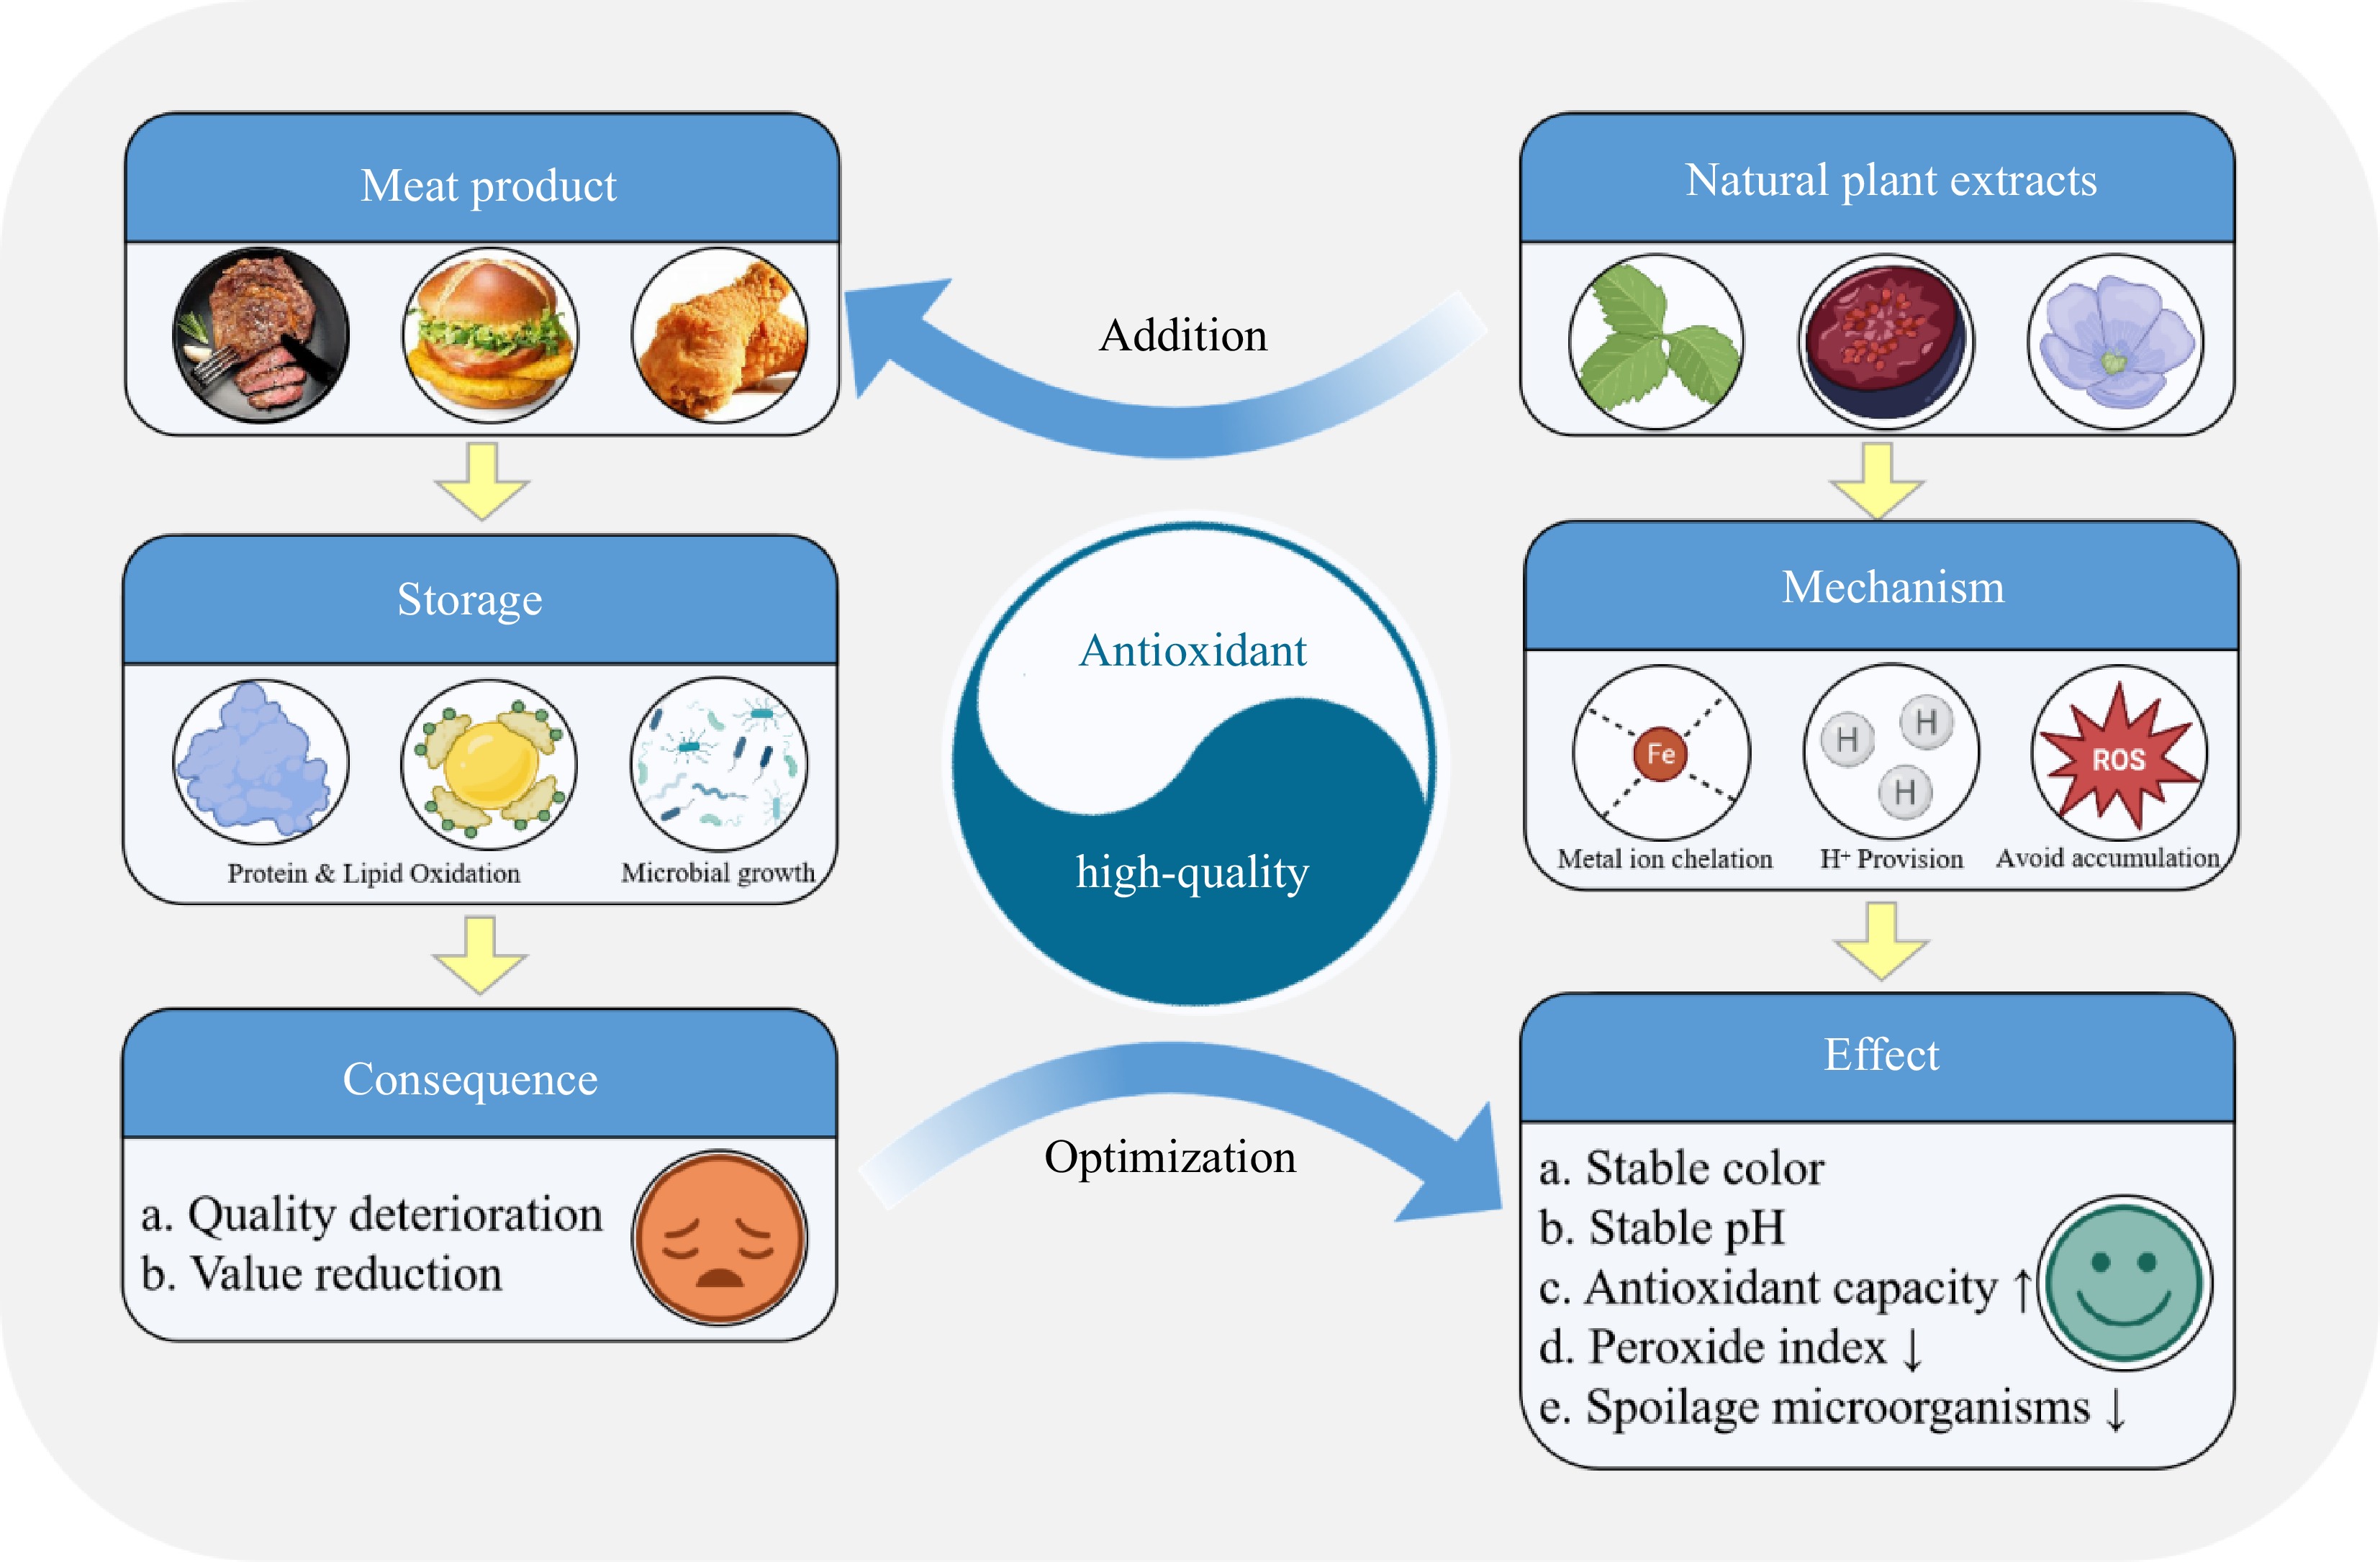
Figure 8.
Possible mechanism of NPE improving meat product quality.
-
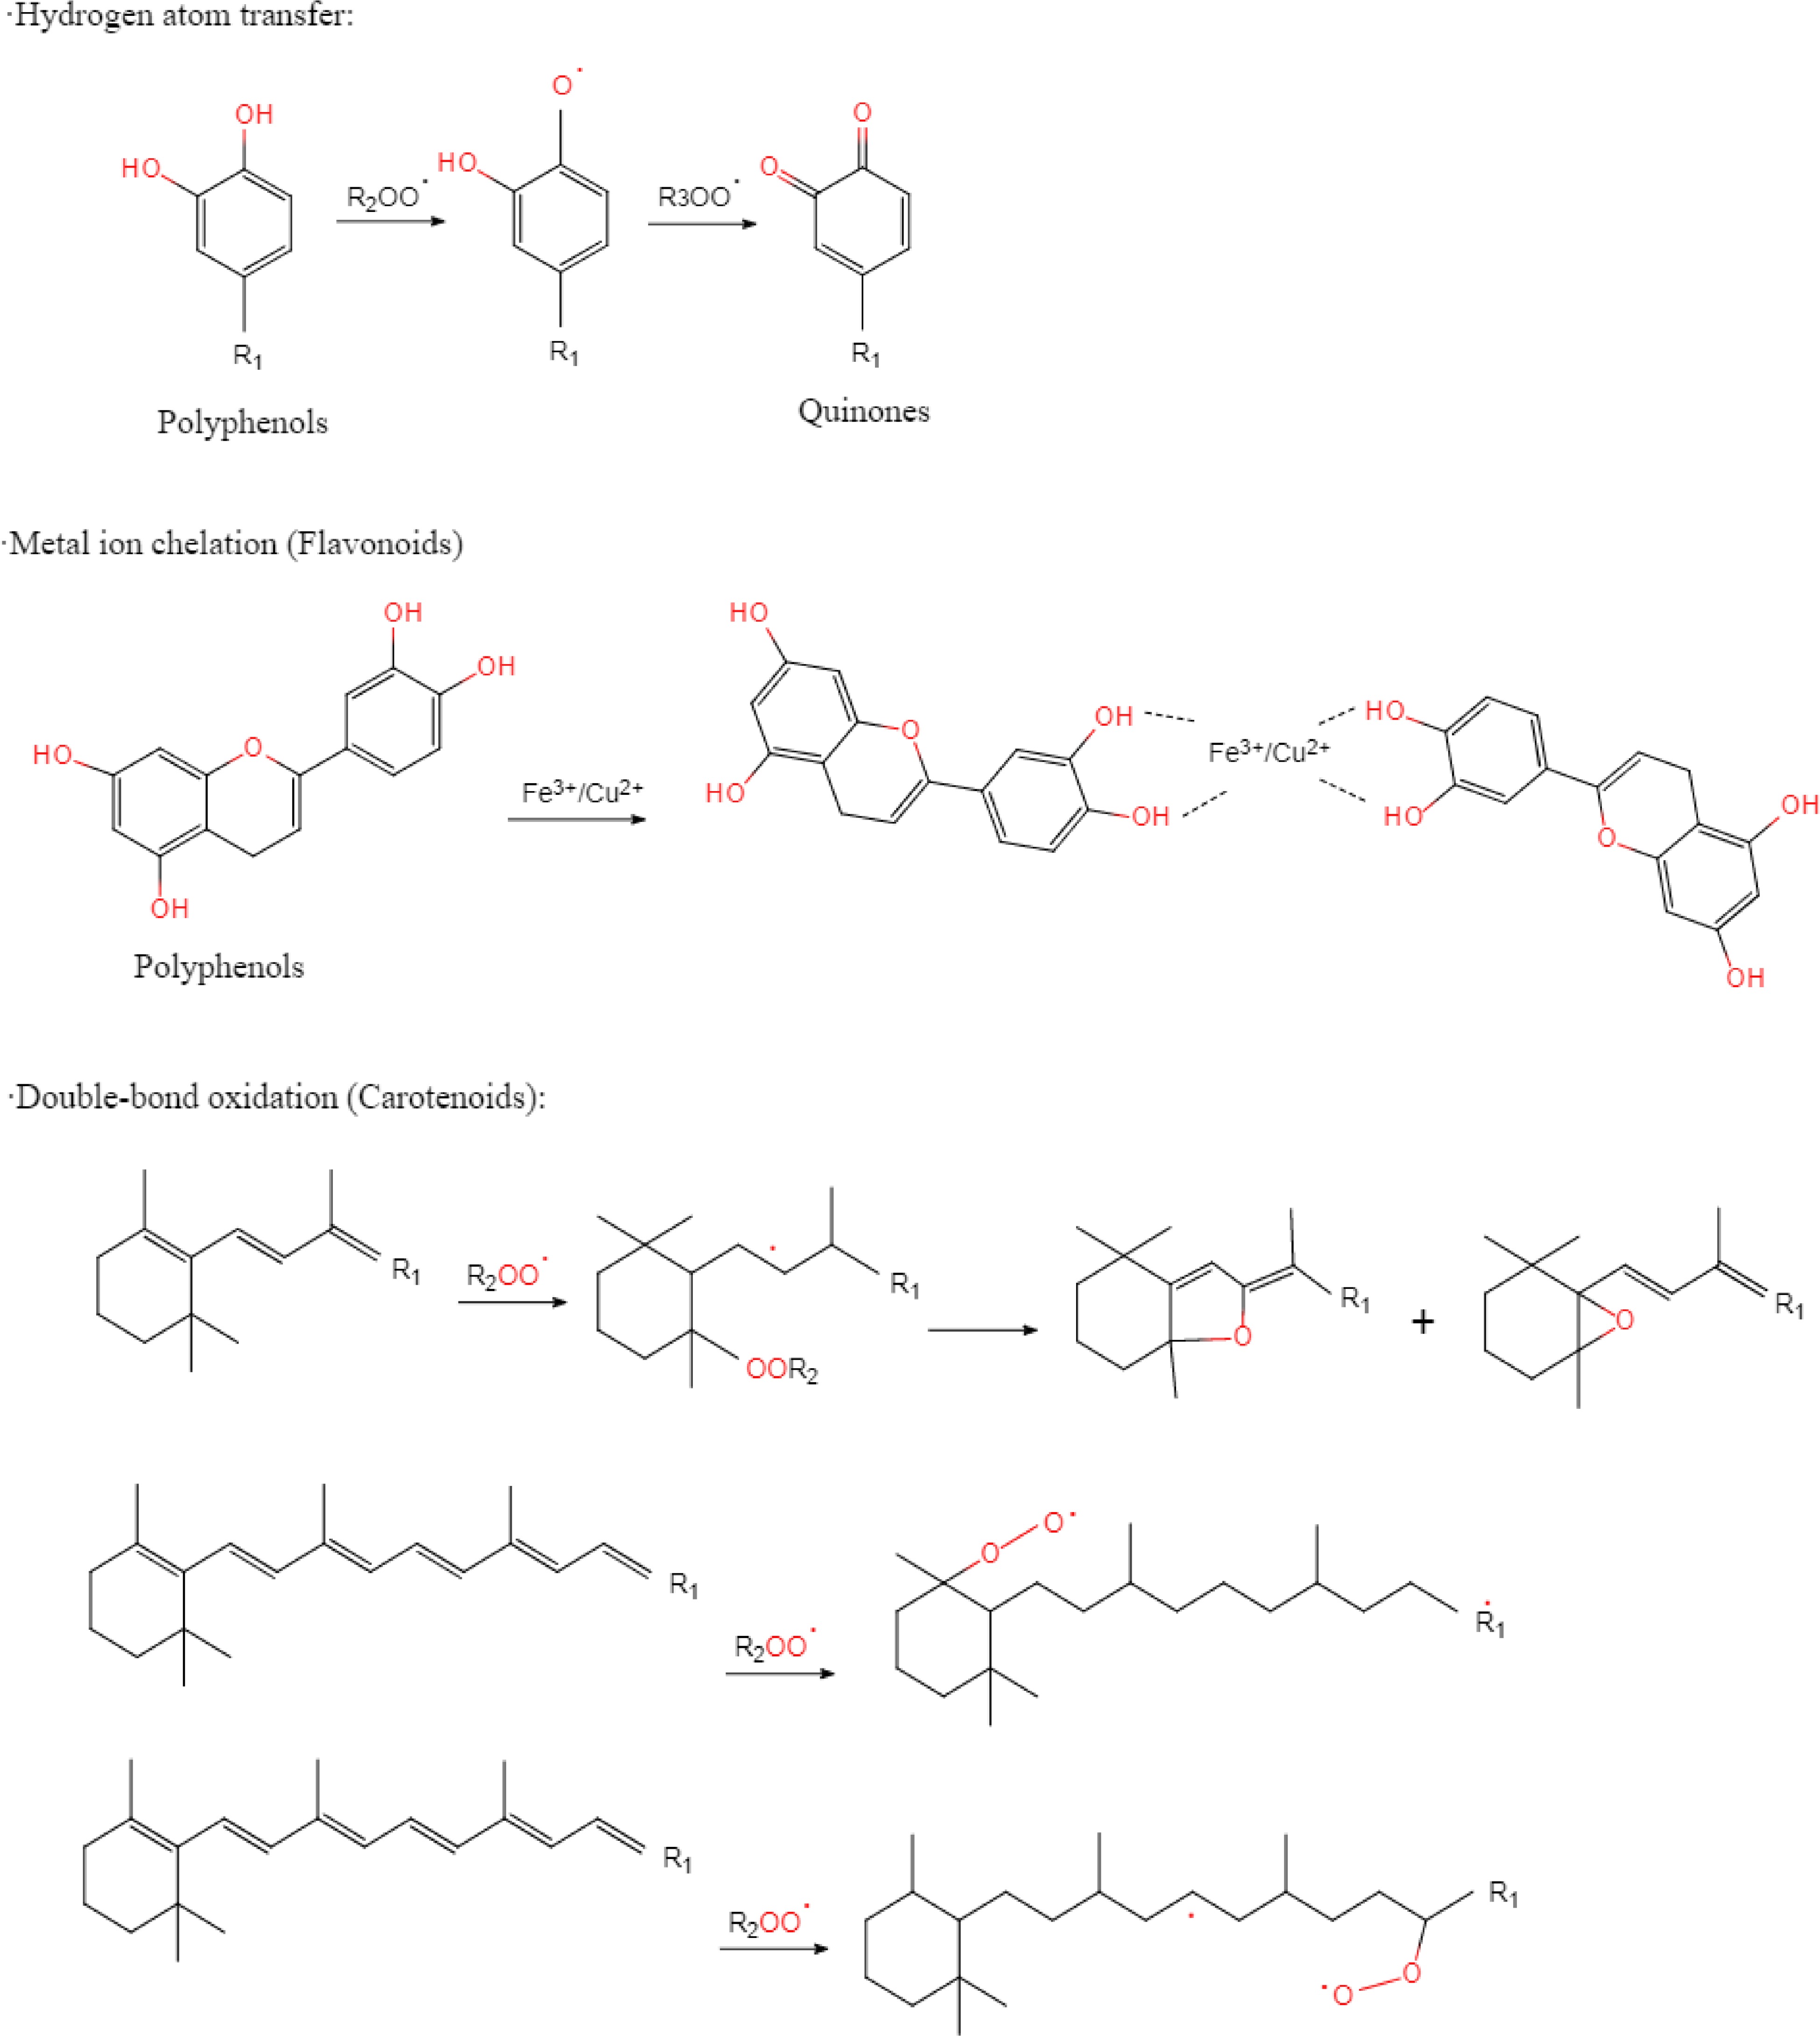
Figure 9.
Antioxidant mechanism of common bioactive substances in NPE.
-
Parameter MPQ N Mean Median Minimum Maximum SD Con NFE Con NFE Con NFE Con NFE Con NFE pH pH 402 6.14 5.85 5.86 6.10 4.62 4.81 6.89 7.54 0.4419 0.3588 Color a* 150 10.43 11.82 9.22 9.58 −0.97 1.61 33.86 45.27 8.6947 8.9012 b* 149 14.76 14.78 12.49 12.64 −0.43 −2.18 38.54 28.20 7.0030 7.3735 L* 158 49.21 47.09 48.87 47.49 20.18 9.33 76.00 78.06 11.7298 11.4085 Texture Chewiness 20 39.11 24.82 67.20 26.14 14.67 15.10 1654.00 1675.00 28.7290 11.0752 Cohesiveness 17 0.63 0.56 0.57 0.49 0.22 0.18 0.77 0.76 0.0996 0.1320 CL, % 36 34.20 34.07 50.70 48.17 3.82 7.74 77.31 79.24 26.5596 26.3236 Elasticity 23 3.67 3.49 3.45 3.99 0.51 0.49 6.61 6.96 2.5301 2.4518 Hardness, N 19 14.17 14.20 20.63 10.24 2.34 4.89 55.35 67.62 21.9327 22.9578 Moisture, % 33 57.34 49.04 64.37 55.54 31.63 29.43 73.69 73.73 13.8881 11.5185 PL, % 10 22.98 1.33 22.98 20.04 22.98 20.04 22.98 20.04 1.0000 0.2700 Water activity 18 0.95 0.93 0.97 0.94 0.88 0.87 1.00 0.99 0.0398 0.0383 WHC, % 9 46.35 40.87 36.70 26.95 36.70 23.30 65.66 72.37 14.4863 23.6829 Antioxidant capacity DPPH, IC50 (μg) 20 41.51 161.12 21.22 48.74 4.84 11.18 45.17 228.03 10.9558 84.4908 Oxidation index Pv, mmol/kg 18 4.51 1.81 1.13 1.03 1.13 0.53 7.11 4.47 2.6571 1.3670 TBARs, mg/kg 402 6.14 5.85 0.72 1.23 0.14 0.18 19.03 21.98 0.4419 0.3588 TVB-N, mg/100g 32.80 21.02 17.10 32.69 10.95 28.57 31.26 55.76 1.8827 7.6660 Microbial index, log10 cfu/g Enterobacteriaceae 34 5.26 3.36 3.48 2.50 1.34 0.99 5.81 4.20 2.4928 1.4109 Enterococcus 3 1.68 0.00 0.84 0.00 0.00 0.00 1.68 0.00 1.3500 0.0000 LAB 33 6.40 5.99 4.98 3.62 4.07 3.00 6.55 6.54 1.9251 1.6709 Micrococcus/
staphylococcus4 5.19 3.98 5.19 3.98 5.19 3.98 5.19 3.98 0.0400 0.0300 Mold and yeast 7 3.61 2.71 3.43 2.59 2.13 1.71 4.72 3.46 1.3863 0.9415 Pseudomonas 24 7.96 6.70 6.38 6.31 6.38 6.31 6.38 6.31 1.7511 0.7401 Psychrotrophic 13 5.81 4.76 5.10 4.19 1.30 0.00 5.37 5.10 2.3713 1.8038 TAC 12 7.15 6.92 7.15 6.92 7.15 6.92 7.15 6.92 0.1100 0.1200 TAMB 12 7.08 7.05 7.08 7.05 7.08 7.05 7.08 7.05 0.0900 0.0400 TMB 9 6.52 5.29 7.05 6.03 5.97 4.40 7.05 6.08 0.7541 2.1113 TPC 21 7.20 5.89 5.48 3.88 3.35 3.24 6.82 5.37 2.7511 1.9788 MPQ: Meat product quality; N: number of comparisons; SD: standard deviation; Con: control; NFE: Natural plant extracts; CL: cooking loss; PL: press loss; WHC: Water holding capacity; DPPH: DPPH radical scavenging activity; Pv: Peroxide value; TBARs: Thiobarbituric acid reactant; TVB-N, Volatile base nitrogen; LAB: lactic acid bacteria; TAC: Total aerobic cryophage; TAMB: Total aerobic mesophilic bacteria; TMB; Total mesophilic bacteria; TPC: Total plate count. Table 1.
Descriptive statistical results of all indicators included in MA.
Figures
(9)
Tables
(1)