-
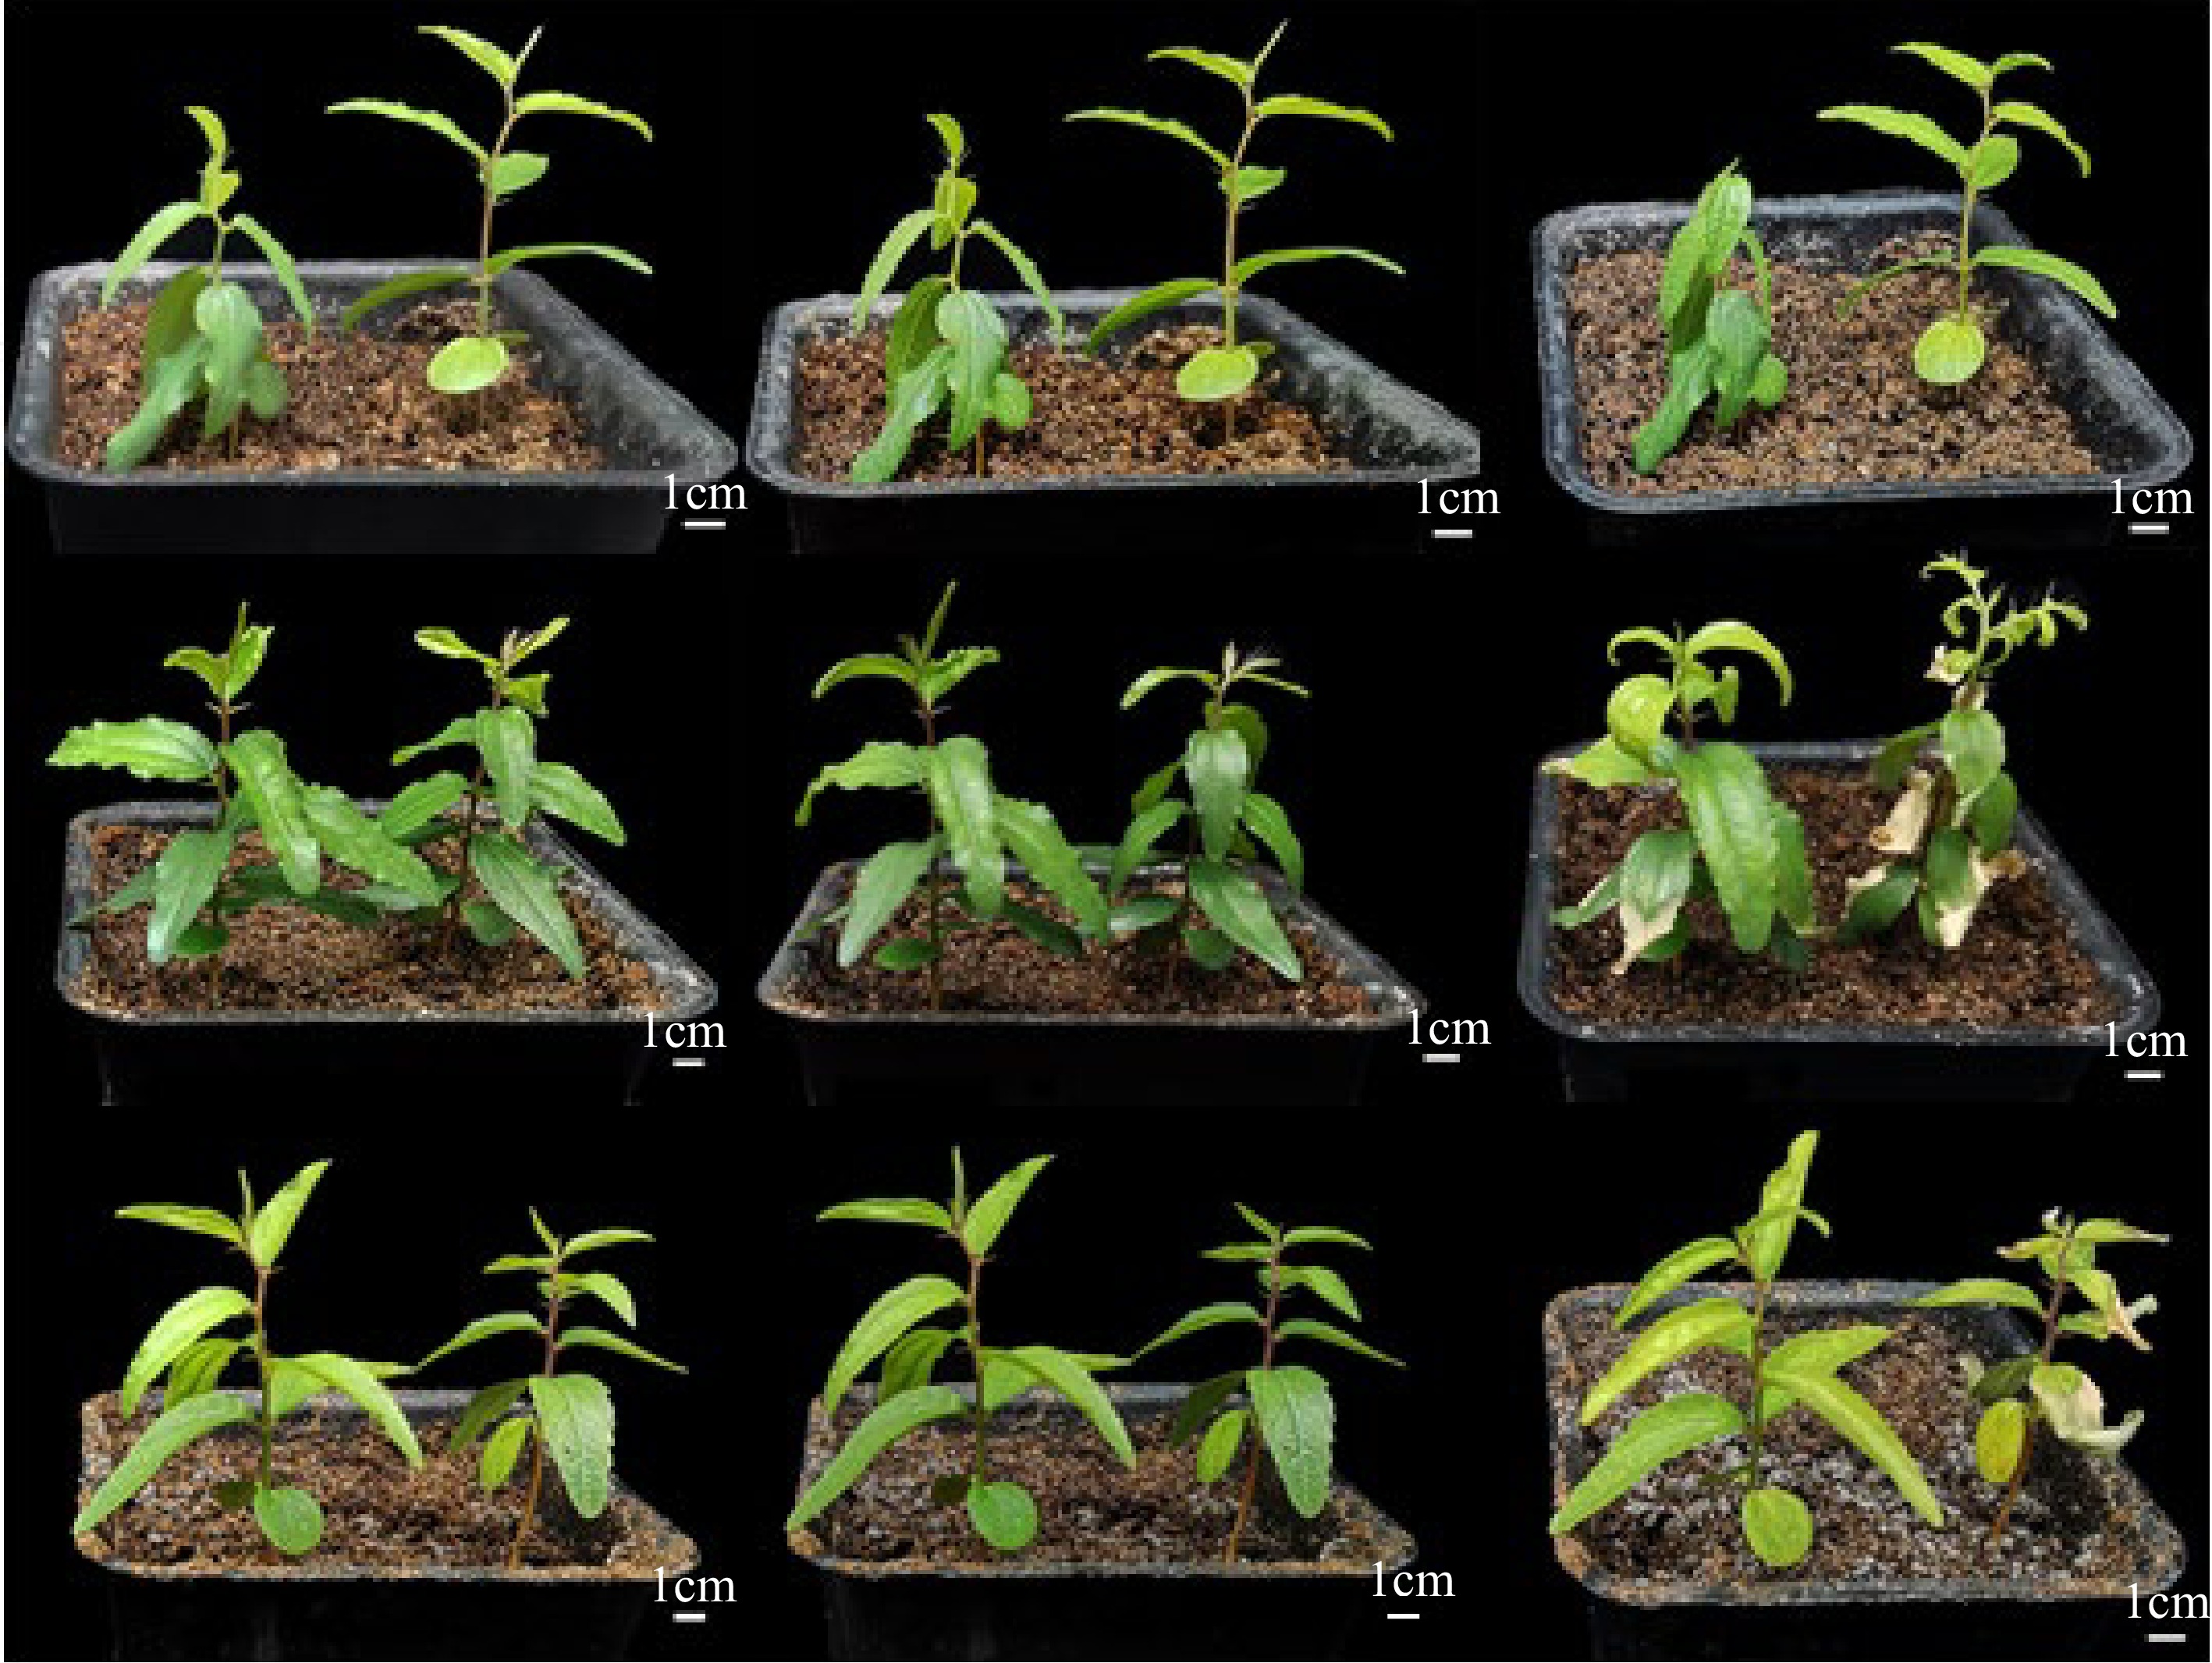
Figure 1.
Time course of phenotypic characteristics of sour jujube seedlings under (a) control group, (b) 400 mmol/L NaCl treatment group, and (c) 10 µmol/L MT + 400 mmol/L NaCl treatment group respectively, within 0 h, 24 h, and 192 h from left to right. Bar: 1 cm.
-
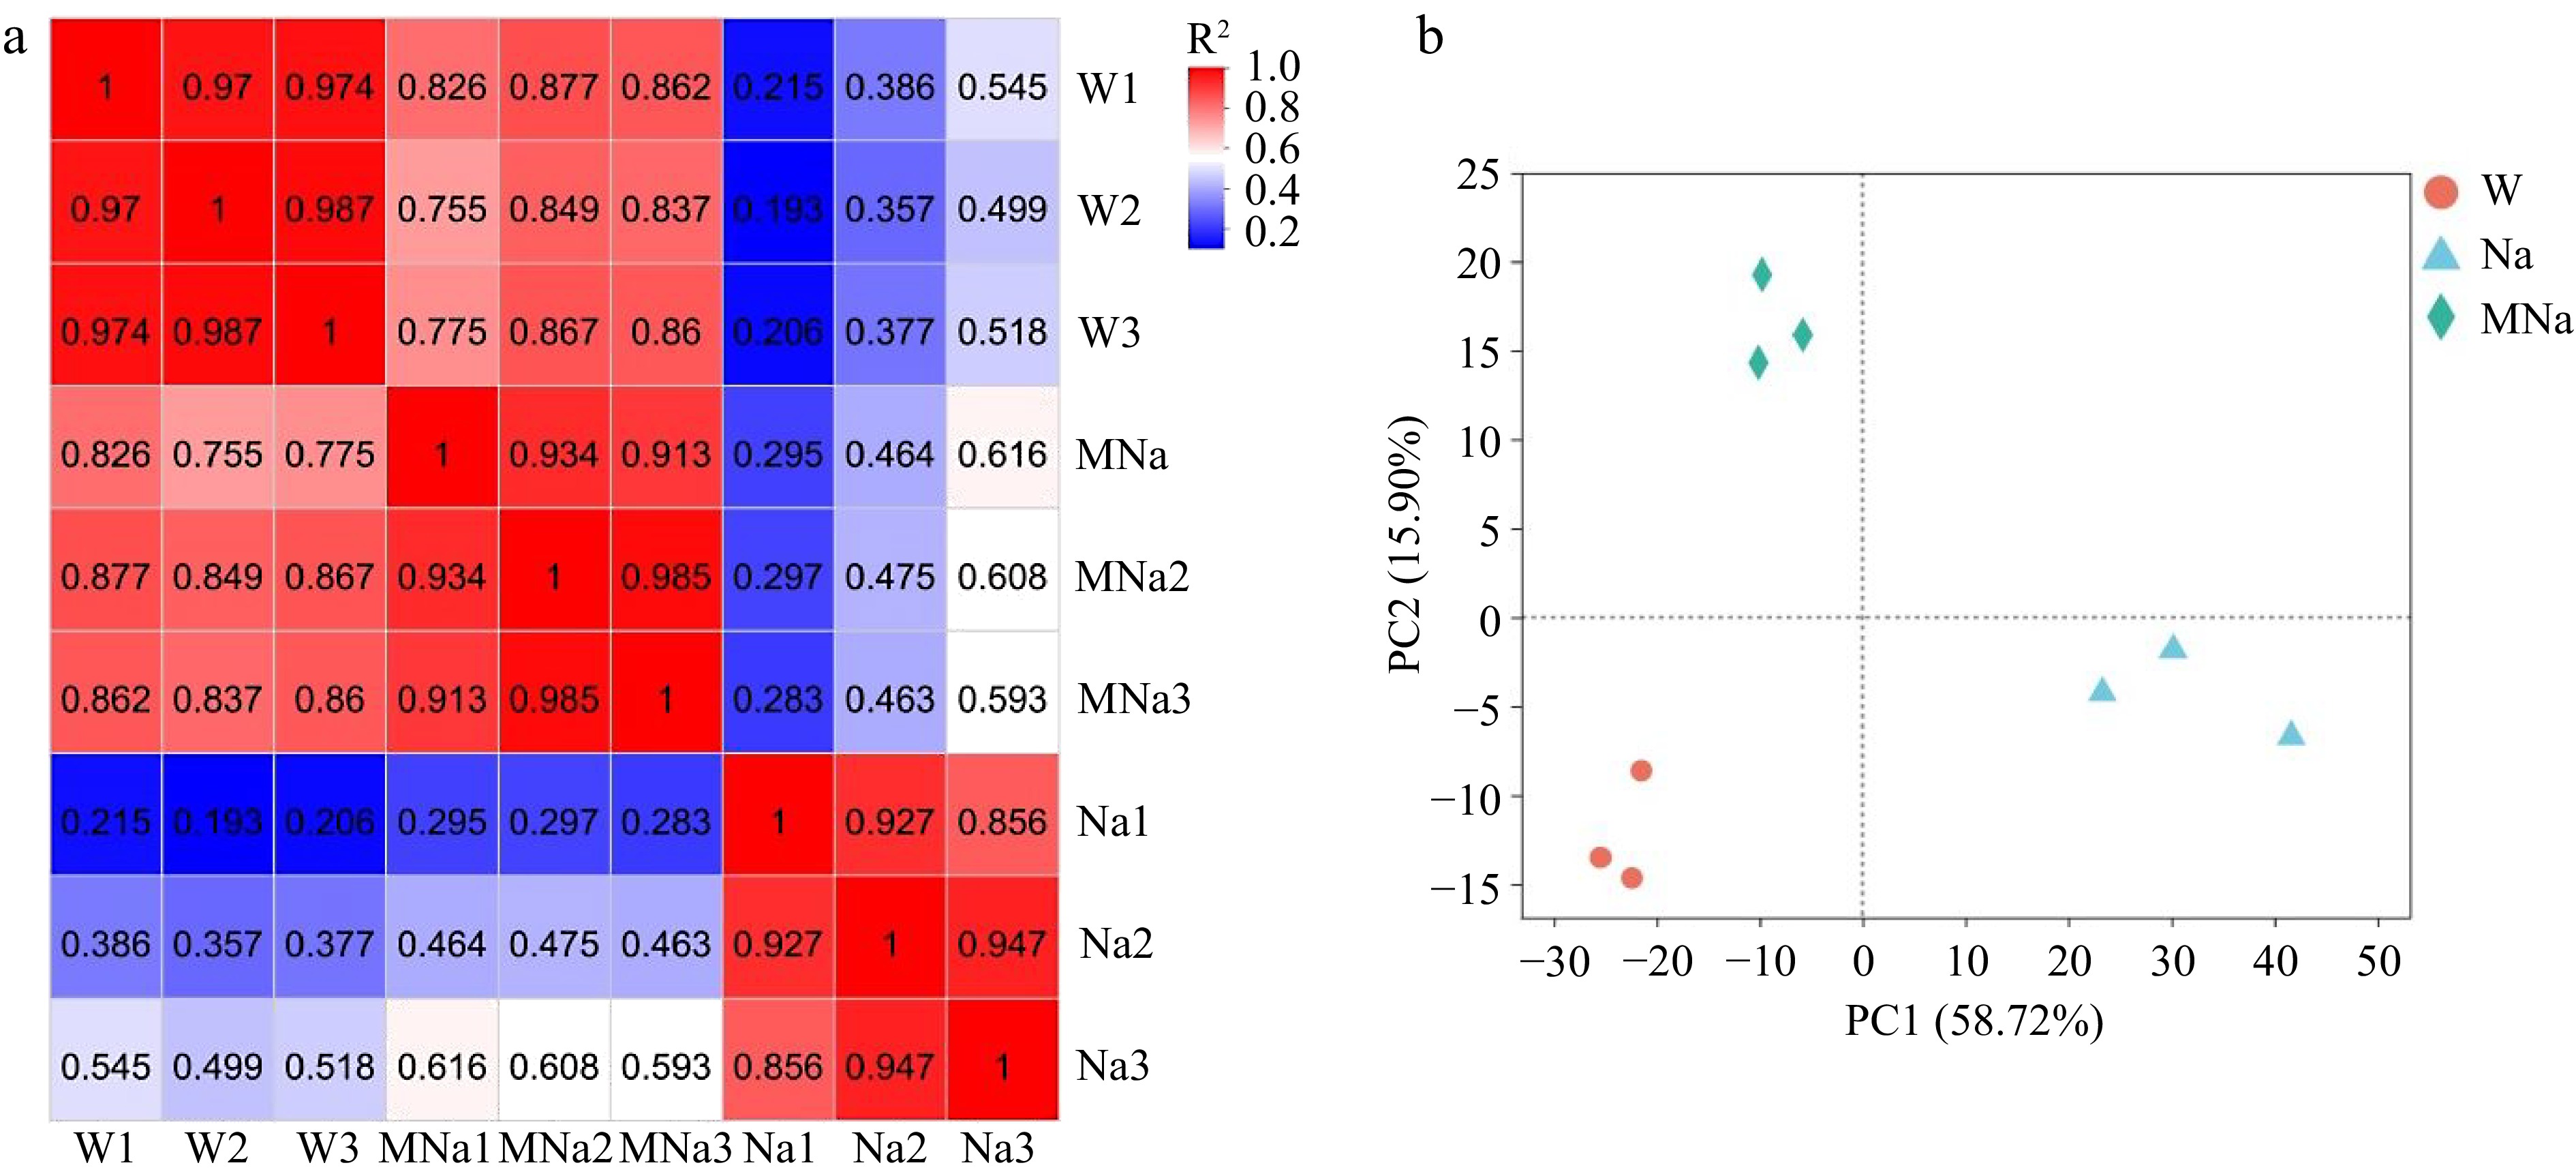
Figure 2.
Overview of the transcriptome samples. (a) Heat map of pearson correlation analysis. (b) Principal component analysis plot. W, Na, and MNa represented water, NaCl, and MT + NaCl treatment, respectively.
-
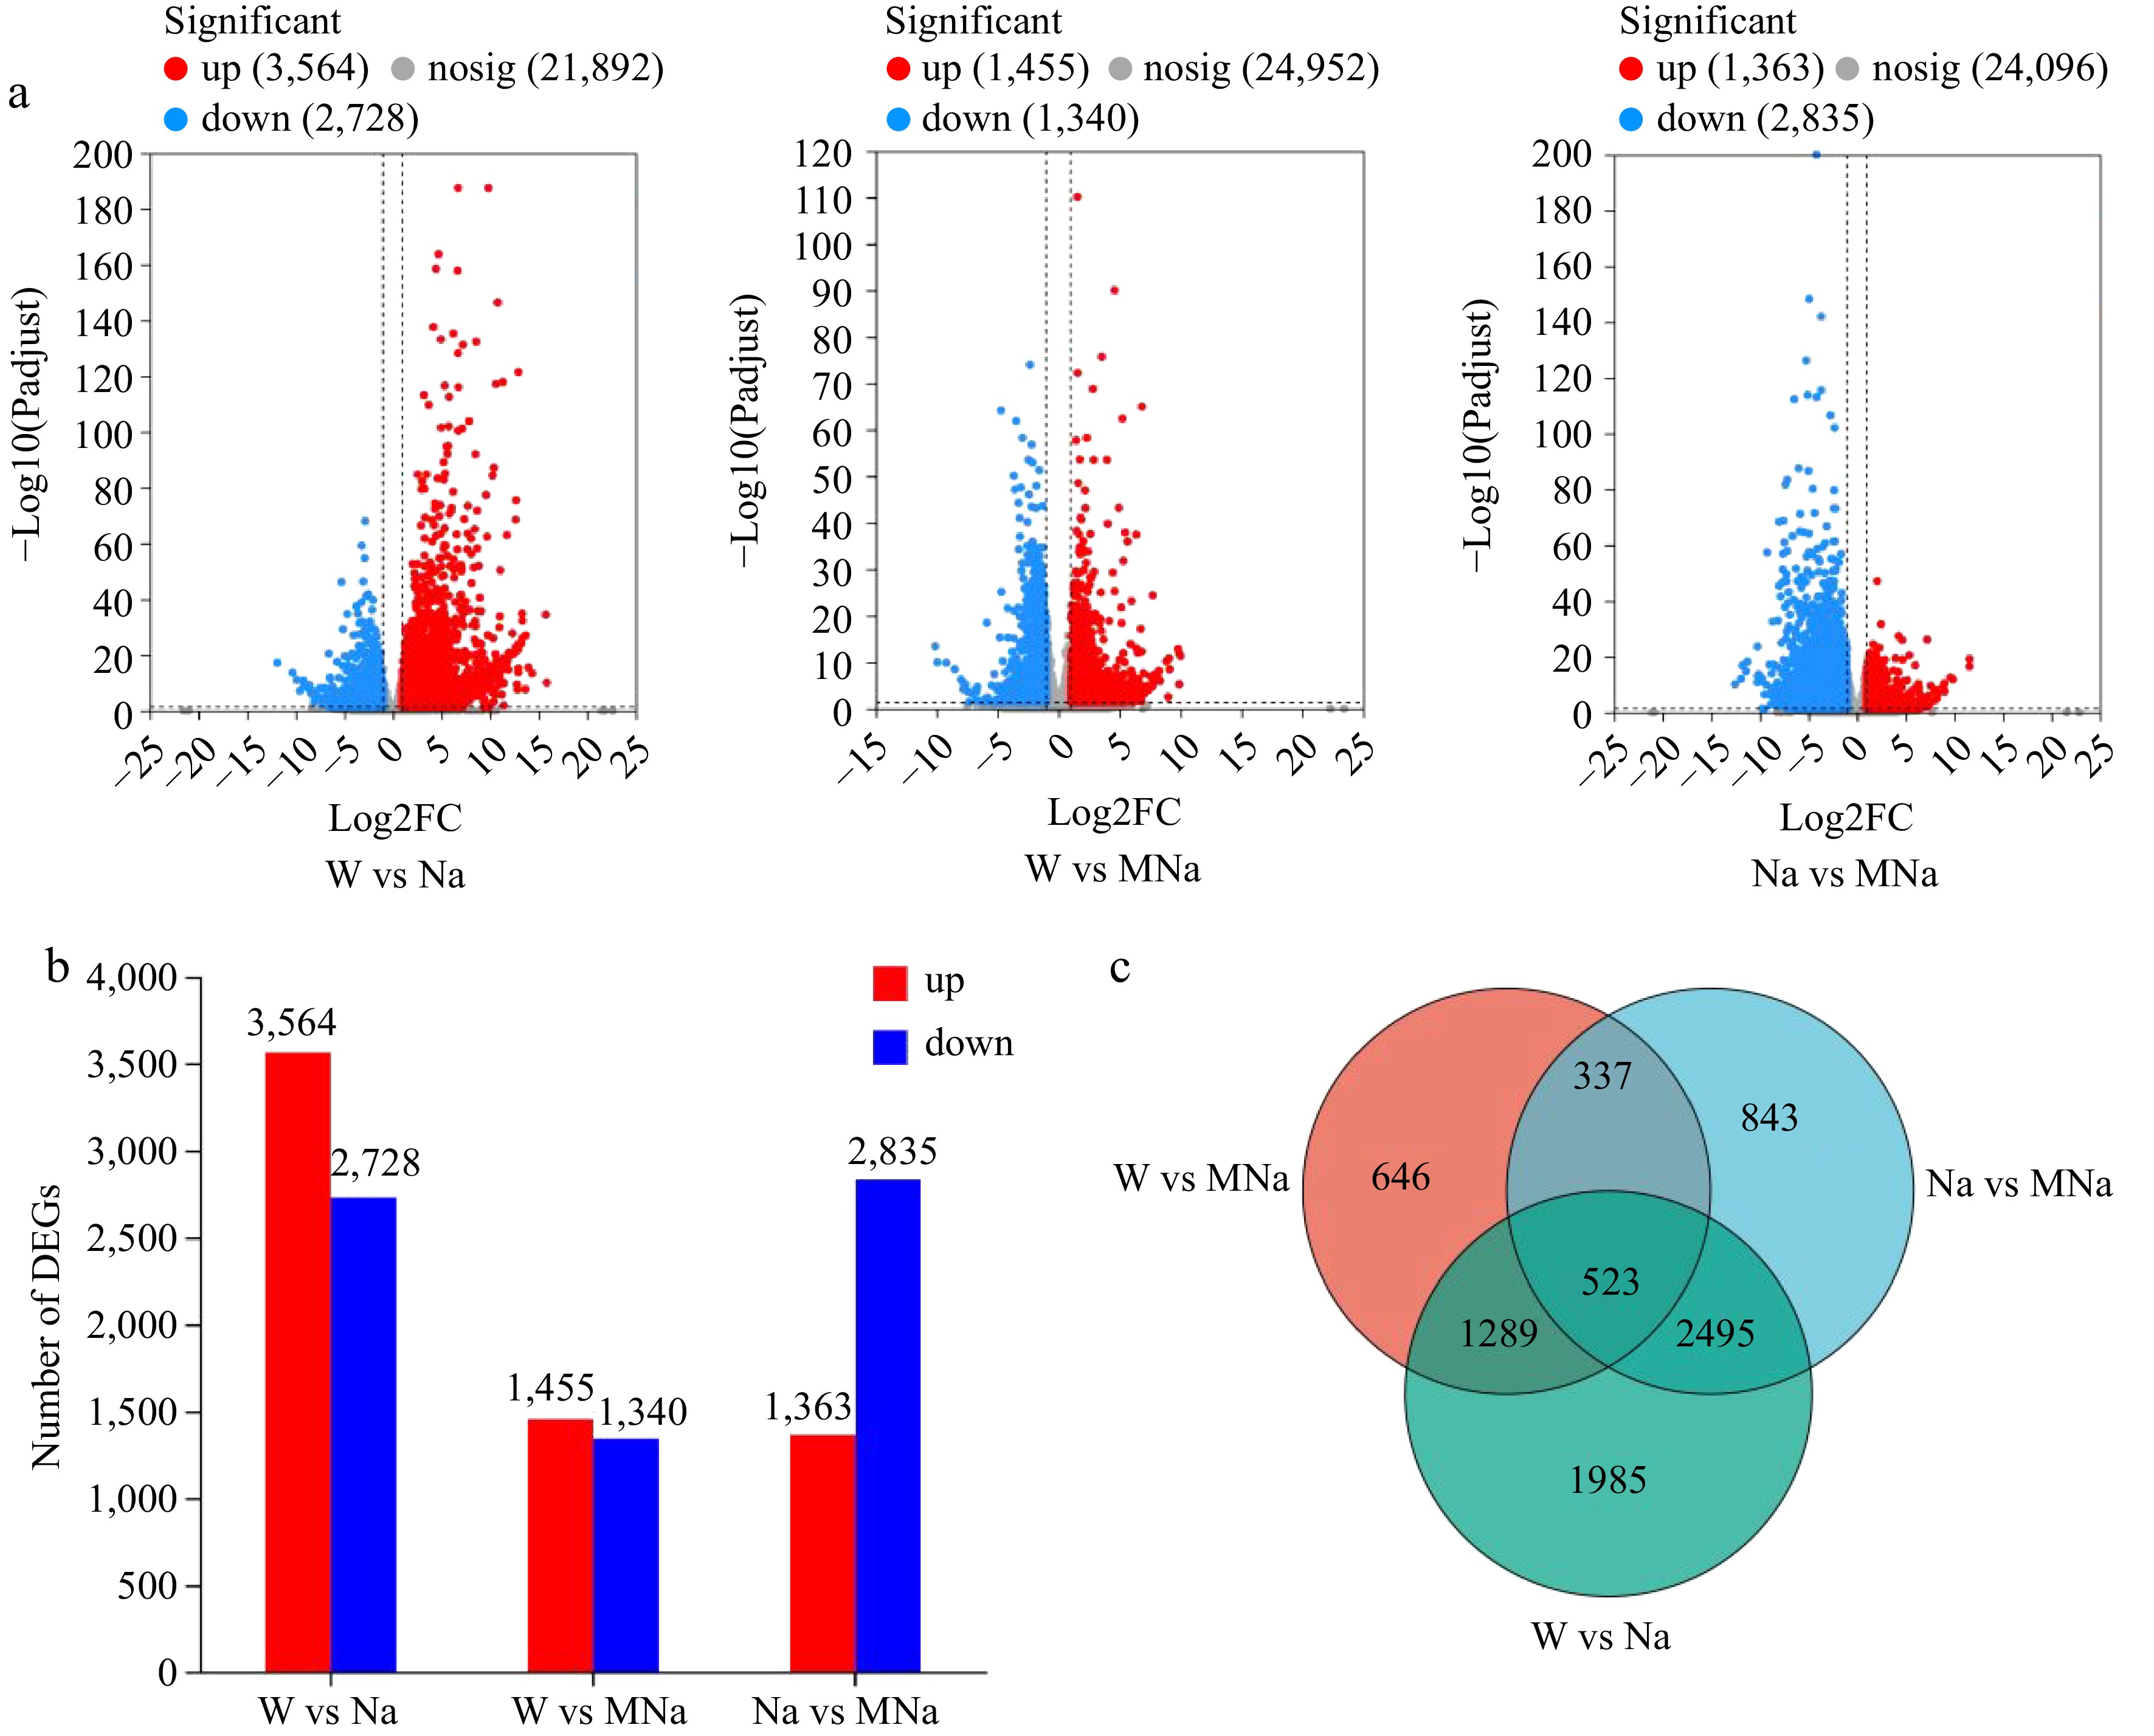
Figure 3.
Identification of the number of differential expression genes (DEGs) in sour jujube seedlings under different treatments. (a) Volcano plots analysis of the number of DEGs. (b) Number of up and down regulated DEGs. (c) Venn diagrams of DEGs.
-
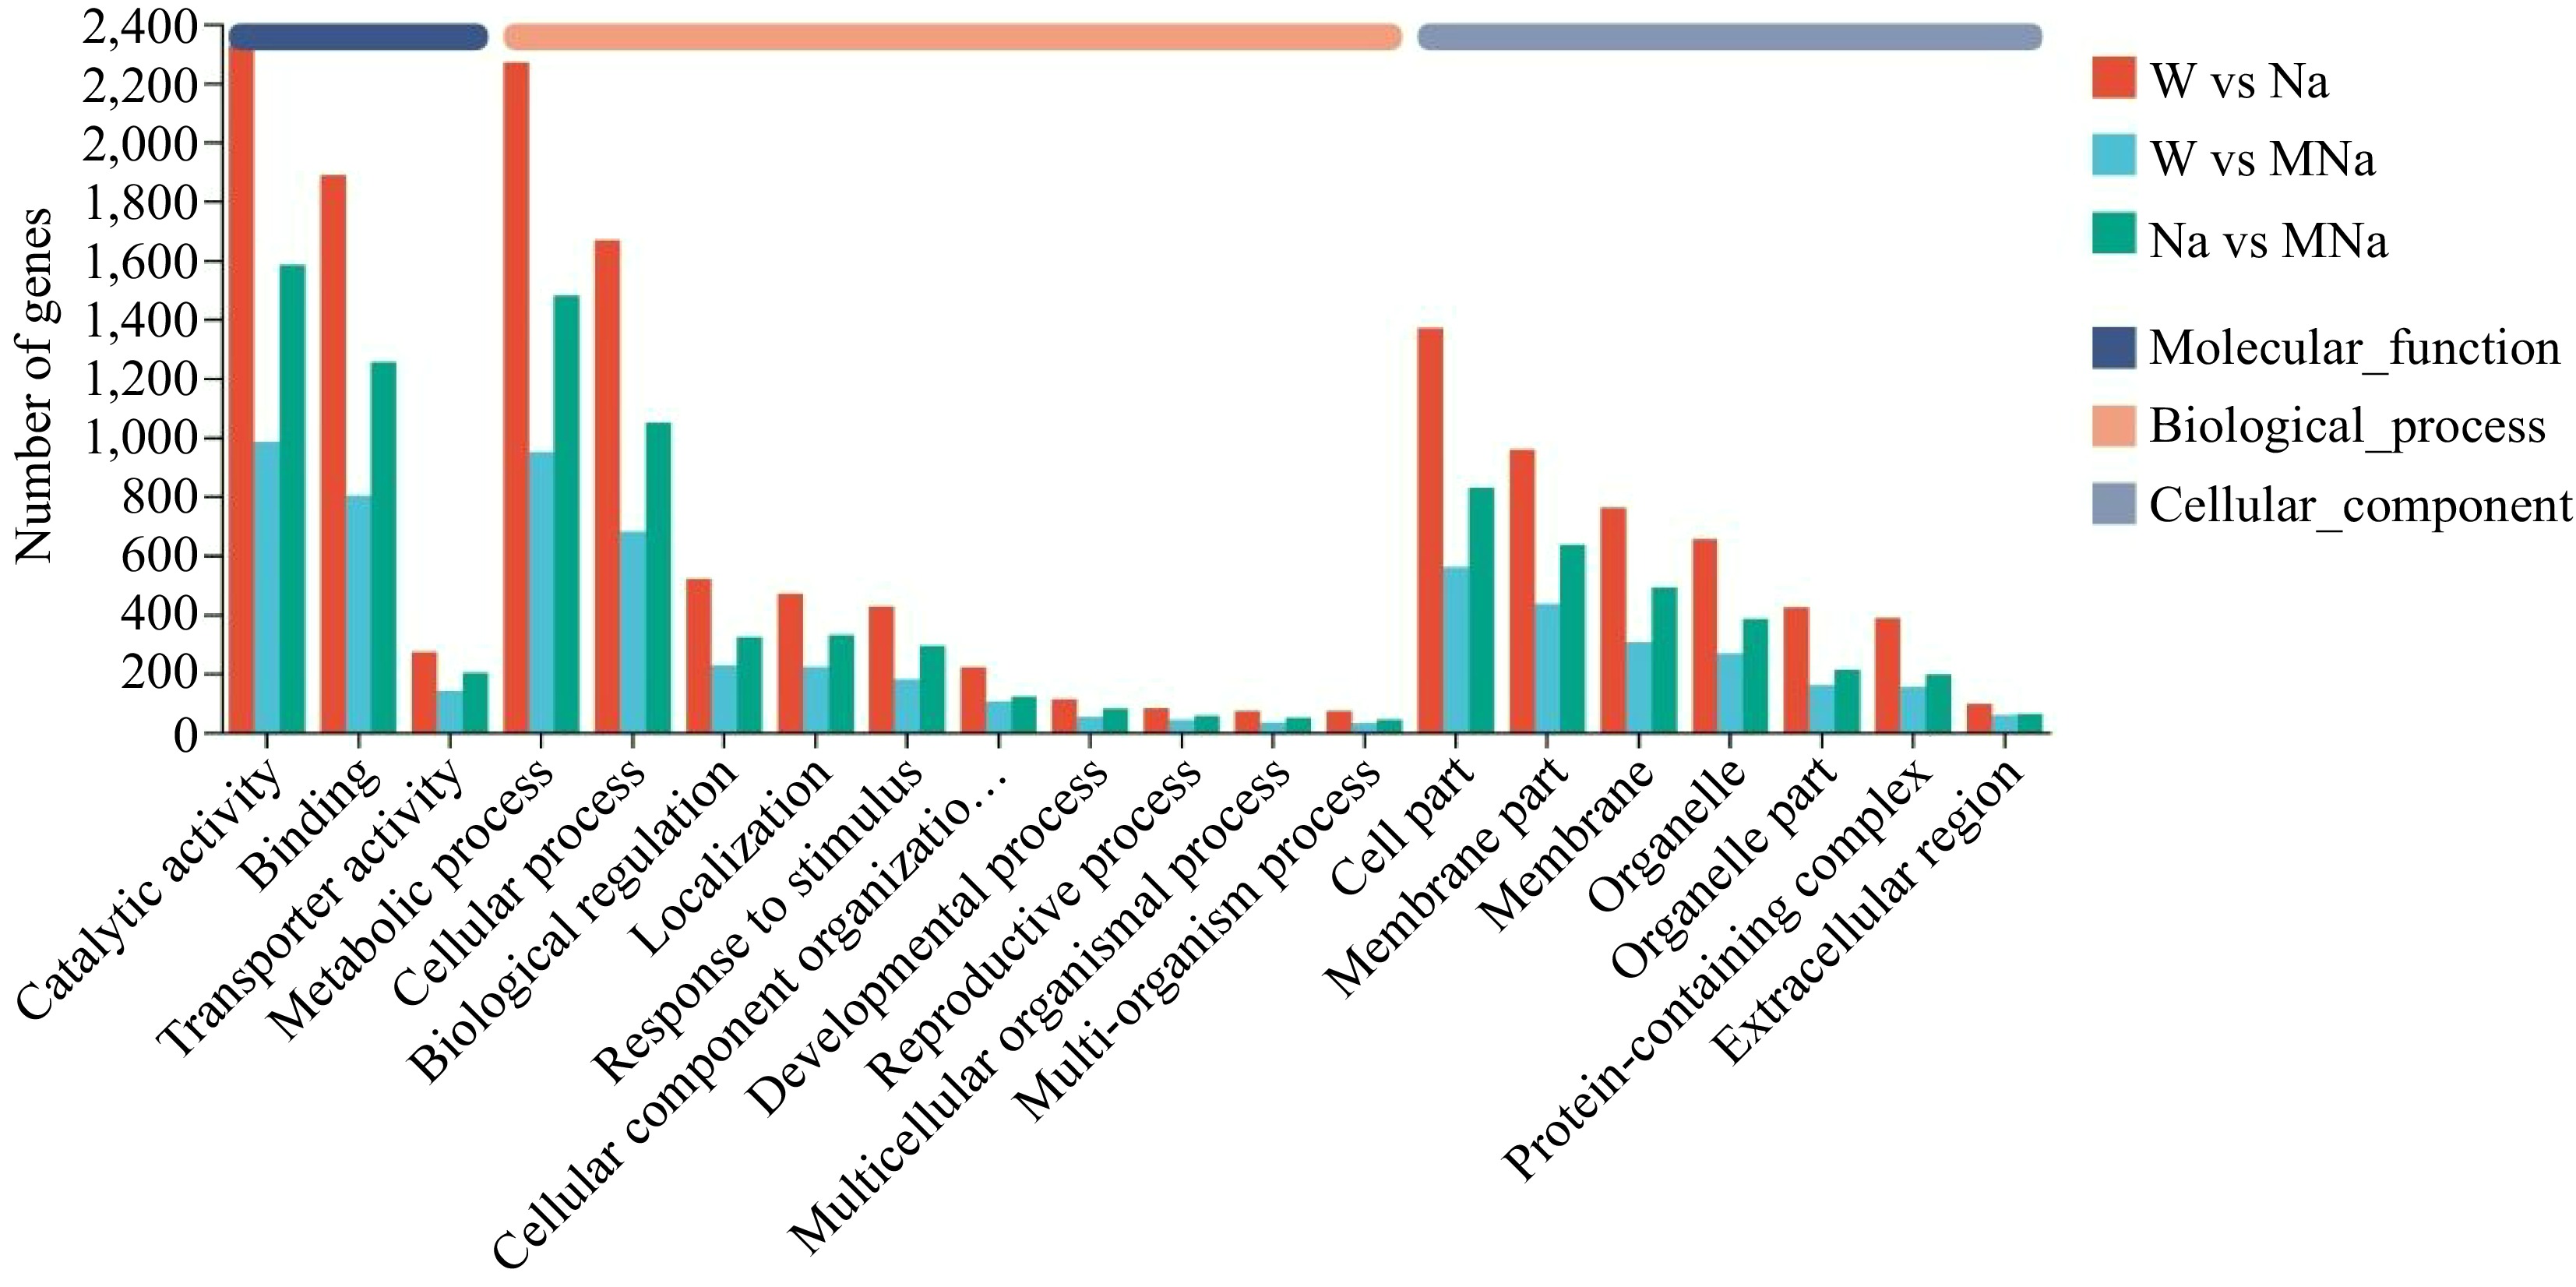
Figure 4.
Histogram of annotation analysis of gene ontology among different pairwise groups.
-
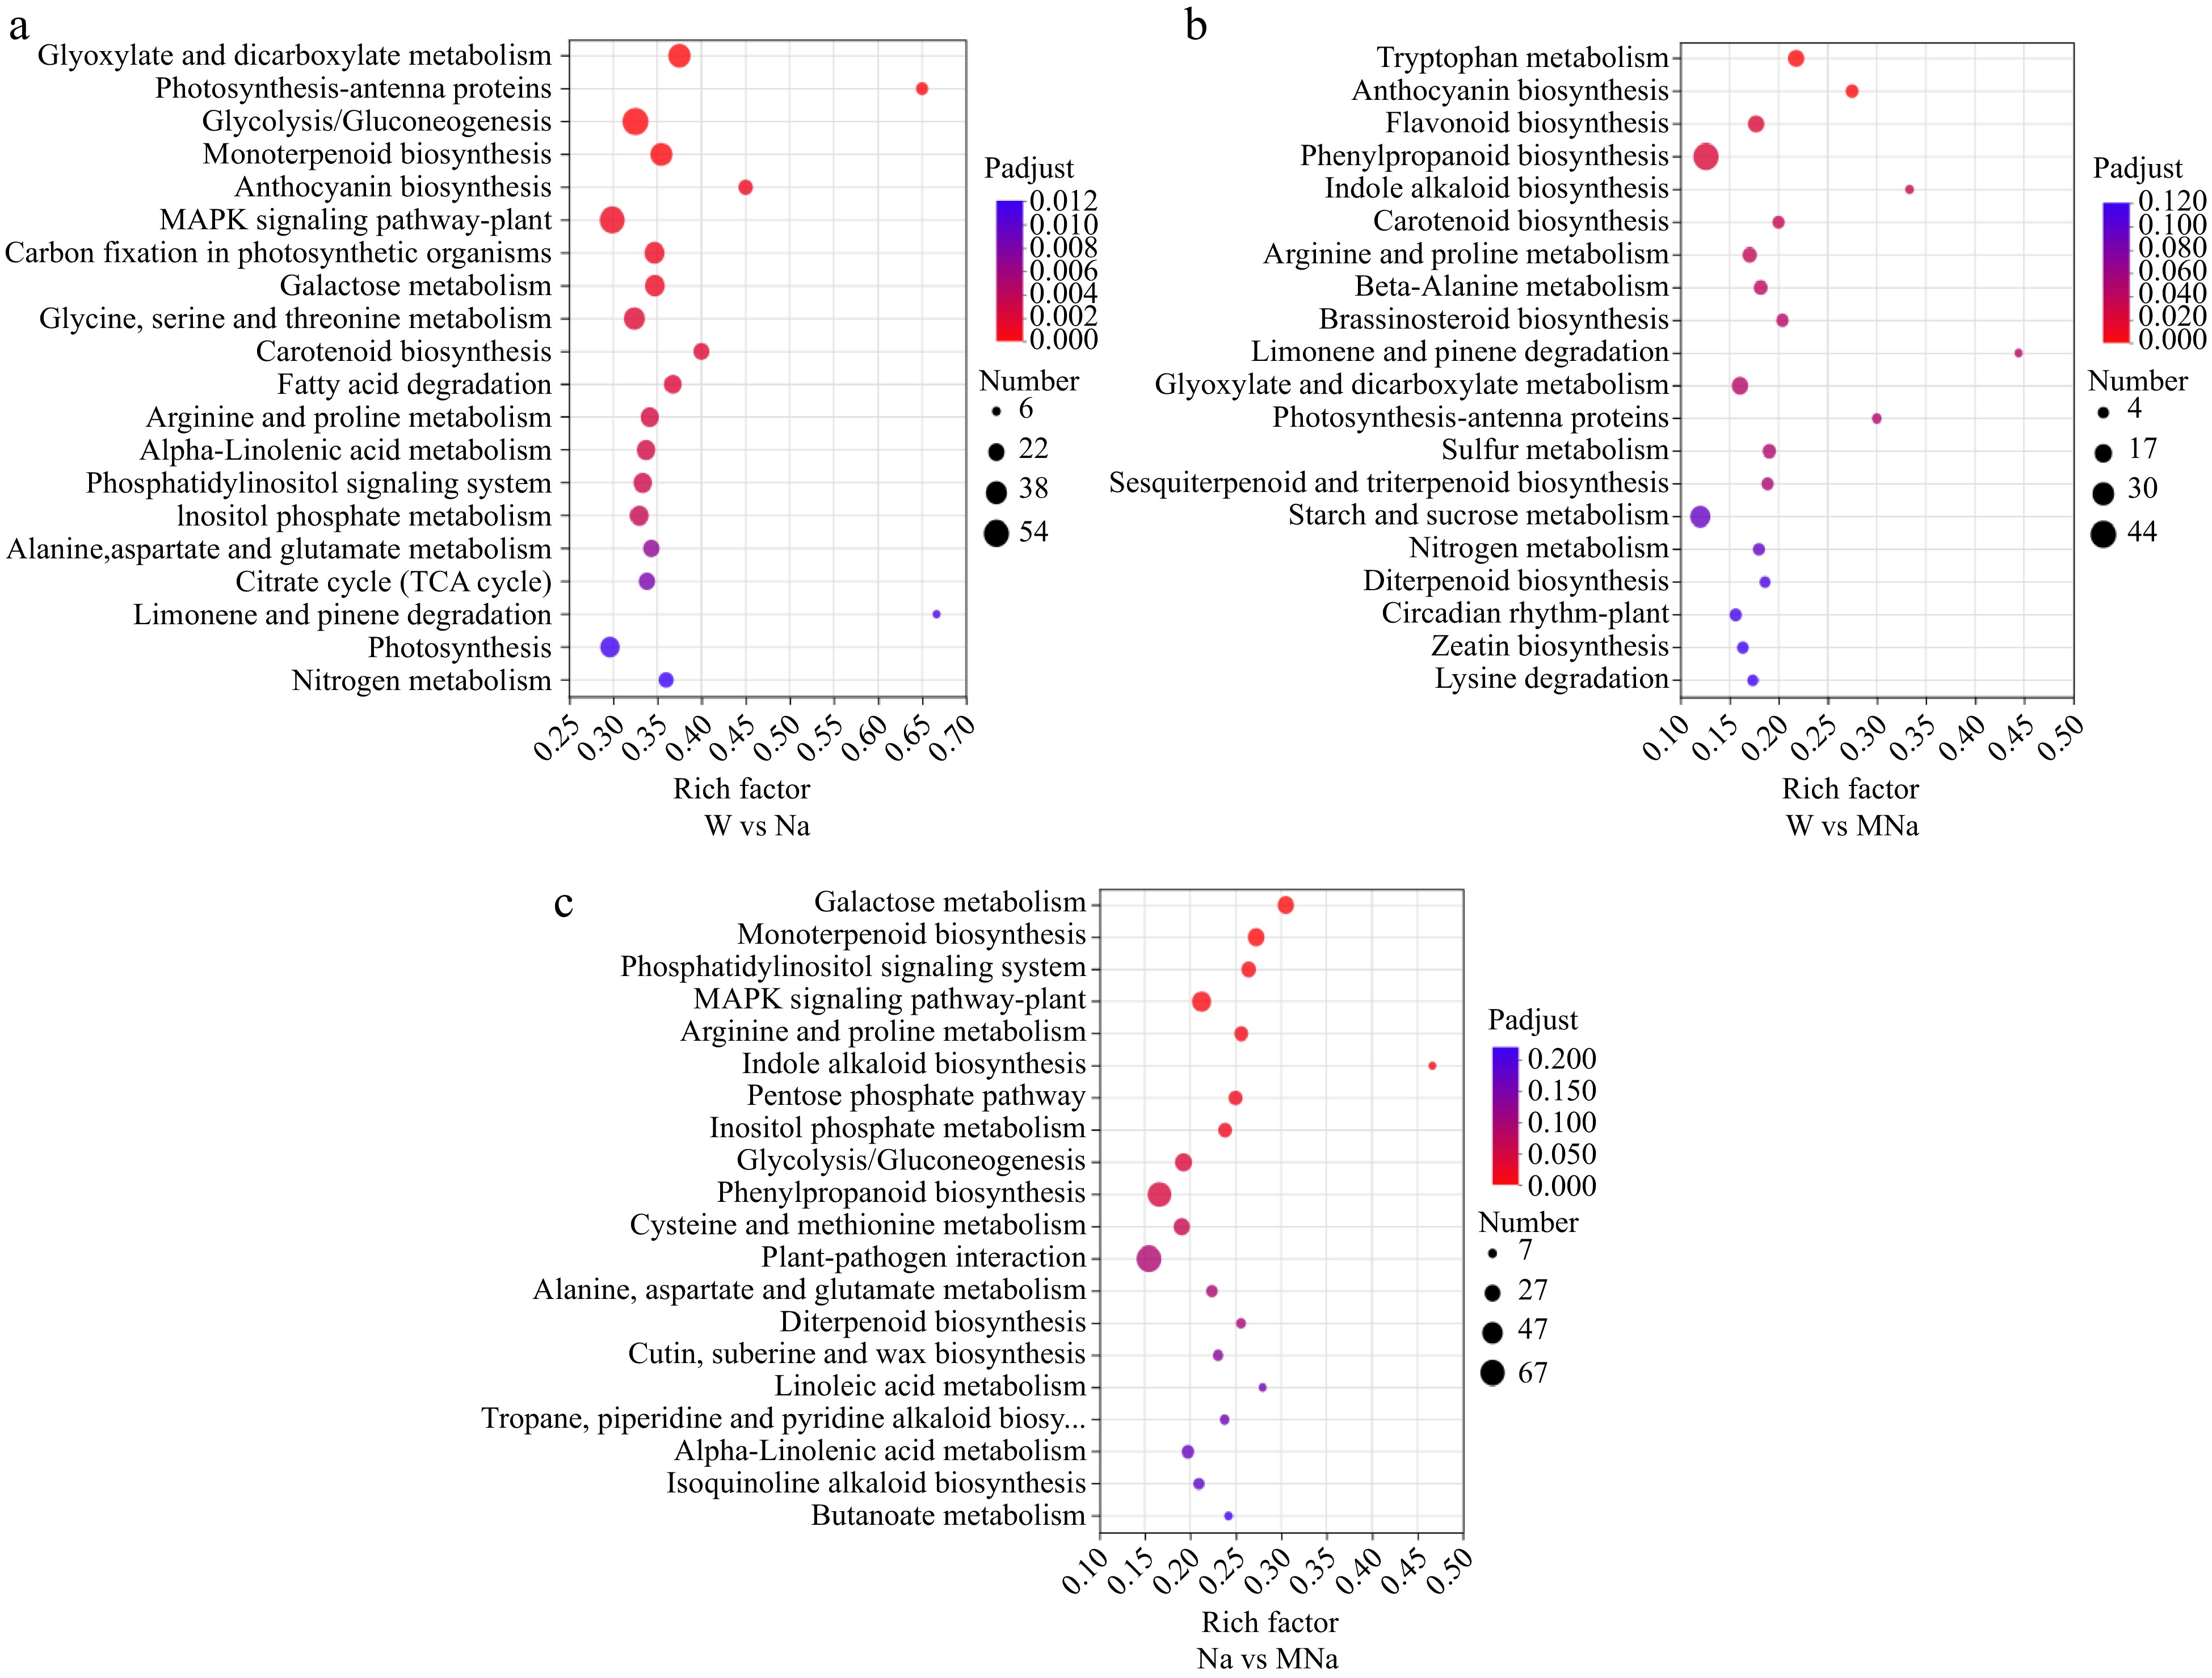
Figure 5.
The top 20 KEGG pathways were analyzed in sour jujube under different pairwise groups, such as (a) W vs Na, (b) W vs MNa, and (c) Na vs MNa. The vertical axis represents the pathway name, the horizontal axis represents the rich factor, the size of dots in the pathway represents the number of DEGs, and the p-adjust value is reflected by the color of the dots.
-
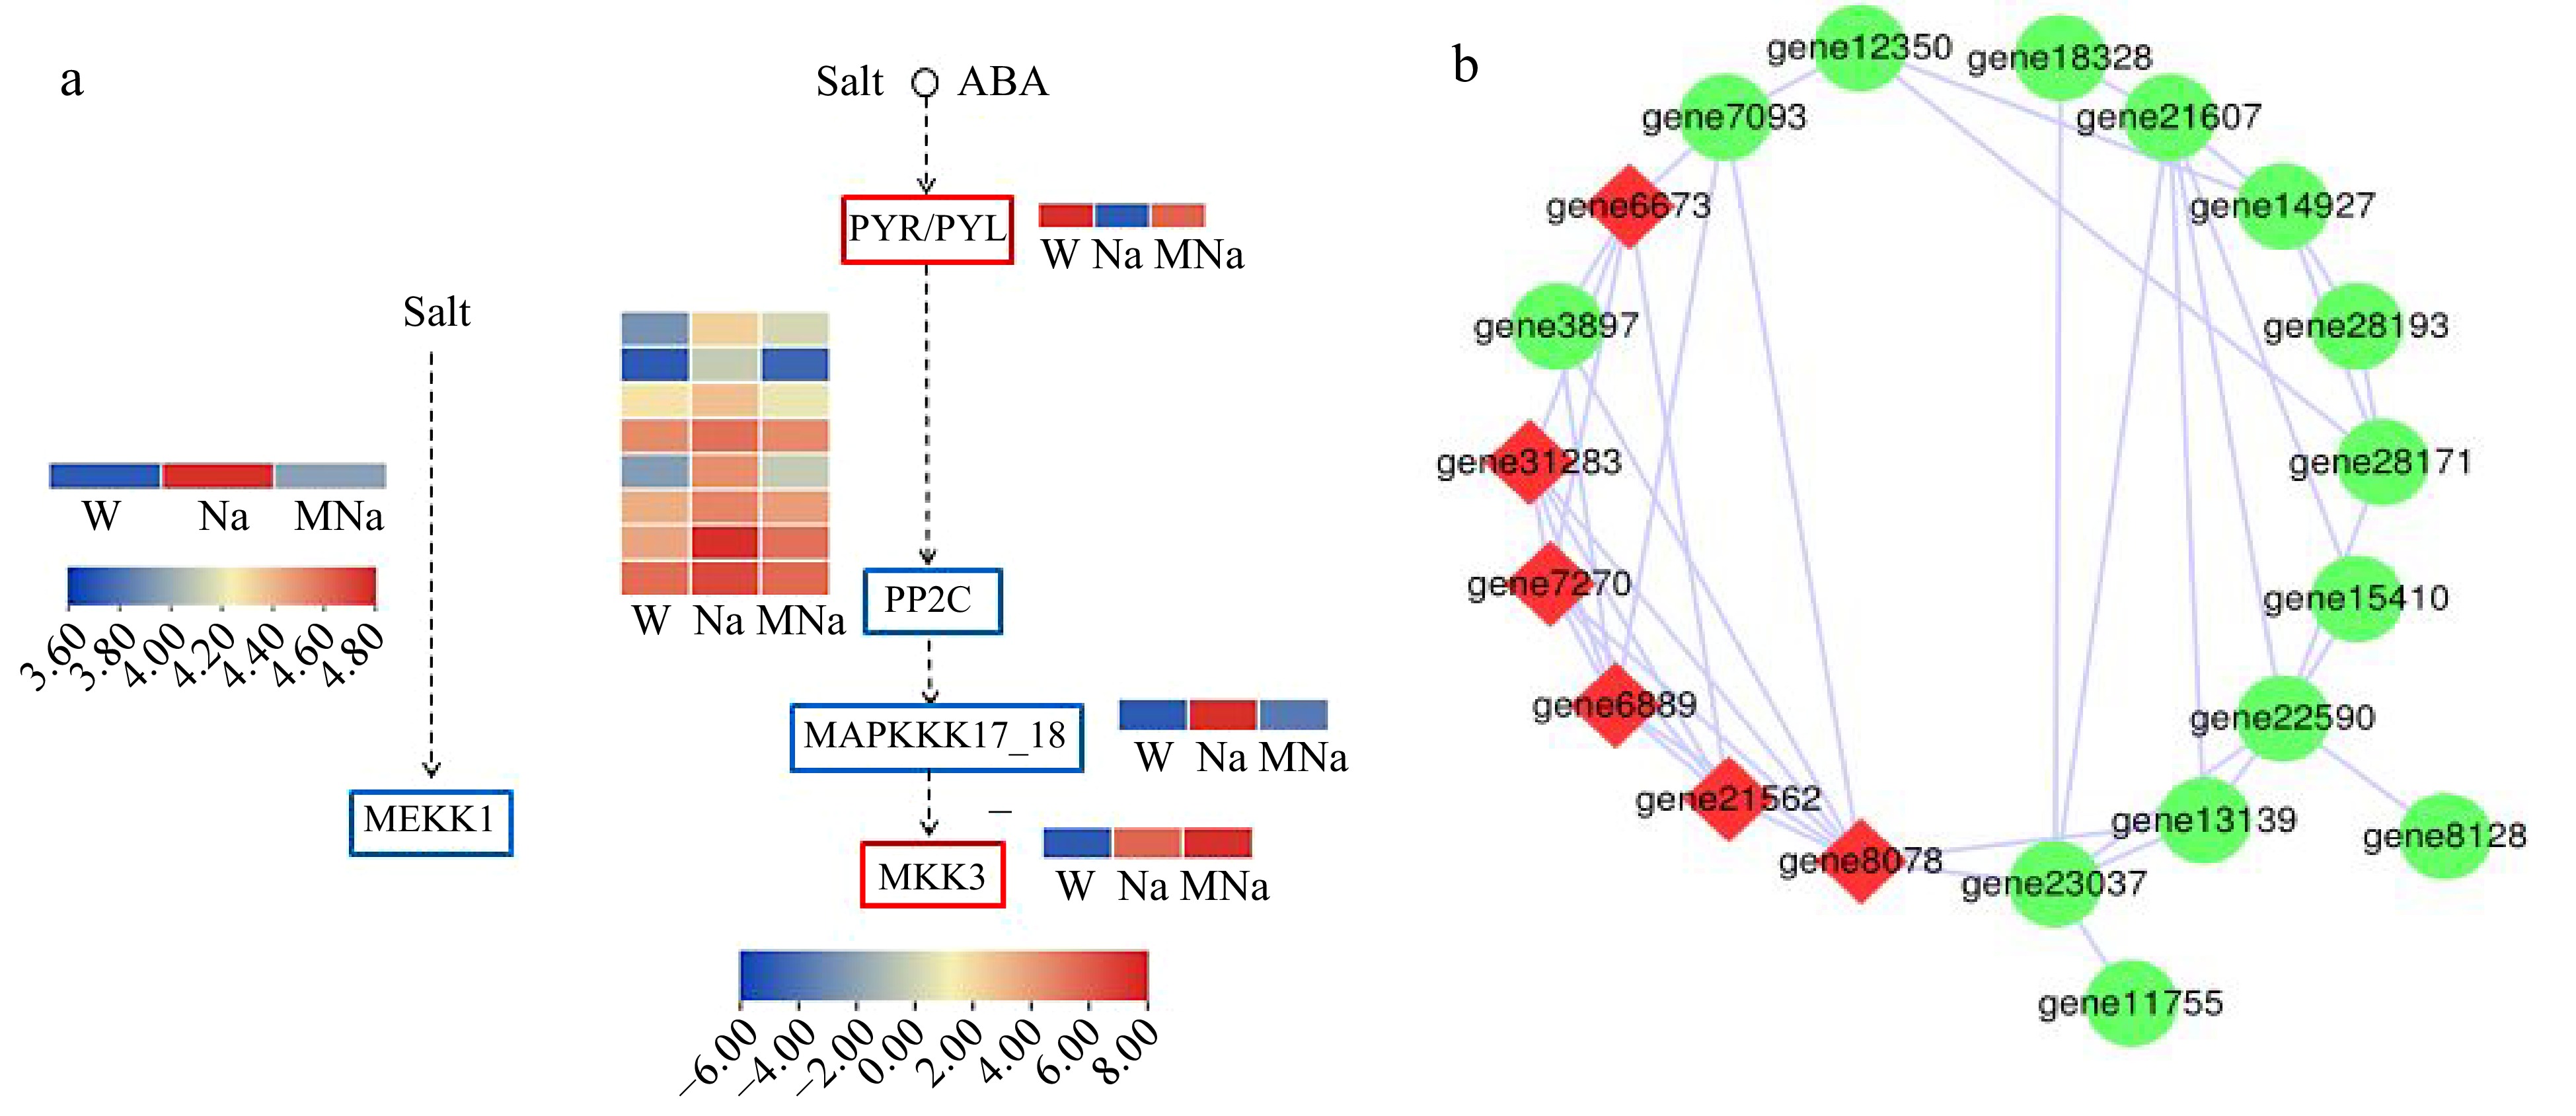
Figure 6.
Key DEGs analysis on MAPK signaling pathway. (a) DEGs analysis in two key MAPK pathways in response to salt stress within MT treatment. Red border represents genes which are upregulated, blue border represents genes which are downregulated. Arrows only represent legend indications. (b) Protein interaction network analysis. Node size represents the strength of protein interactions. Red color indicates the key node proteins.
-
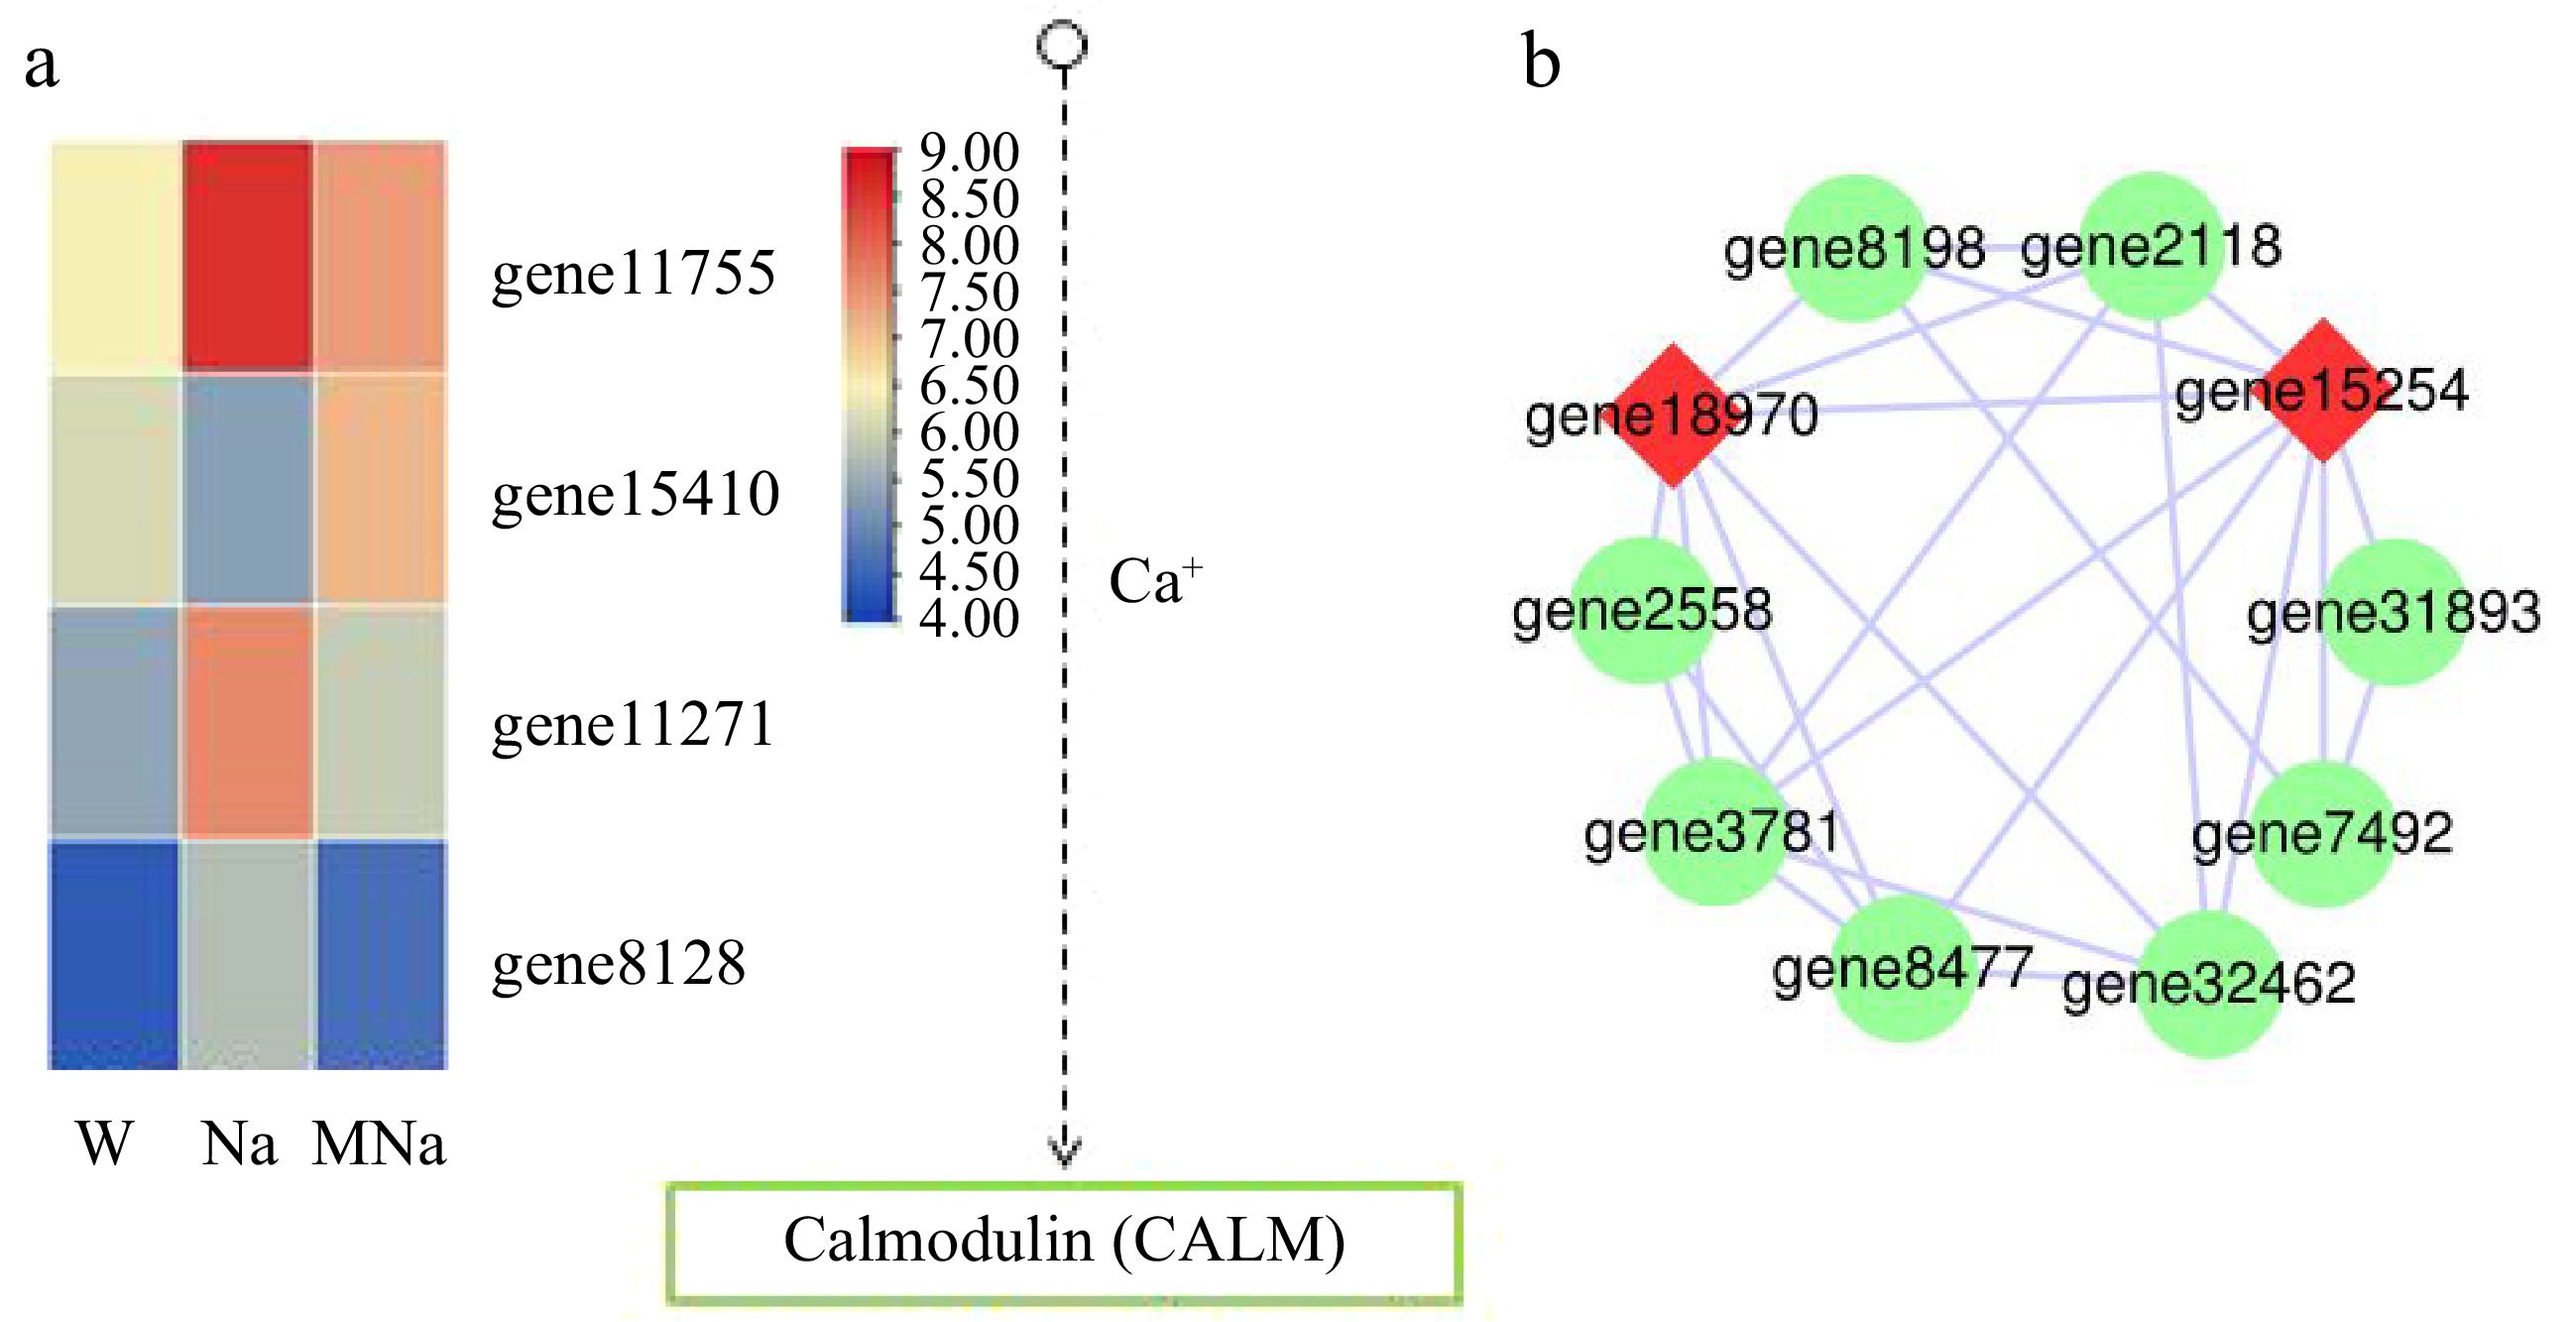
Figure 7.
Key DEGs analysis on phosphatidylinositol signaling system. (a) DEGs analysis in Ca2+ signaling pathway. Arrows only represent legend indications. (b) Protein interaction network analysis. The node size represents the strength of protein interactions. Red color indicates the key node proteins.
-
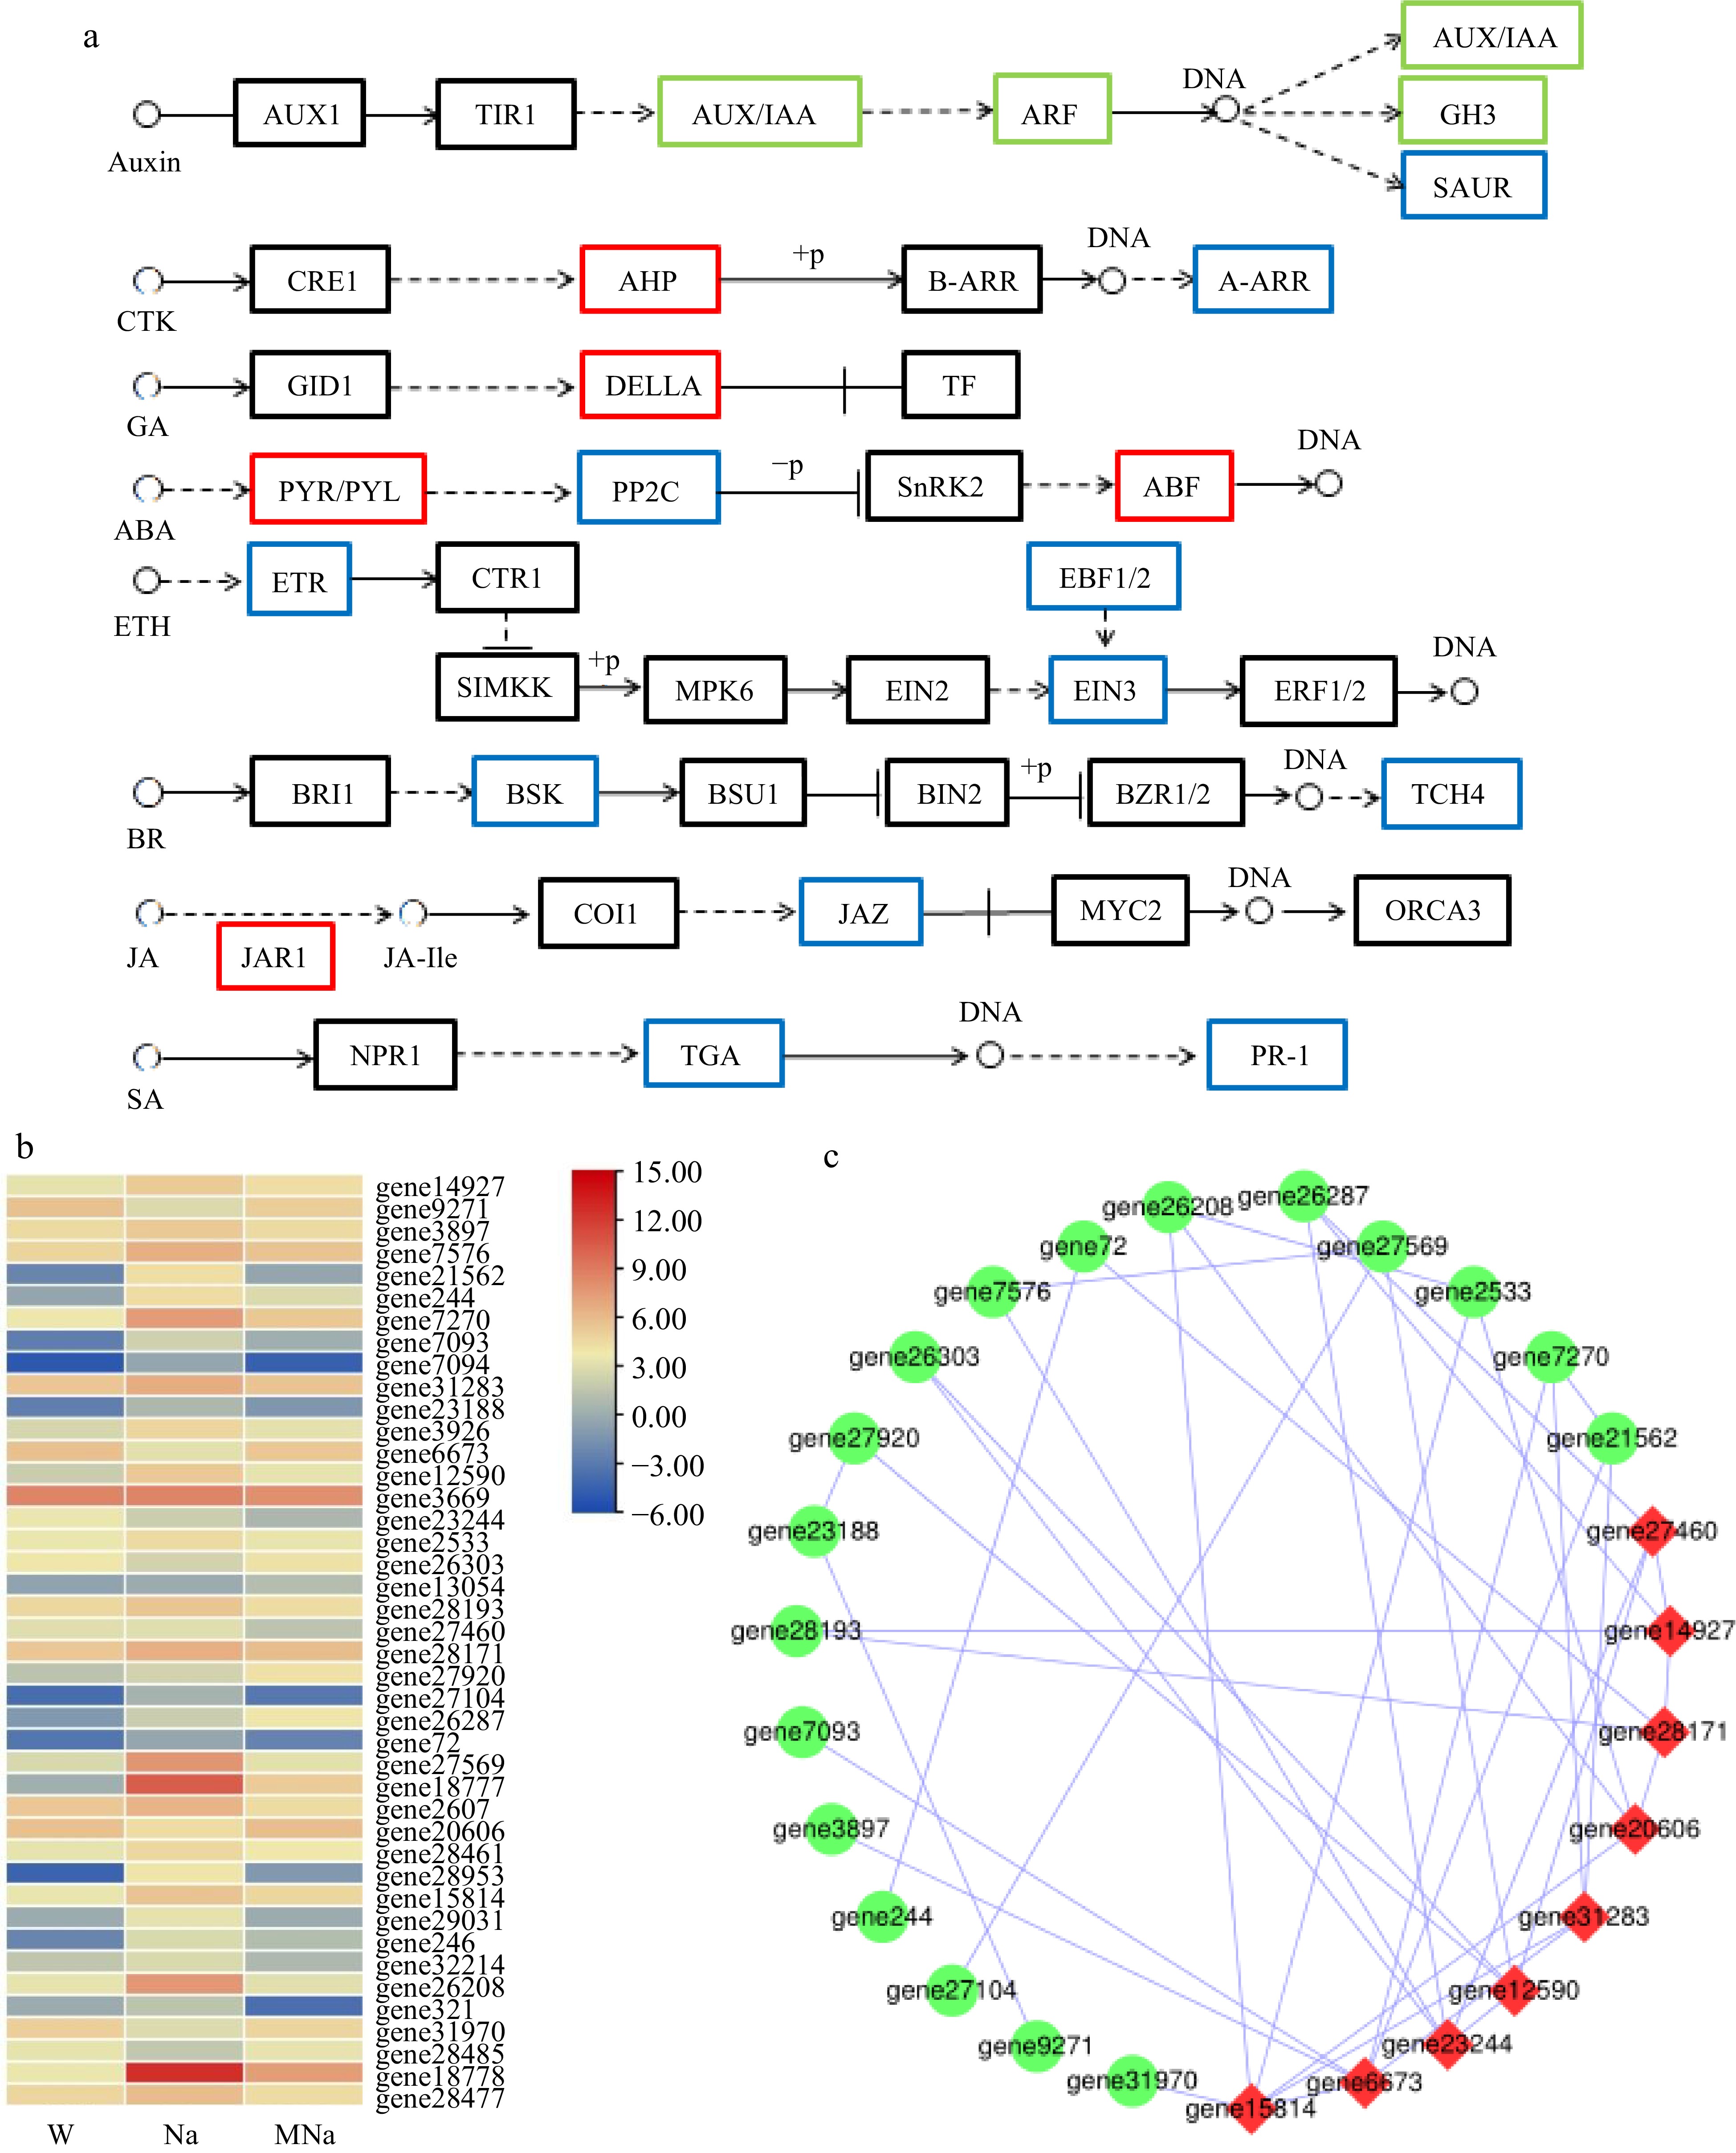
Figure 8.
Key DEGs analysis on plant hormone signal transduction pathway. (a) DEGs analysis in hormone pathways in response to salt stress with MT treatment. Red border represents upregulated genes, blue border represents downregulated genes, and green border represents both up and down regulated genes. Arrows only represent legend indications. (b) Heatmap analysis of related DEGs. (c) Protein interaction network analysis. Node size represents the strength of protein interactions. Red color indicates the key node proteins.
-
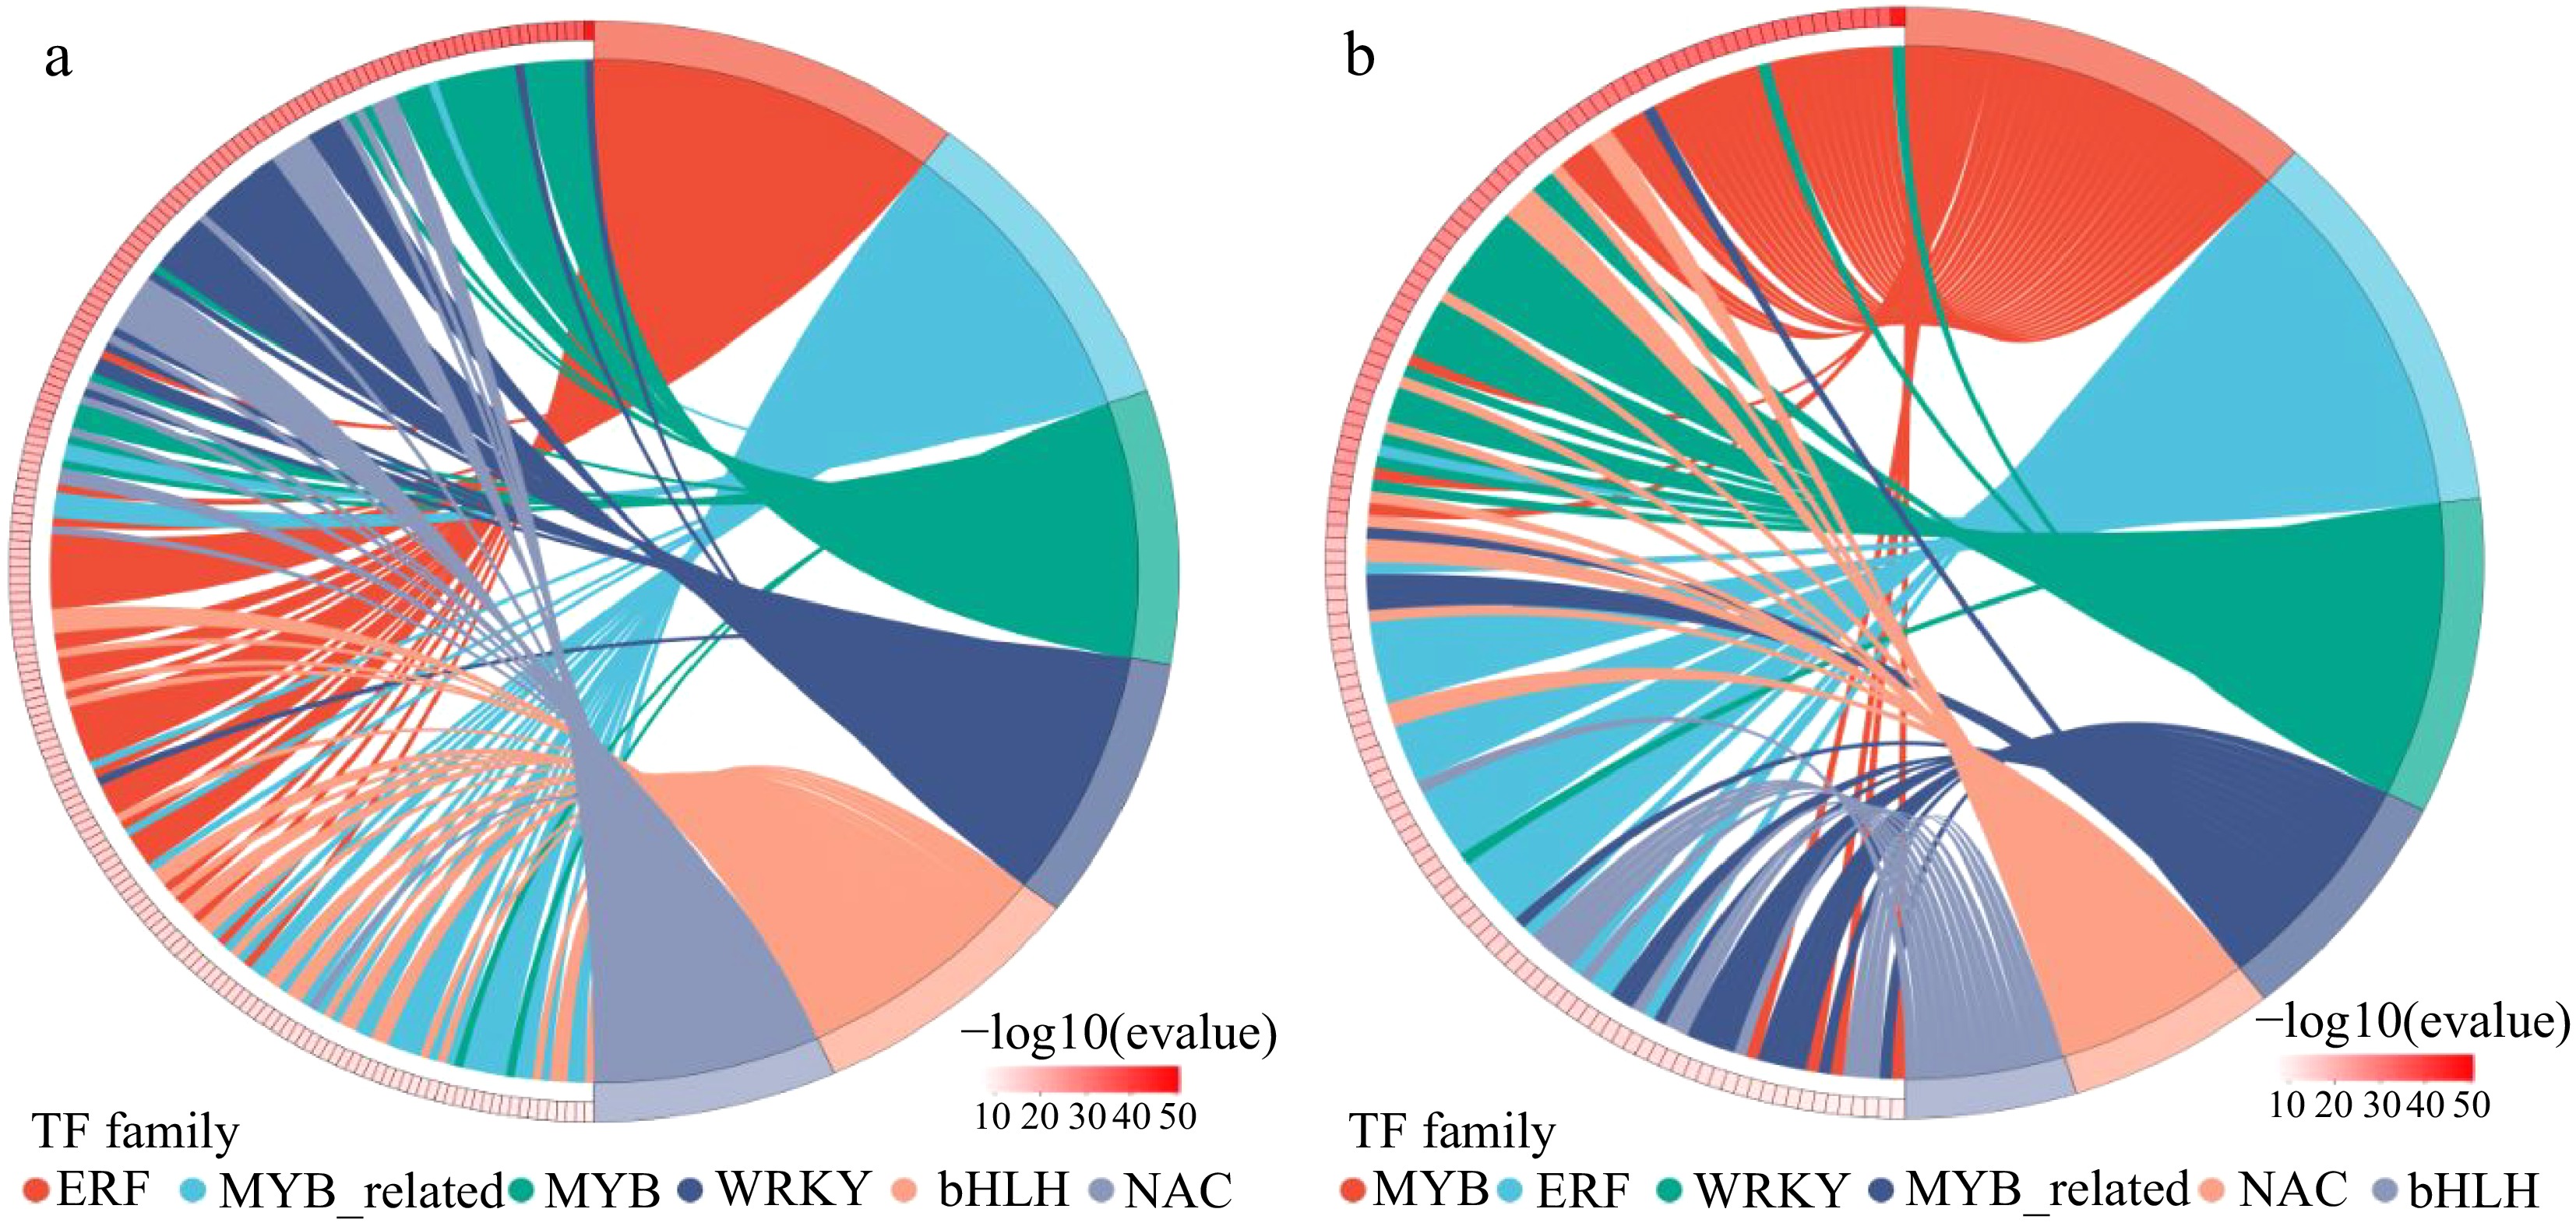
Figure 9.
Distribution map of expressed transcription factor families in (a) W vs Na group and (b) Na vs MNa group. The horizontal coordinates are different transcription factor families, the vertical coordinates are number of genes falling into that transcription factor family.
-
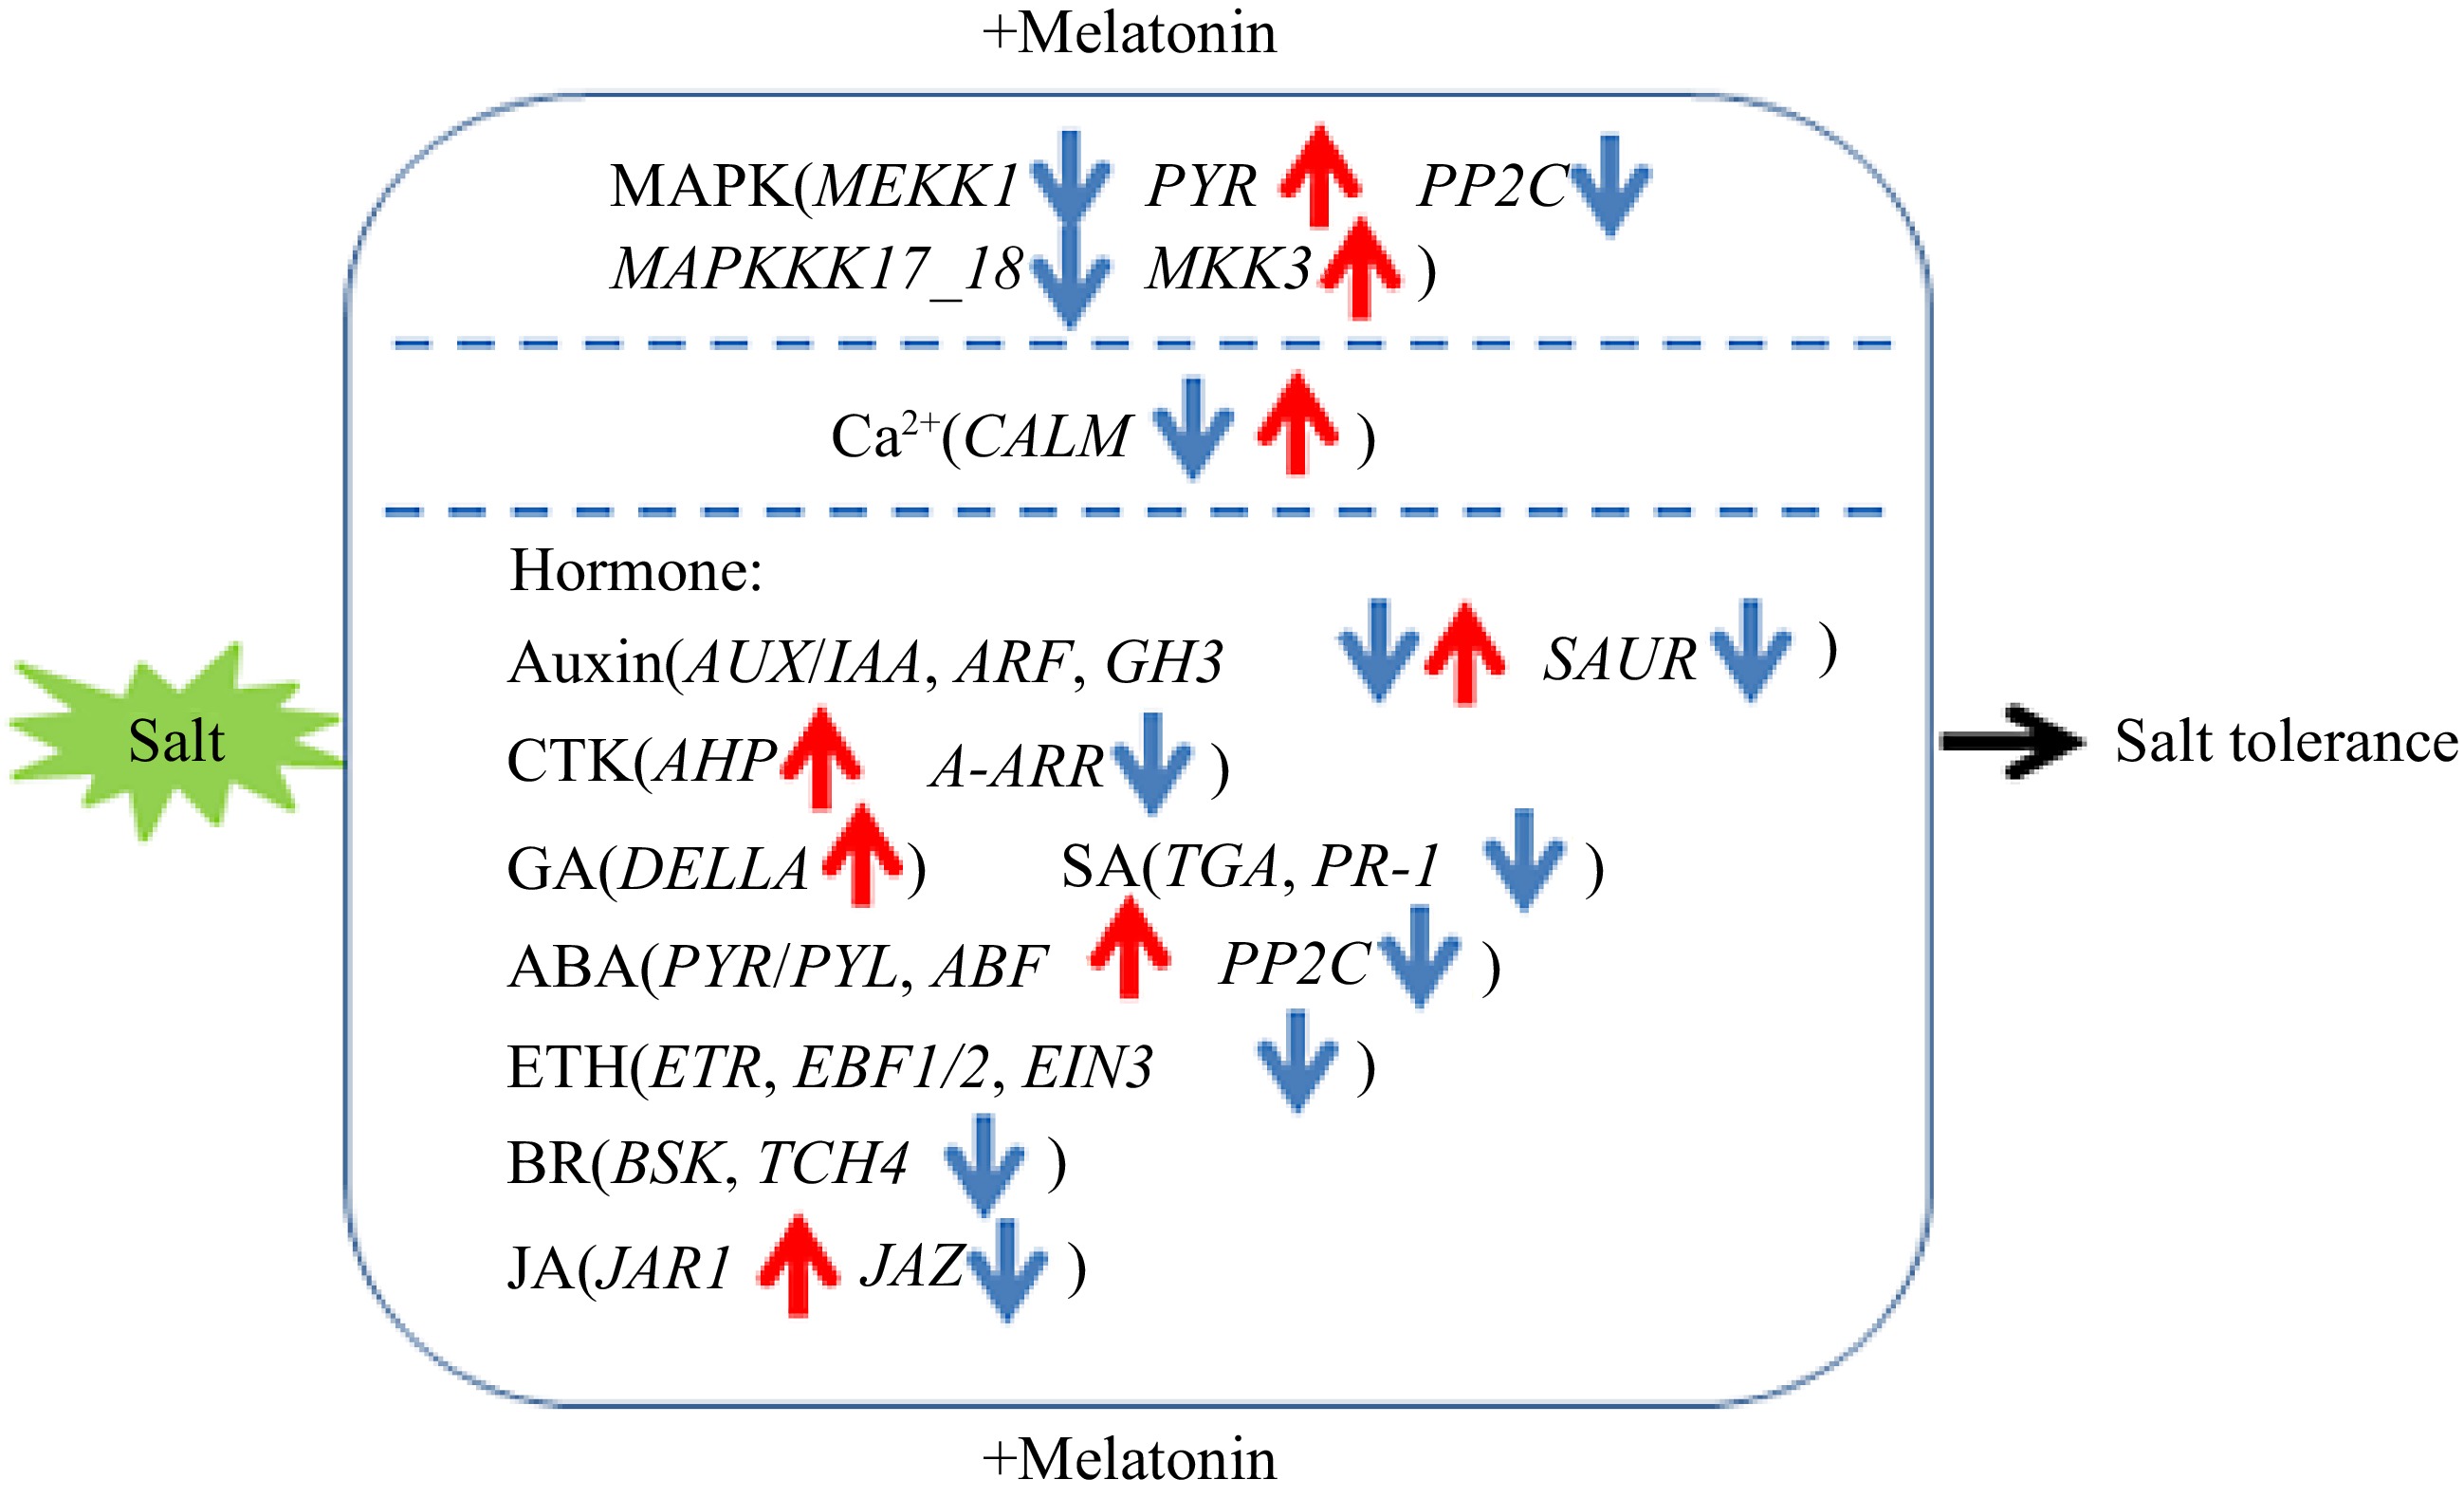
Figure 10.
Proposed model of exogenous melatonin application on effects of sour jujube seedlings in response to salt stress. Blue arrows represent regulatory downregulated genes and red arrows represent regulatory upregulated genes.
-
Samples Raw reads Clean reads Error rate (%) GC content (%) Q30 (%) Total mapped Multiple mapped Uniquely mapped W1 45076920 44509554 0.0250 44.54 94.13 39226588 (88.13%) 5230113 (11.75%) 33996475 (76.38%) W2 45847360 45407490 0.0251 44.65 93.96 40451096 (89.08%) 5338687 (11.76%) 35112409 (77.33%) W3 44540110 44091906 0.0250 44.43 94.09 39056270 (88.58%) 5141396 (11.66%) 33914874 (76.92%) Na1 55405174 54910544 0.0247 44.83 94.34 48658620 (88.61%) 6669193 (12.15%) 41989427 (76.47%) Na2 51733218 51190904 0.0247 44.65 94.32 45581570 (89.04%) 6270880 (12.25%) 39310690 (76.79%) Na3 48546886 48083922 0.0243 44.92 94.73 41217079 (85.72%) 5925798 (12.32%) 35291281 (73.40%) MNa1 53456026 52992586 0.0247 44.97 94.40 44028697 (83.08%) 6403570 (12.08%) 37625127 (71.00%) MNa2 47546416 47139186 0.0247 44.47 94.40 41628008 (88.31%) 5603741 (11.89%) 36024267 (76.42%) MNa3 55938524 55430944 0.0249 44.50 94.12 49350021 (89.03%) 6474285 (11.68%) 42875736 (77.35%) Table 1.
Statistical analysis of transcriptome sequencing data.
Figures
(10)
Tables
(1)