-

Figure 1.
Histograms of architectural/vigor traits collected in 2020 and 2021. TCA: trunk cross-sectional area.
-
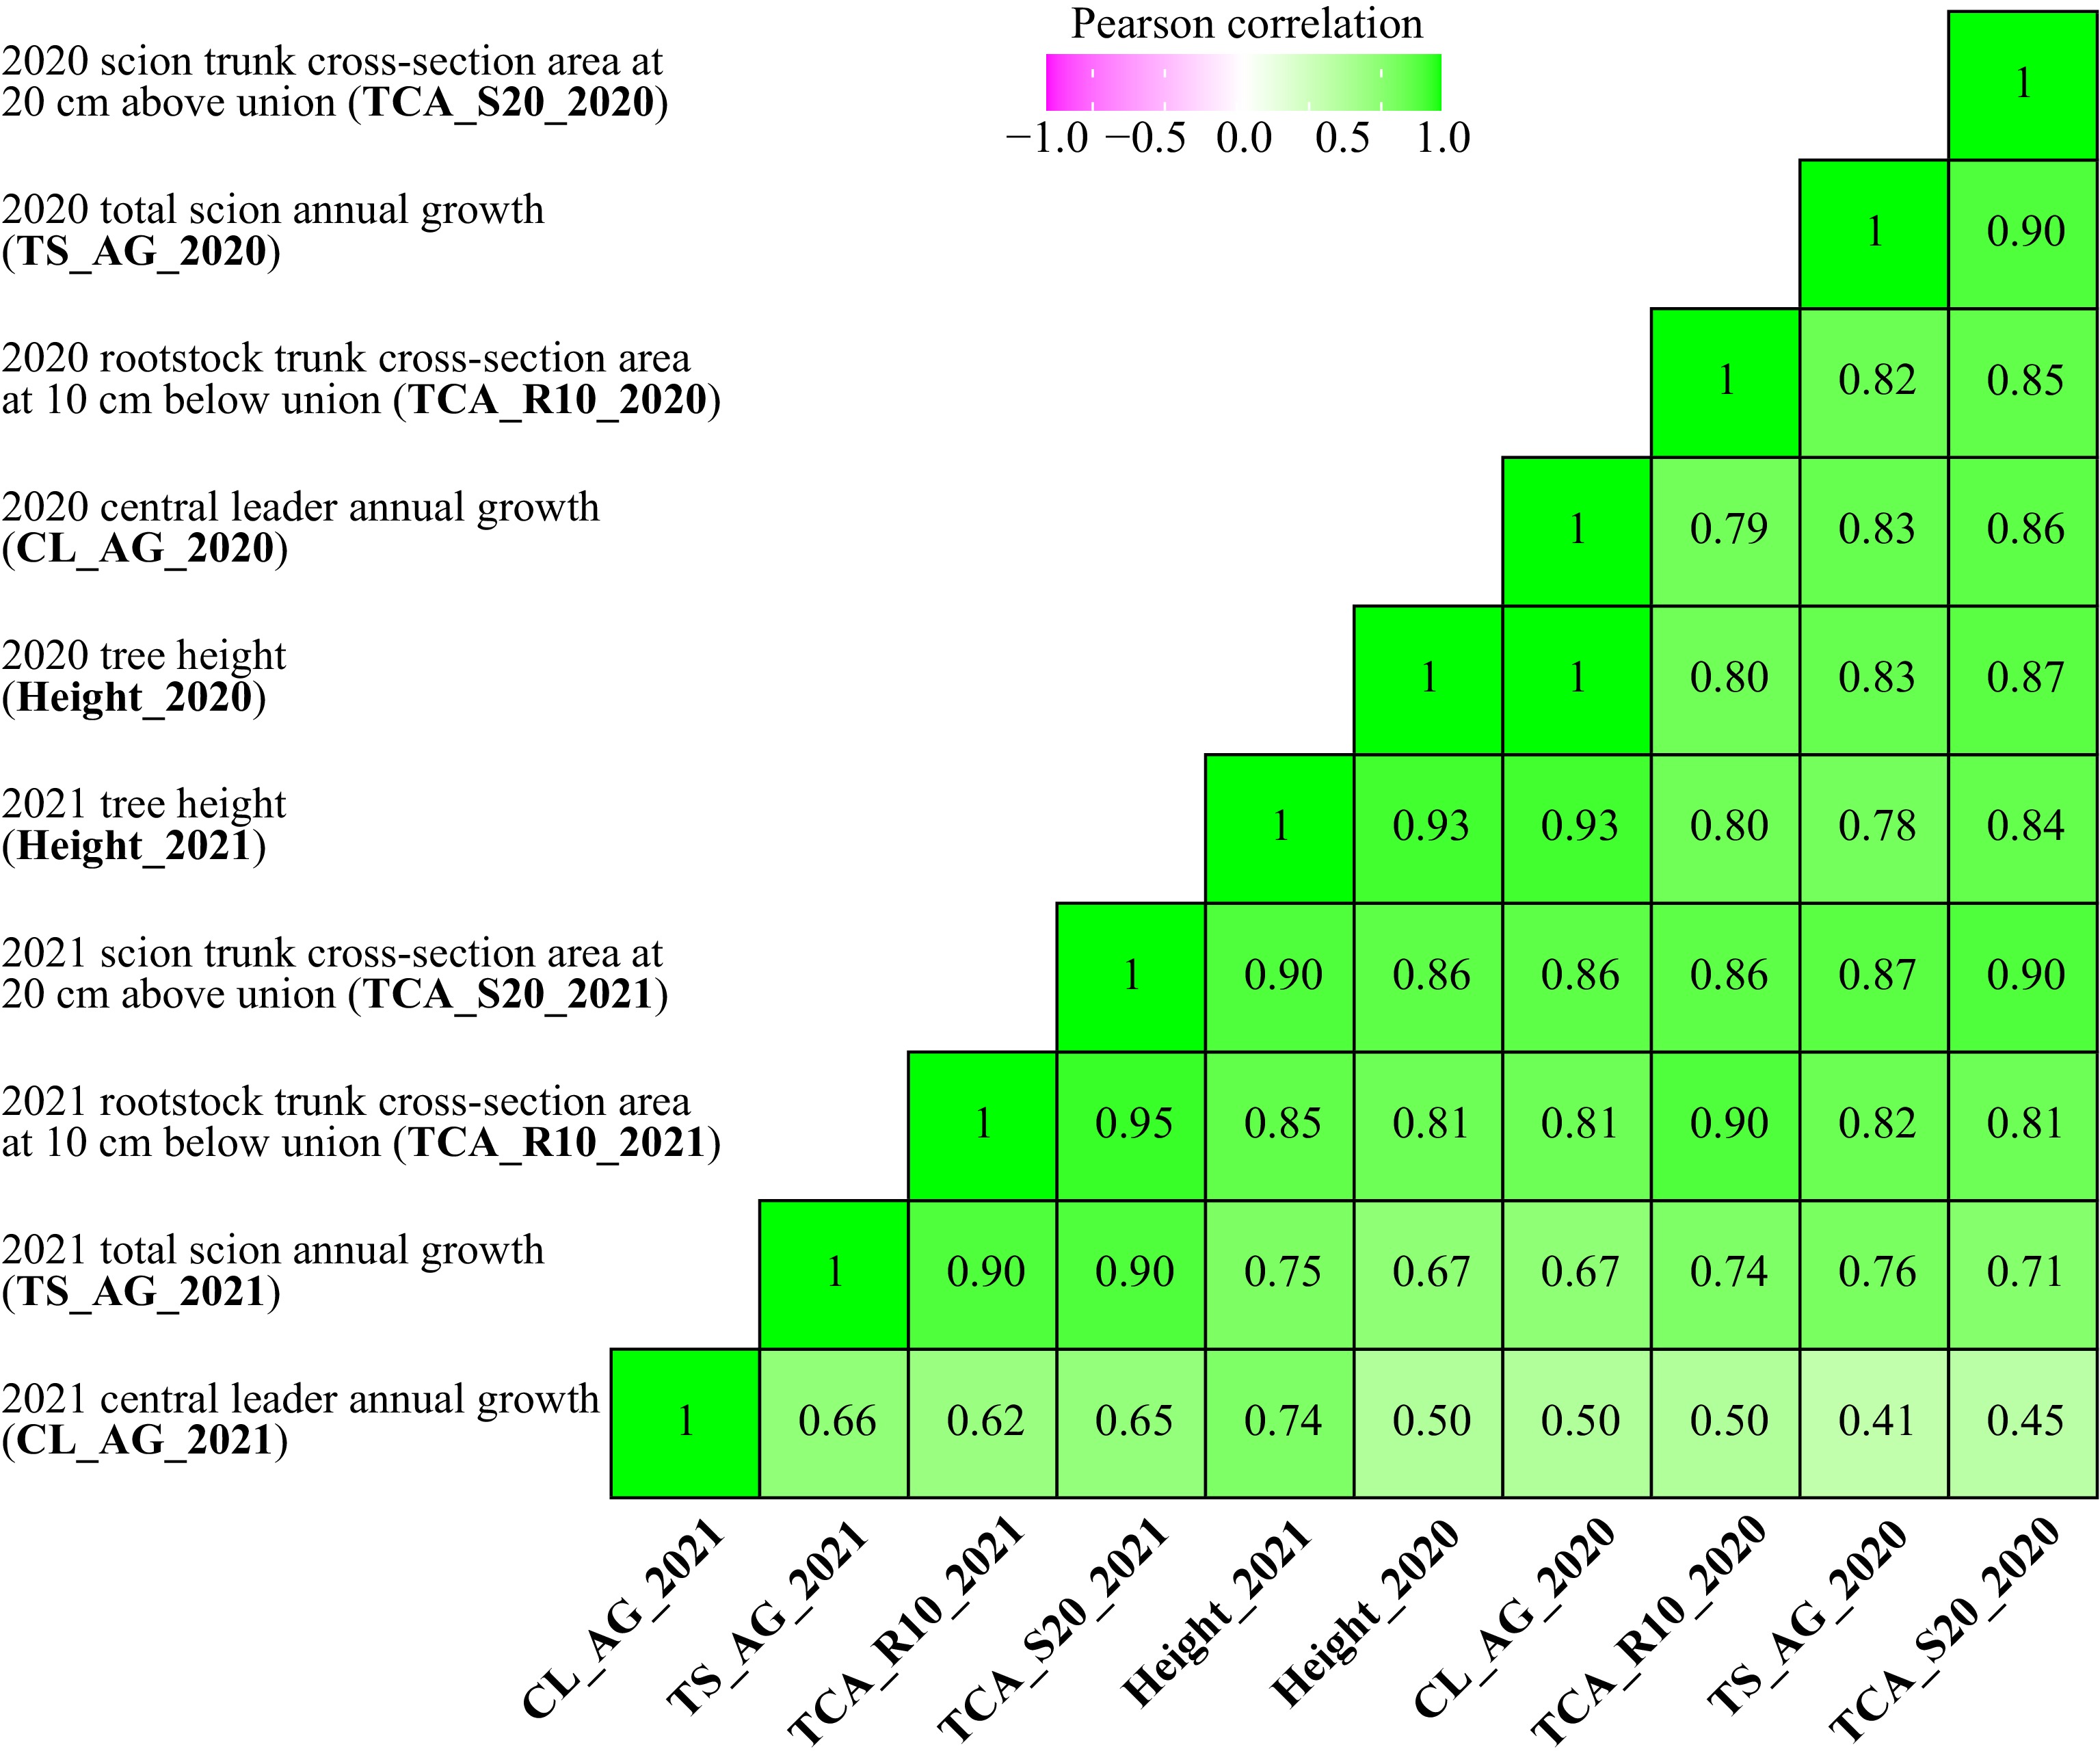
Figure 2.
Pearson’s correlations of 2020 and 2021 architectural/vigor traits. All coefficients are at significance levels of p < 1 × 10⁻⁴.
-

Figure 3.
Detection of quantitative trait loci associated with architectural/vigor traits on (a) chromosome 5, and (b) chromosome 15 of 'H4'. Solid-filled horizontal bars denote quantitative trait loci detected at 1.5-logarithm of odds (LOD) support. Genetic positions of haploblocks on chromosomes 5 and 15 are highlighted in magenta. TCA: trunk cross-sectional area.
-
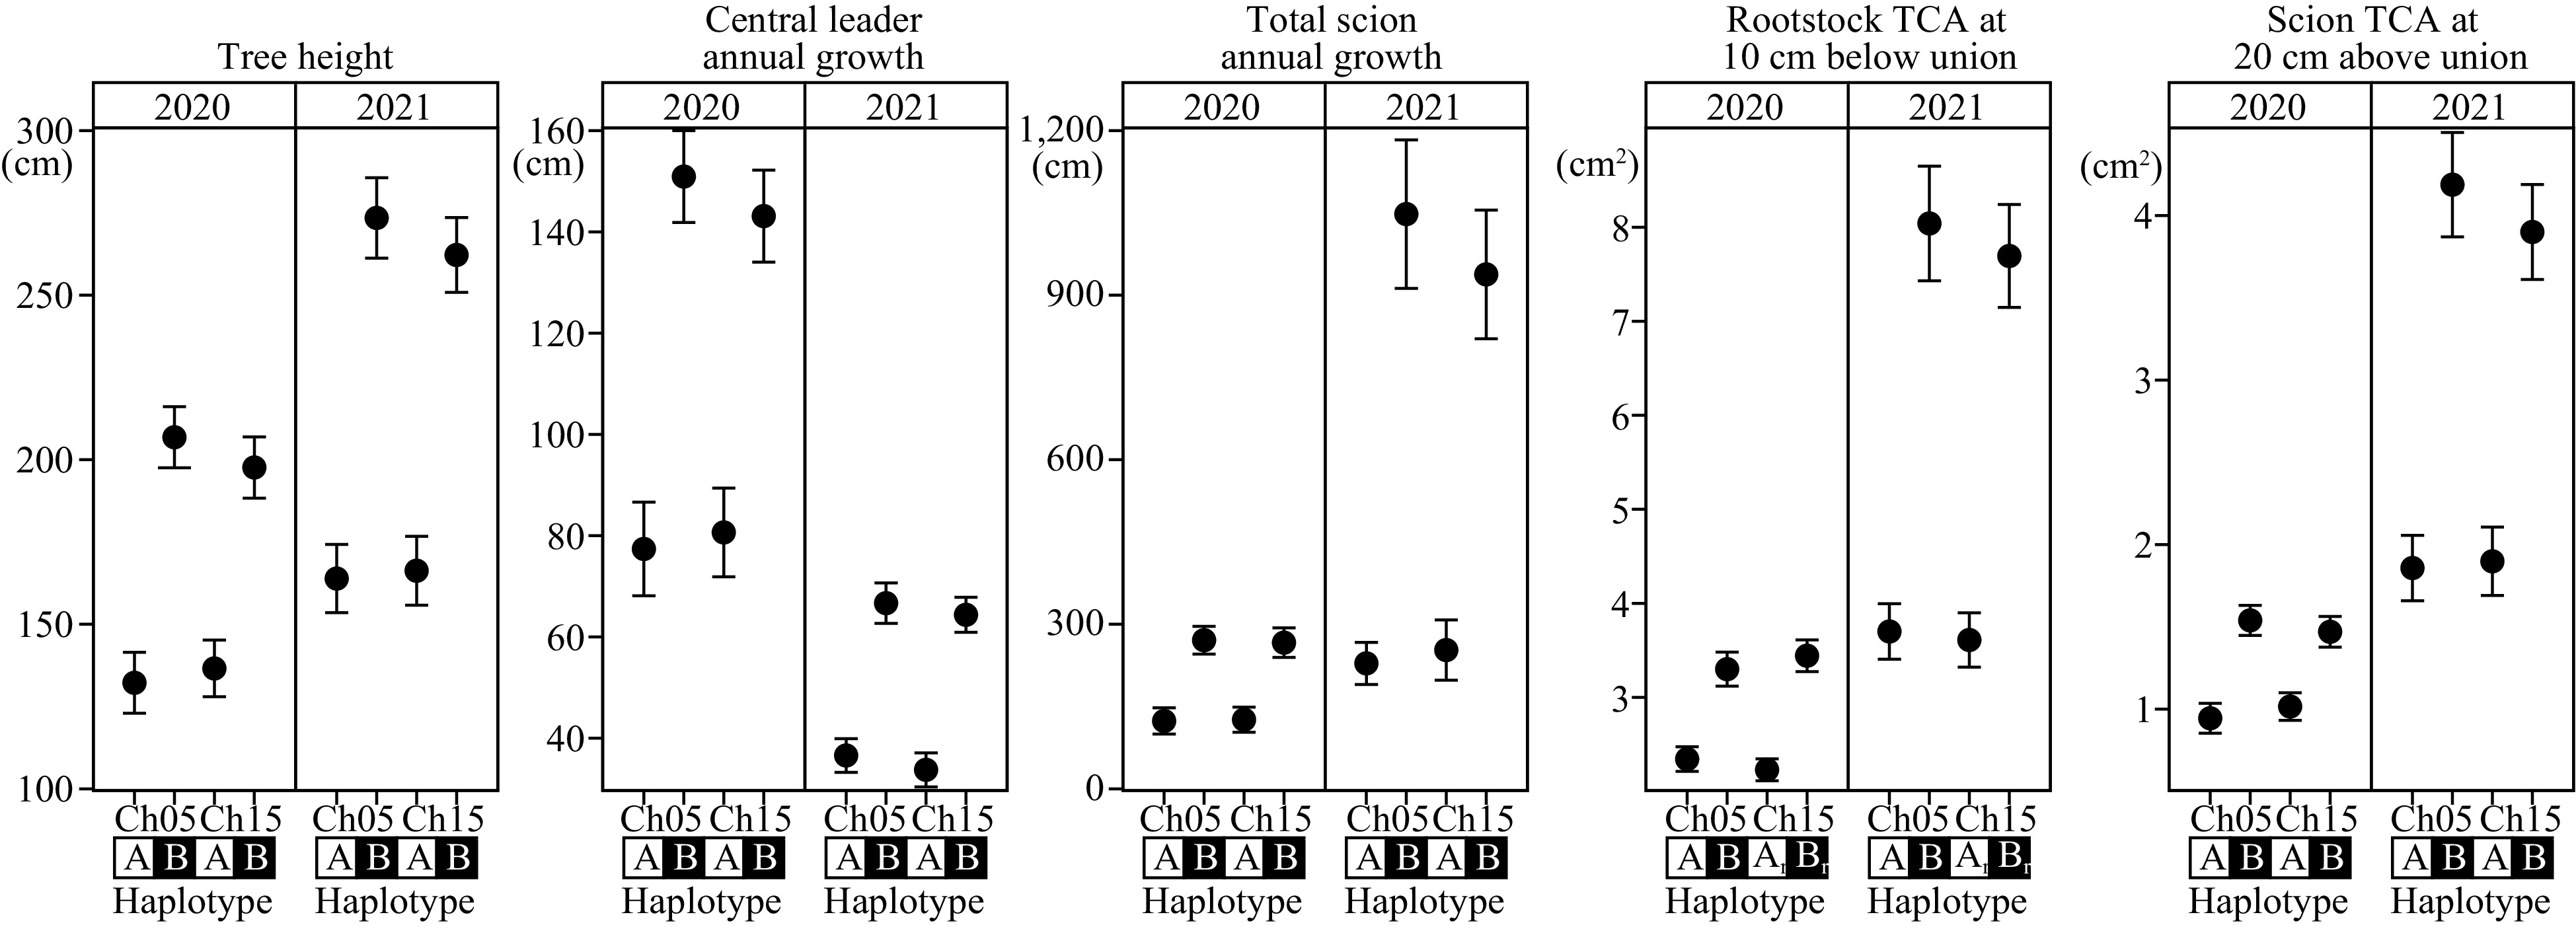
Figure 4.
Haplotype effects of architectural/vigor traits on chromosome 5 and 15 loci. All within-chromosome haplotypes were statistically significant at p ≤ 1 × 10⁻³. Dwarfing and vigorous haplotypes were denoted as A and B, respectively. Ch: chromosome; TCA: trunk cross-sectional area; 1r: chromosome 15 rootstock haploblock; 2r: chromosome 15 rootstock haploblock.
-
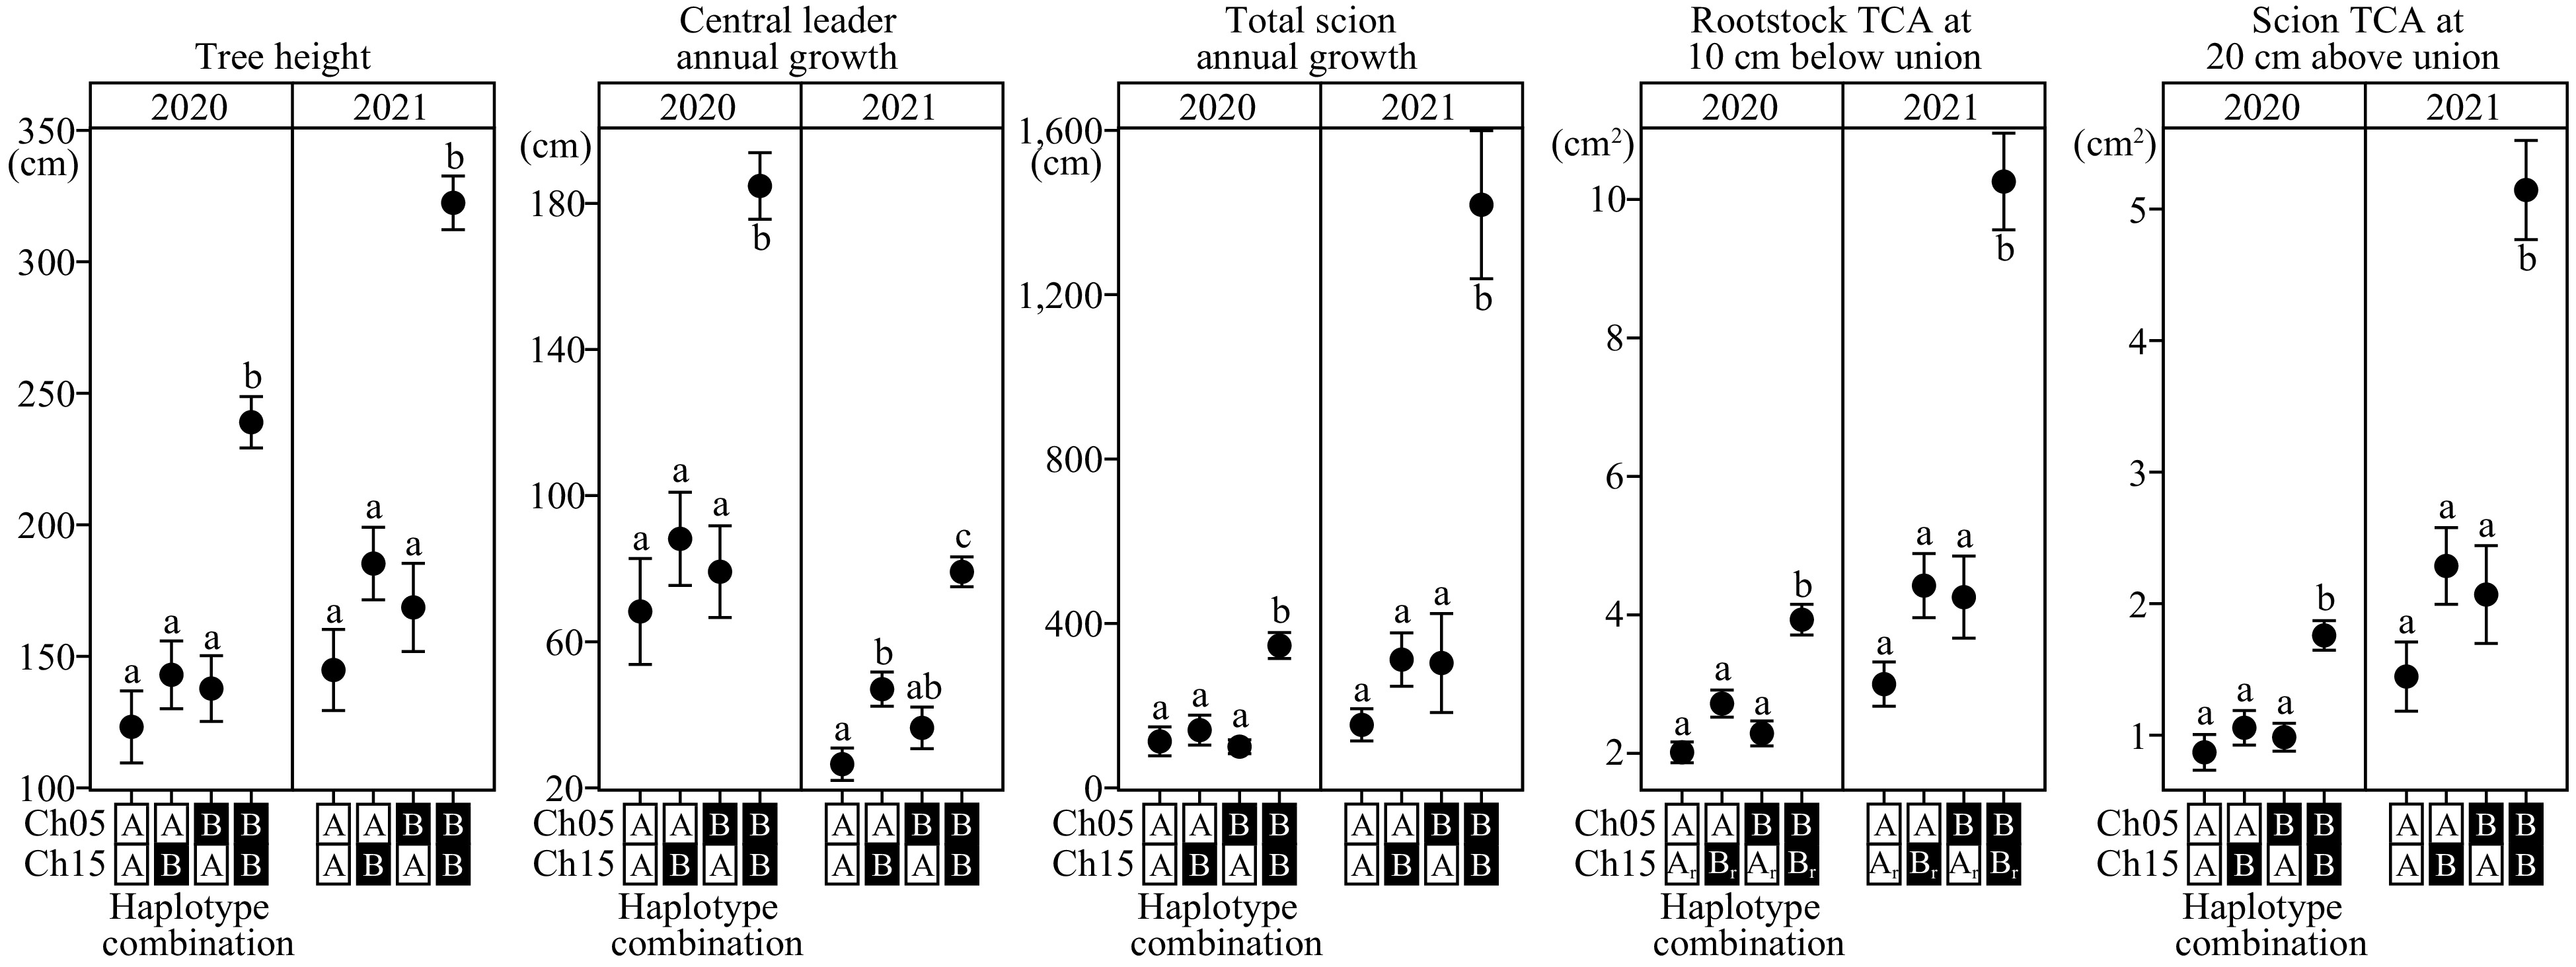
Figure 5.
Combined haplotype effects of architectural/vigor traits on chromosome 5 and 15 loci. Different mean separation letters were determined using Tukey’s Honest Significant Difference (p < 0.05). Dwarfing and vigorous haplotypes were denoted as A and B, respectively. The numbers of individuals for each haplotype combination, from left to right, are: 36, 33, 22, and 45. For rootstock TCA plot, the numbers of individuals for each haplotype combination, from left to right, are: 37, 32, 24, and 44. Ch: chromosome; TCA: trunk cross-sectional area; 1r: chromosome 15 rootstock haploblock; 2r: chromosome 15 rootstock haploblock.
-
Trait LODGW Ch. Highest LOD
markerPosition
(cM)LOD PVE (%) Ch. Highest LOD
markerPosition
(cM)LOD PVE (%) Height_2020 3.2 5 AX-172375939 84.7 7.4 16.4 15 AX-171863784 4.2 5.6 11.5 Height_2021 3.1 5 AX-172375939 84.7 9.8 20.8 15 AX-171863784 4.2 8.2 16.9 CL_AG_2020 3.1 5 AX-172375939 84.7 7.3 16.5 15 AX-171863784 4.2 5.9 12.5 CL_AG_2021 3.0 5 AX-172375939 84.7 7.5 15.9 15 AX-171863784 4.2 7.5 17.4 TS_AG_2020 2.9 5 AX-172375939 84.7 3.9 10.2 15 AX-171863784 4.2 3.6 8.6 TS_AG_2021 2.8 5 AX-172375939 84.7 6.7 15.8 15 AX-171863784 4.2 5.0 10.6 TCA_R10_2020 3.0 5 AX-172375939 84.7 4.6 11.0 15 AX-171982210 19.5 6.3 18.0 TCA_R10_2021 3.1 5 AX-172375939 84.7 8.5 20.6 15 AX-171982210 19.5 7.6 19.6 TCA_S20_2020 3.1 5 AX-172375939 84.7 4.7 11.7 15 AX-171863784 4.2 3.5 7.6 TCA_S20_2021 3.1 5 AX-172375939 84.7 7.9 17.4 15 AX-171863784 4.2 6.7 13.9 LODGW: Genome-wide logarithm of odds significance threshold (α = 0.05); Ch.: chromosome; LOD: logarithm of odds; PVE: phenotypic variance explained; Height: tree height; CL_AG: central leader annual growth; TS_AG: total scion annual growth; TCA_R10: rootstock trunk cross-sectional area at 10 cm below union; TCA_S20: scion trunk-sectional area at 20 cm above union. Table 1.
QTL results (on 'H4' map) for vigor traits phenotyped in two years.
-
Trait Model: y ~ Q1 + Q2 Model: y ~ Q1 + Q2 + Q1 : Q2 QTLch5 (%) QTLch15 (%) Total (%) QTLch5 (%) QTLch15 (%) Interaction (%) Total (%) Height_2020 16.4 11.5 27.9 25.8 20.8 9.3 44.2 Height_2021 20.8 16.9 37.6 30.6 26.7 9.8 56.8 CL_AG_2020 16.5 12.5 28.9 26.4 22.3 9.9 46.0 CL_AG_2021 15.9 17.4 33.2 23.4 24.9 7.5 49.1 TS_AG_2020 10.2 8.6 18.8 20.8 19.2 10.6 33.7 TS_AG_2021 15.8 10.6 26.4 26.9 21.7 11.1 44.0 TCA_R10_2020 11.0 18.0 28.9 19.1 26.1 8.1 43.0 TCA_R10_2021 20.6 19.6 40.2 30.7 29.6 10.1 57.7 TCA_S20_2020 11.7 7.6 19.3 20.2 16.2 8.5 32.6 TCA_S20_2021 17.4 13.9 31.3 26.3 22.8 8.9 48.0 y: variance/effects; Q: quantitative trait locus (QTL); ch: chromosome; Height: tree height; CL_AG: central leader annual growth; TS_AG: total scion annual growth; TCA_R10: rootstock trunk cross-sectional area at 10 cm below union; TCA_S20: scion trunk-sectional area at 20 cm above union. Table 2.
QTL effects estimated with two models on 'H4' chromosome 5 and 15 haplotypes.
-
Trait Chromosome 5 haplotype from 'H4' p Chromosome 15 haplotype from 'H4' p Dwarfing (n) Vigorous (n) Dwarfing (n) Vigorous (n) Height_2020 5A 63 5B 62 9.5E-08 15_1A 57 15_1B 78 8.0E-06 Height_2021 5A 63 5B 62 4.8E-10 15_1A 57 15_1B 78 2.1E-08 CL_AG_2020 5A 63 5B 62 1.1E-07 15_1A 57 15_1B 78 5.1E-06 CL_AG_2021 5A 63 5B 62 7.5E-08 15_1A 57 15_1B 78 9.4E-09 TS_AG_2020 5A 63 5B 62 4.8E-05 15_1A 57 15_1B 78 2.8E-04 TS_AG_2021 5A 63 5B 62 9.7E-08 15_1A 57 15_1B 78 6.0E-06 TCA_R10_2020 5A 63 5B 62 4.1E-05 15_2A 62 15_2B 76 8.3E-08 TCA_R10_2021 5A 63 5B 62 6.5E-09 15_2A 62 15_2B 76 1.3E-08 TCA_S20_2020 5A 63 5B 62 1.0E-05 15_1A 57 15_1B 78 6.7E-04 TCA_S20_2021 5A 63 5B 62 1.1E-08 15_1A 57 15_1B 78 6.2E-07 n: number of seedlings with the haplotype; Height: tree height; CL_AG: central leader annual growth; TS_AG: total scion annual growth; TCA_R10: rootstock trunk cross-sectional area at 10 cm below union; TCA_S20: scion trunk-sectional area at 20 cm above union. Table 3.
One-way analysis of variance (ANOVA) for dwarfing versus vigorous haplotype on chromosomes 5 and 15 of 'H4'.
Figures
(5)
Tables
(3)