-
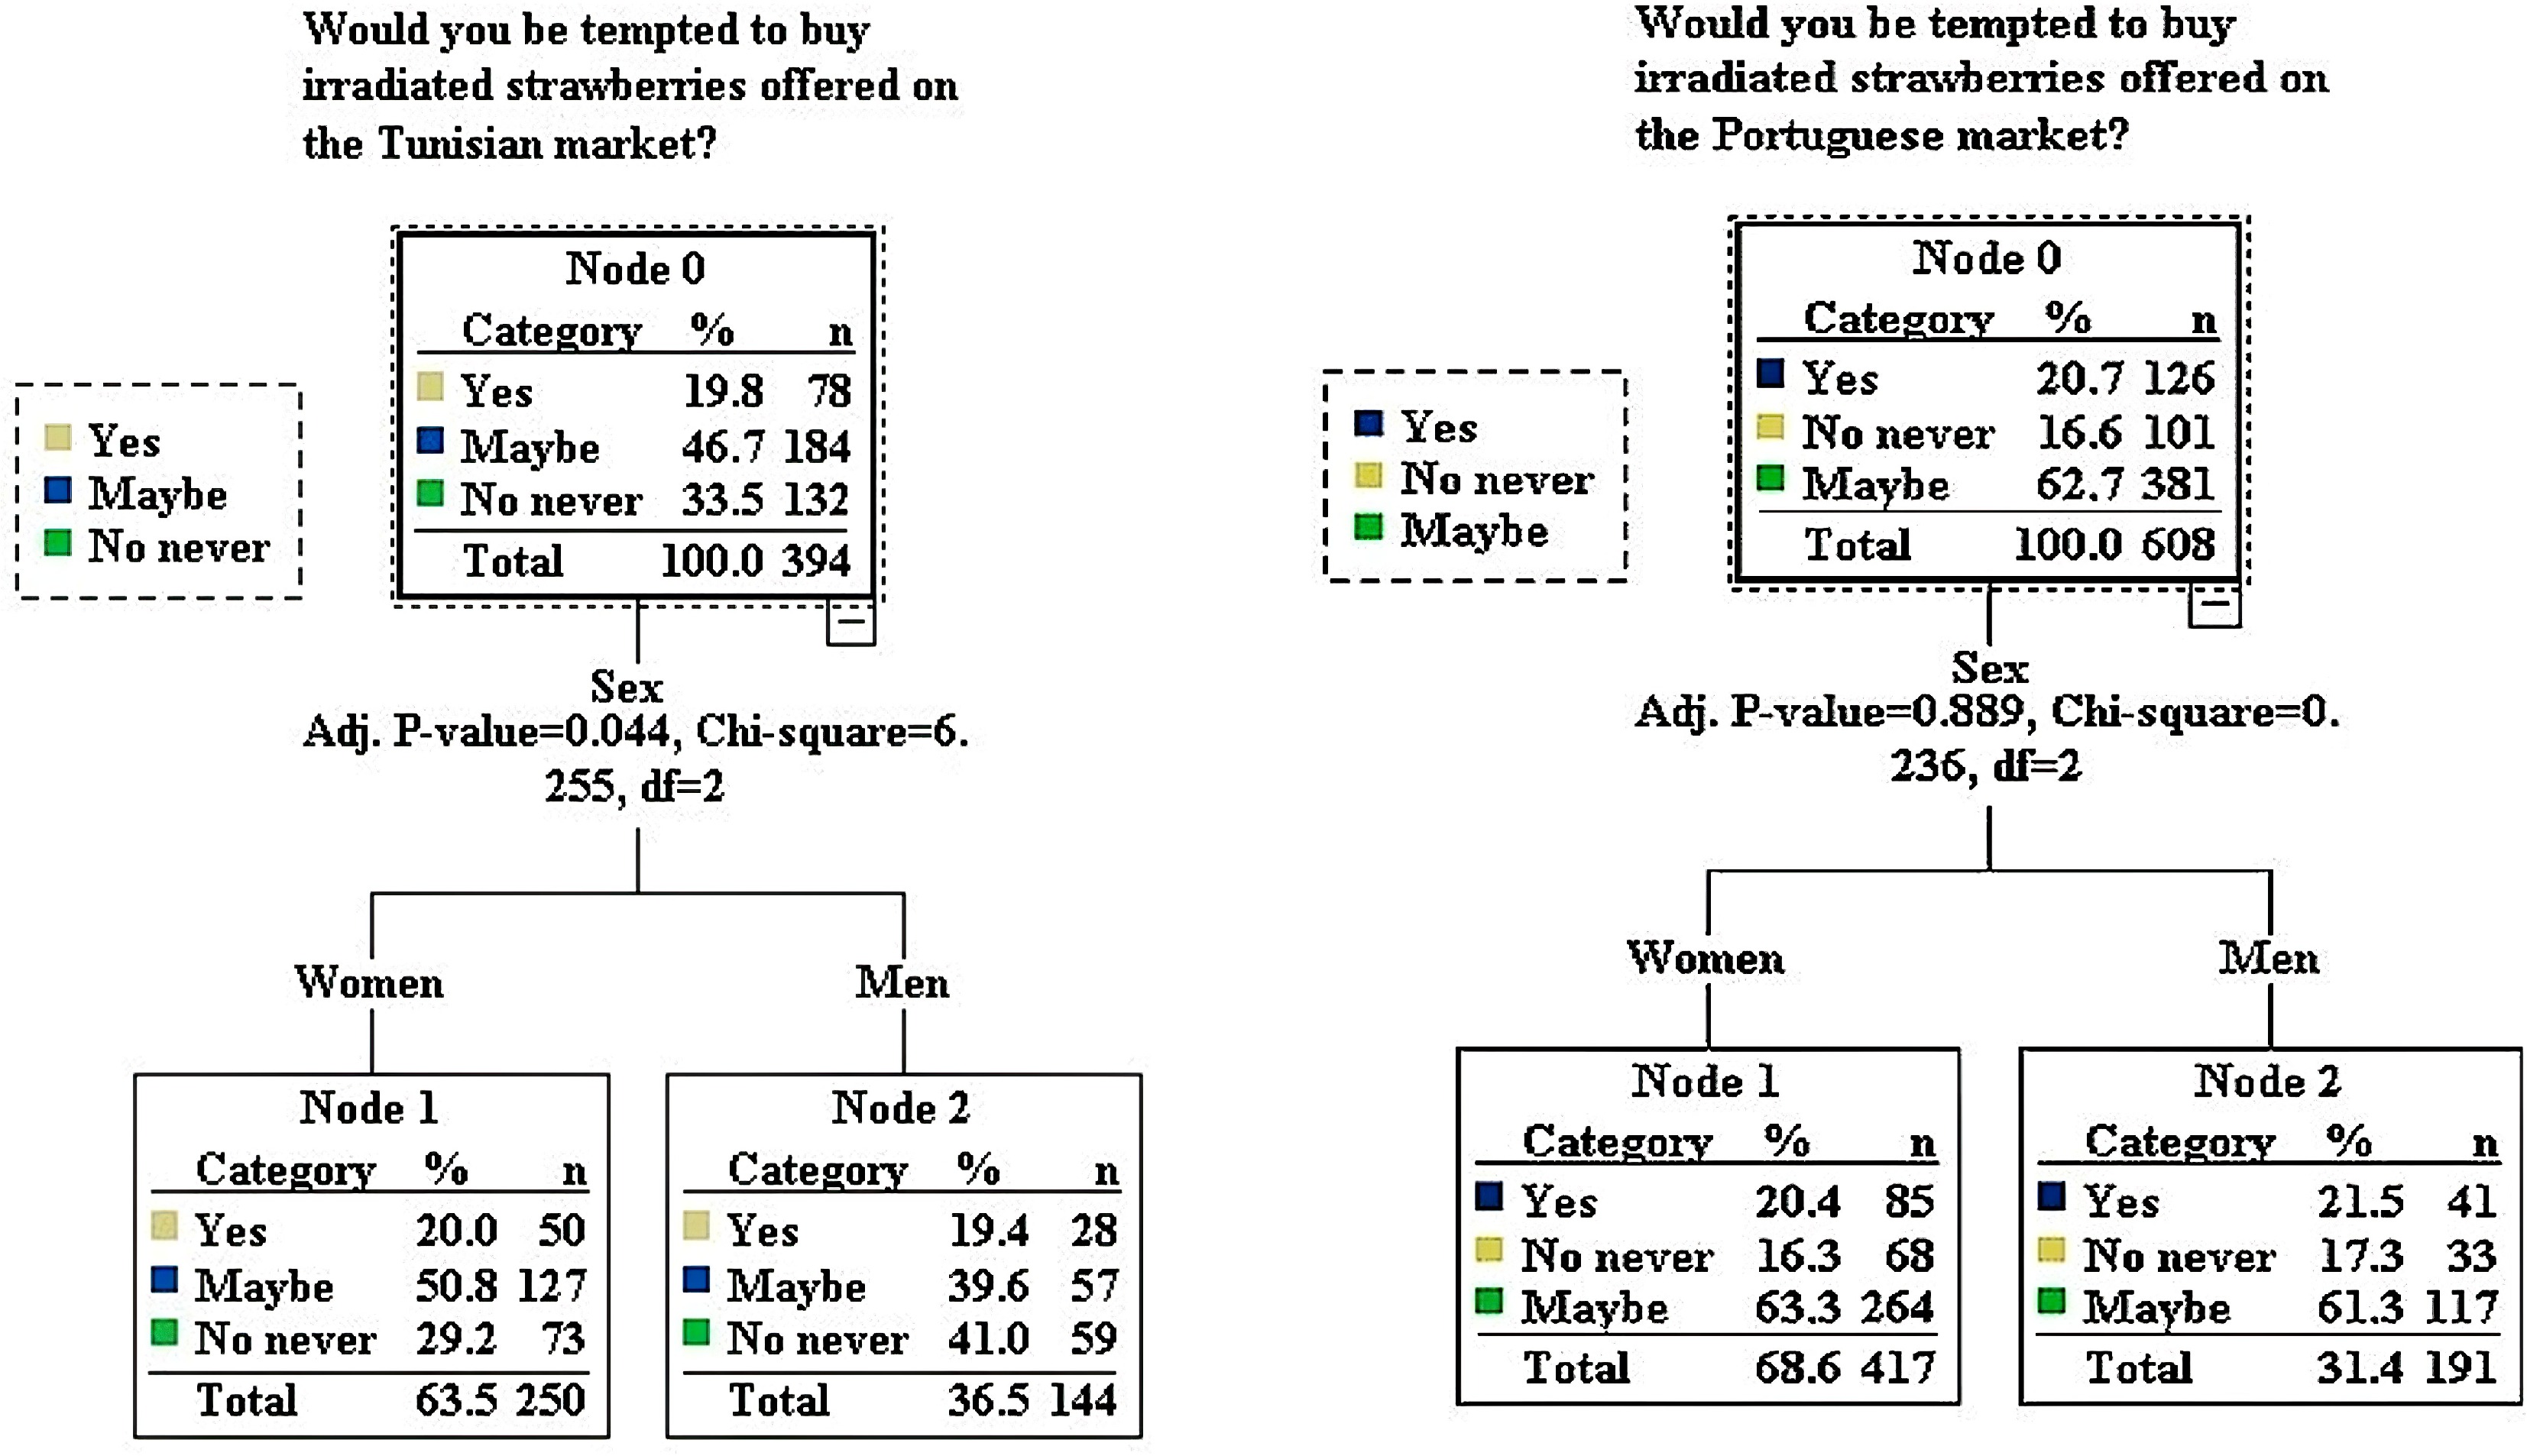
Figure 1.
Tunisian and Portuguese decision tree for purchase of irradiated strawberries.
-
Tunisia Portugal Workforce Percentage (%) Workforce Percentage (%) Gender Female 250 63.5 417 68.6 Man 144 36.5 191 31.4 Age (years old) < 20 11 2.8 3 0.5 20−29 203 51.5 73 12 30−39 119 30.2 161 26.5 40−49 43 10.9 140 23 50−60 12 3 101 16.6 > 60 6 1.5 130 21.4 Profession Secondary student 3 0.8 1 0.2 University student 120 30.5 30 4.8 PhD/Postdoctoral researcher 12 3 22 3.6 Unemployed graduate 29 7.4 14 2.3 Domestic 4 1 8 1.3 Retired 8 2 88 14.5 Merchant/Trader/Self-employed 5 1.3 37 6.1 Civil servant/employee (public or private) 213 54.1 408 67.2 Geographical area Capital 279 70.8 398 65.6 North 53 13.5 60 9.9 South 28 7.1 28 4.6 Center 17 4.3 72 11.8 Living abroad 17 4.3 26 4.3 Azores archipelago − − 20 3.3 Madeira archipelago − − 4 0.7 Table 1.
Respondents' characteristics.
-
Tunisia Portugal Workforce Percentage (%) Workforce Percentage (%) Yes 222 56.3 369 39.3 No 172 43.7 239 60.7 Table 2.
Number of answers to whether or not irradiated foods are known.
-
Sources Tunisia Portugal Percentage of observations (%) Percentage of observations (%) Special event: exhibitions, fairs, scientific seminars 8.2 24.1 Internet or TV 71.4 41.4 Scientific papers or magazines 21.4 44.3 Places, points of sale: hypermarket, supermarket 6.4 1.7 In a course or training 34.5 28.3 Table 3.
Sources of information on food irradiation.
-
Country Published survey on scientific journals with impact factor Population investigated
(n)Percentage of people
who do not know
about irradiation (%)References North Africa Tunisia This work (394) 43.7 This work European Union France − Portugal This work (608) 60.7 This work Italy 392 84.2 [27] Other Countries Korea 700 18 [31] Chili 497 76.5 [30] Brazil 168
11958
17[28]
[32]Canada 36 − [33] USA 160 32 [34] Table 4.
Published surveys on food irradiation in the period year 1992−2022.
-
Tunisia Portugal Workforce Percentage
(%)Workforce Percentage
(%)Yes 57 13.1 50 8.2 No 100 23 72 11.8 I don't know
(maybe without
noticing)277 63.8 486 79.9 Table 5.
Question concerning the population of Tunisia and Portugal's consumption of irradiated food.
-
Do you think that the consumption of irradiated products presents a health risk? Tunisia Portugal Yes No I do not know Yes No I do not know Workforce and percentage included in: Does it make you want to consume irradiated food? Yes 26 43 73 10 140 67 18.3% 30.3% 51.4% 4.6% 64.5% 30.9% No 125 2 40 76 3 42 74.9% 1.2% 24.0% 62.8% 2.5% 34.7% I do not know 28 15 42 33 24 213 32.9% 17.6% 49.4% 12.2% 8.9% 78.9% Table 6.
Cross table: Desire to consume irradiated food considering health risk.
-
Price difference Tunisia Portugal Yes No Yes No Would you be tempted to buy irradiated strawberries
offered on the marketYes 55 23 116 10 70.5% 29.5% 92.1% 7.90% Maybe 77 107 45 56 41.8% 58.2% 44.6% 55.4% No 28 104 292 89 21.2% 78.8% 76.6% 23.4% Table 7.
Cross table: Desire to buy irradiated strawberries offered on the market considering different prices.
Figures
(1)
Tables
(7)