-
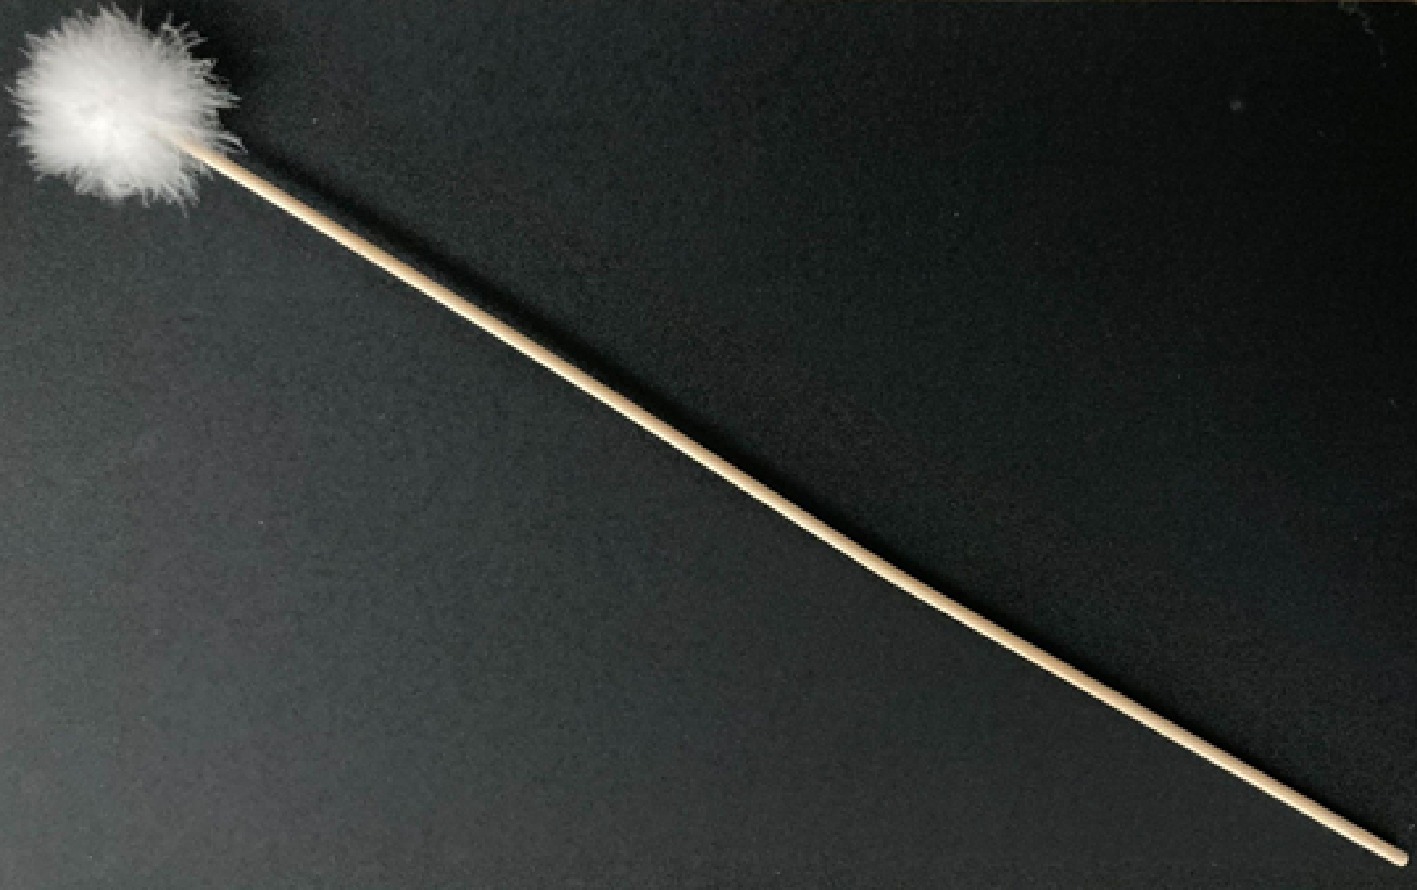
Figure 1.
Tool used for pollination.
-
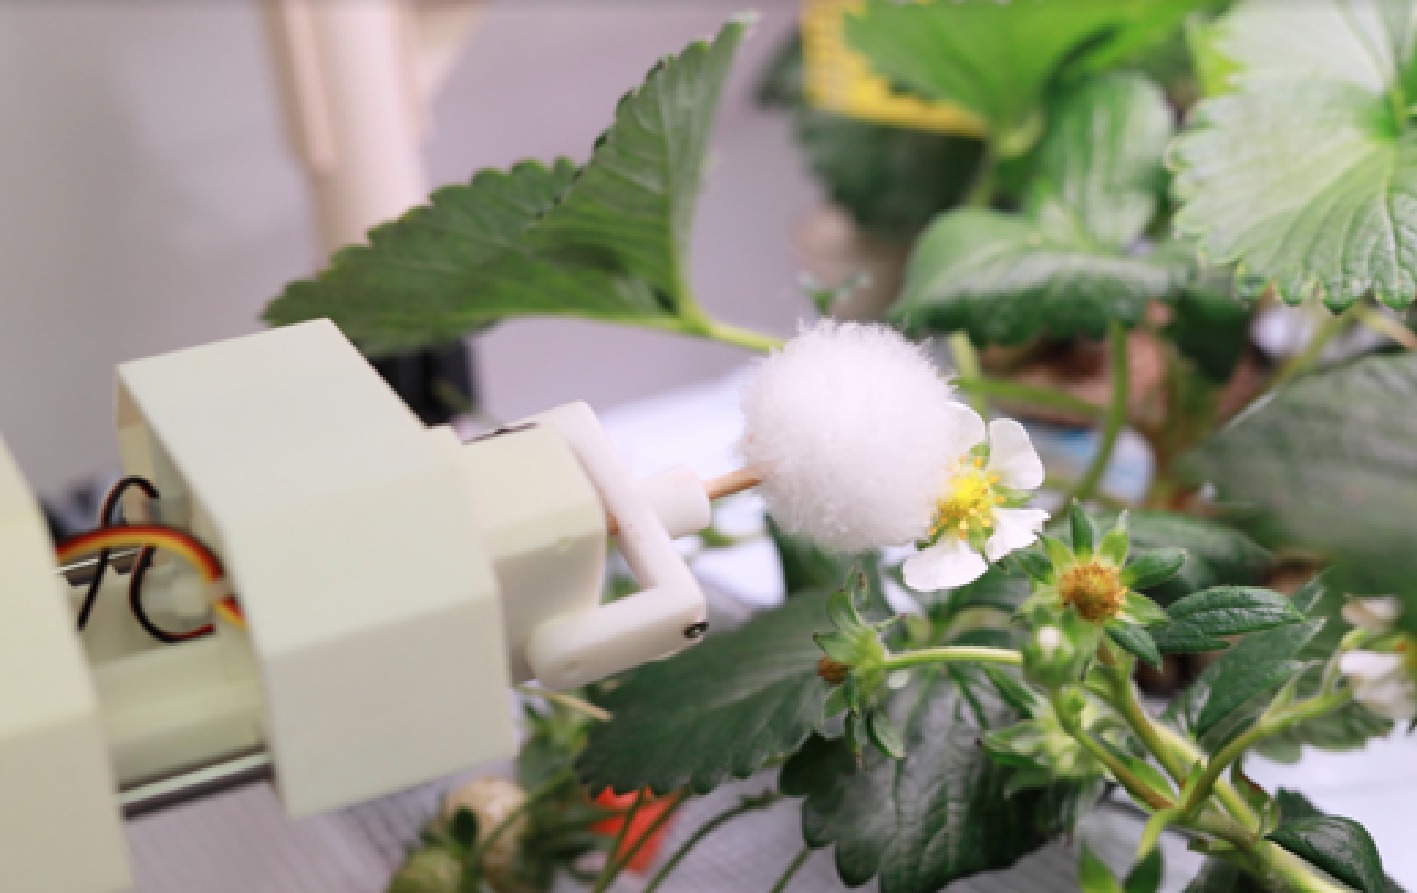
Figure 2.
Robot pollination.
-
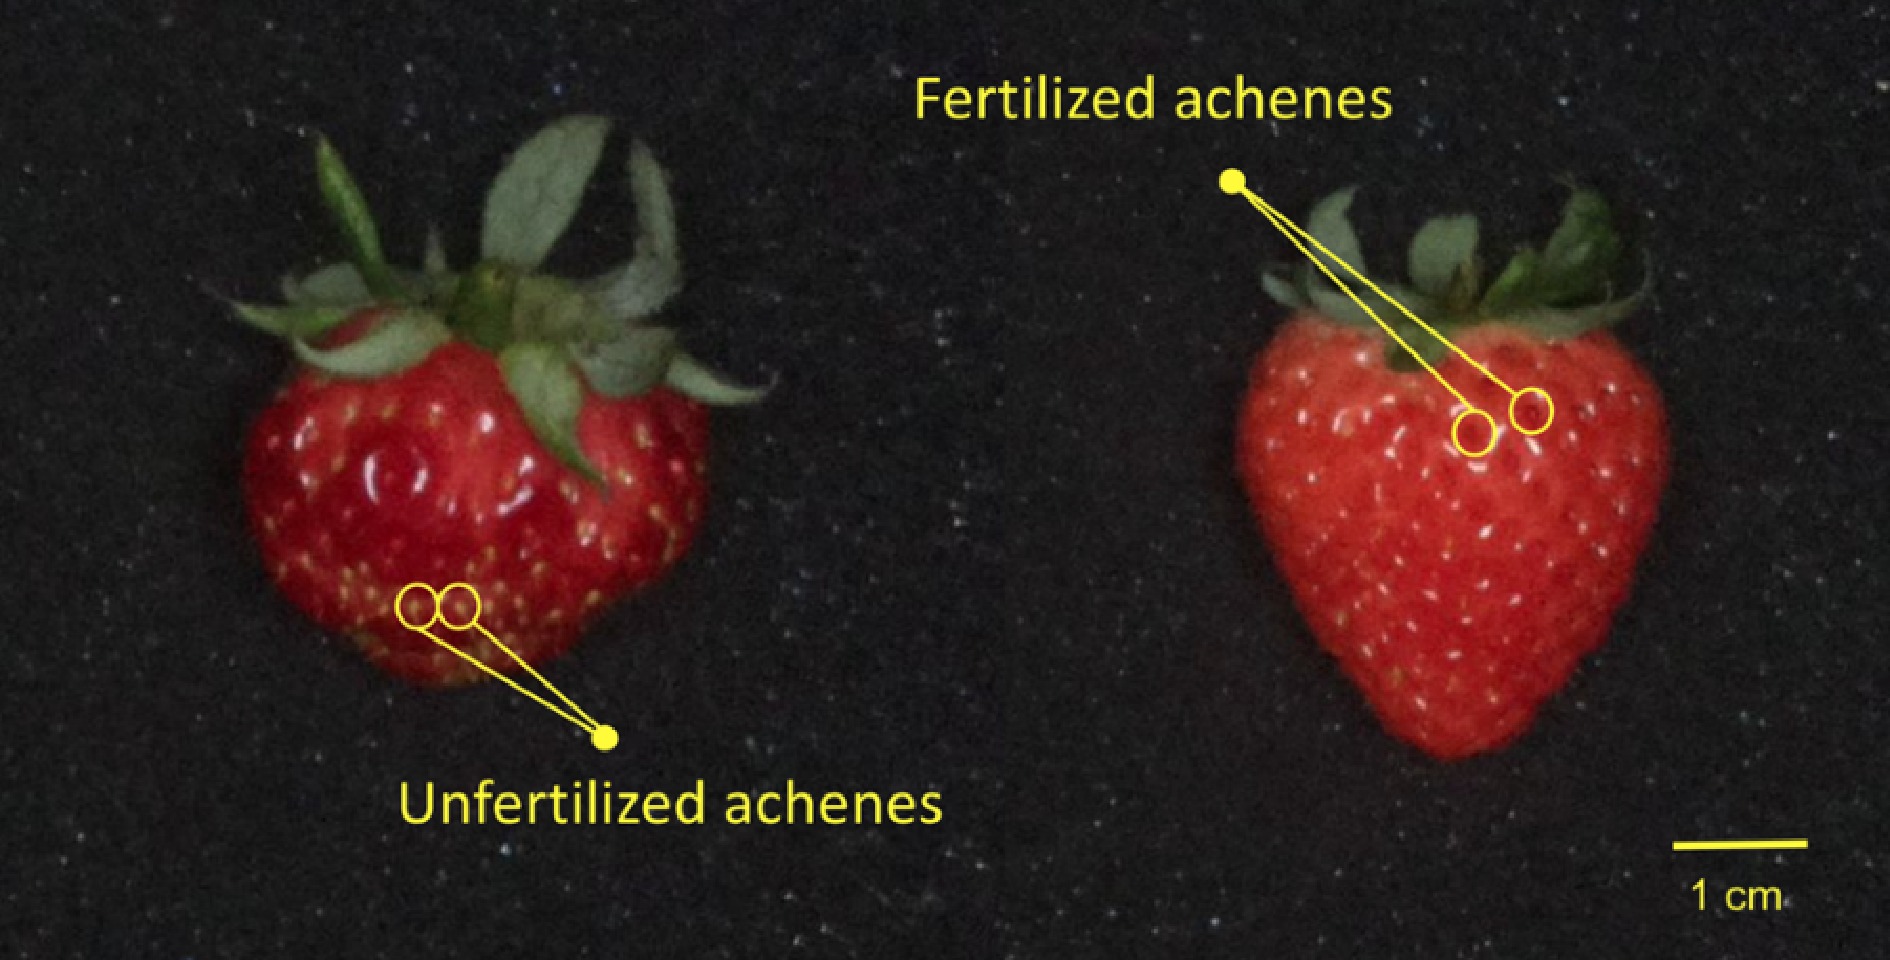
Figure 3.
Fertilized and unfertilized achenes of a sample strawberry. Fertilized achenes are turning red and the fleshy surrounding skin can be observed. Unfertilized achenes are green and the surrounding skin is not enlarged.
-
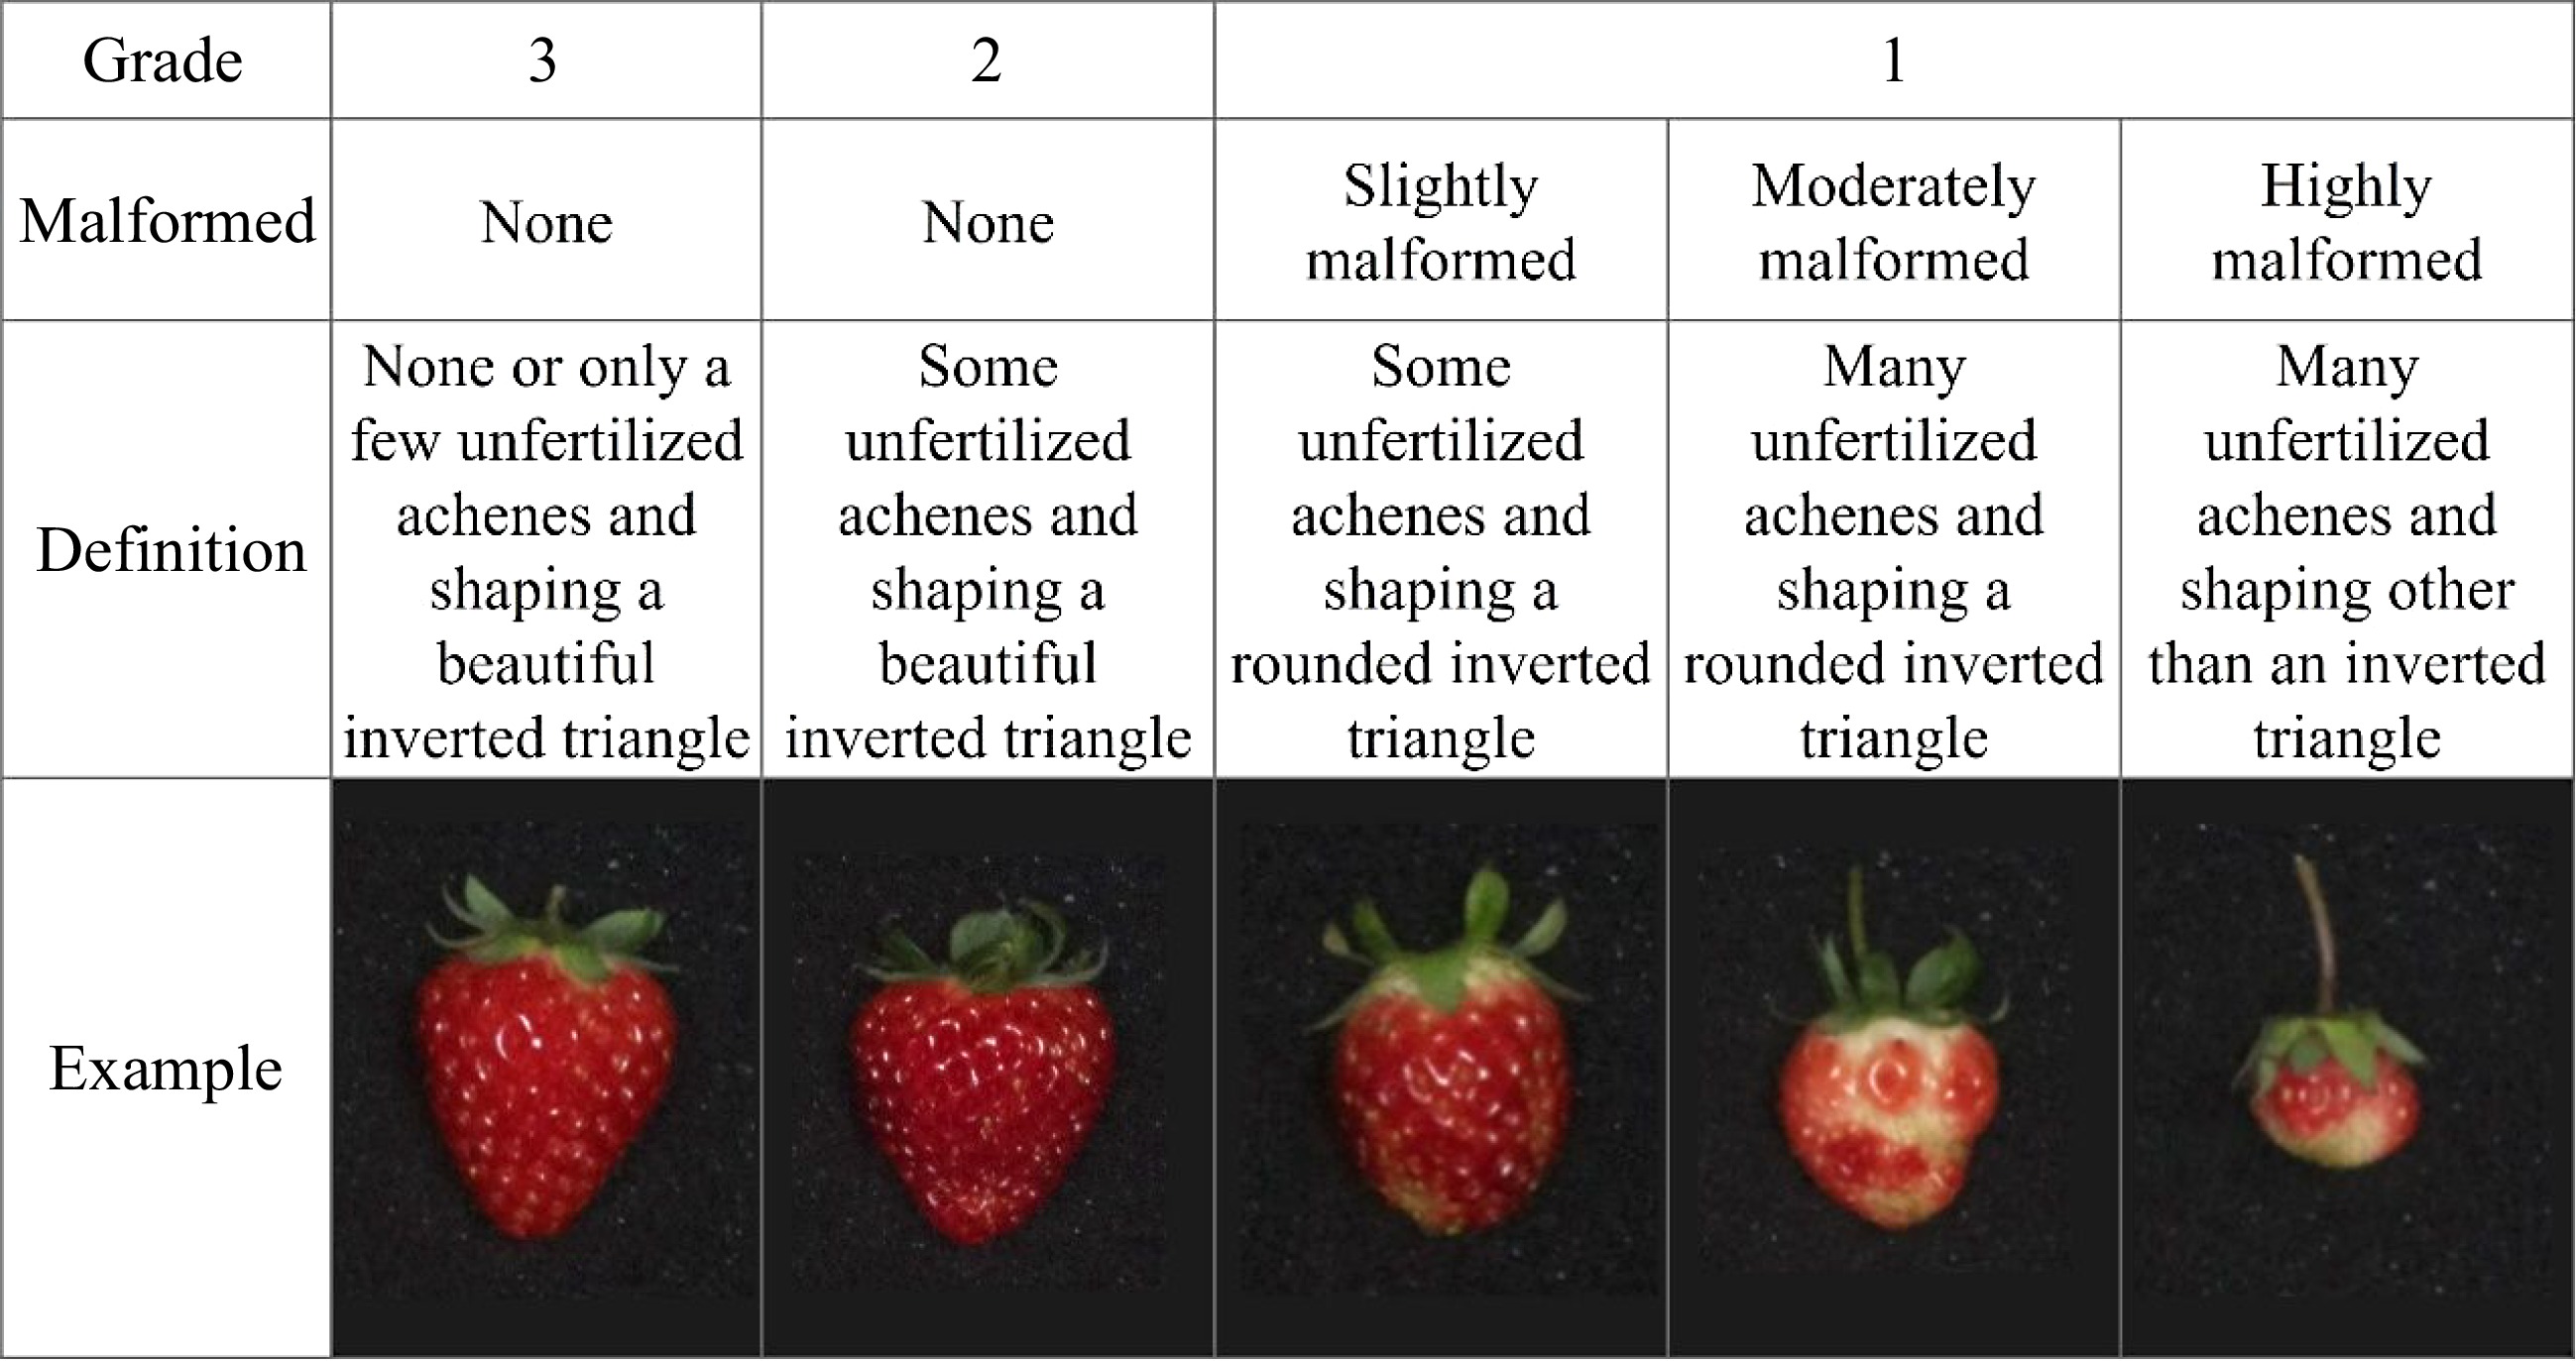
Figure 4.
Grade classification of strawberry fruits.
-
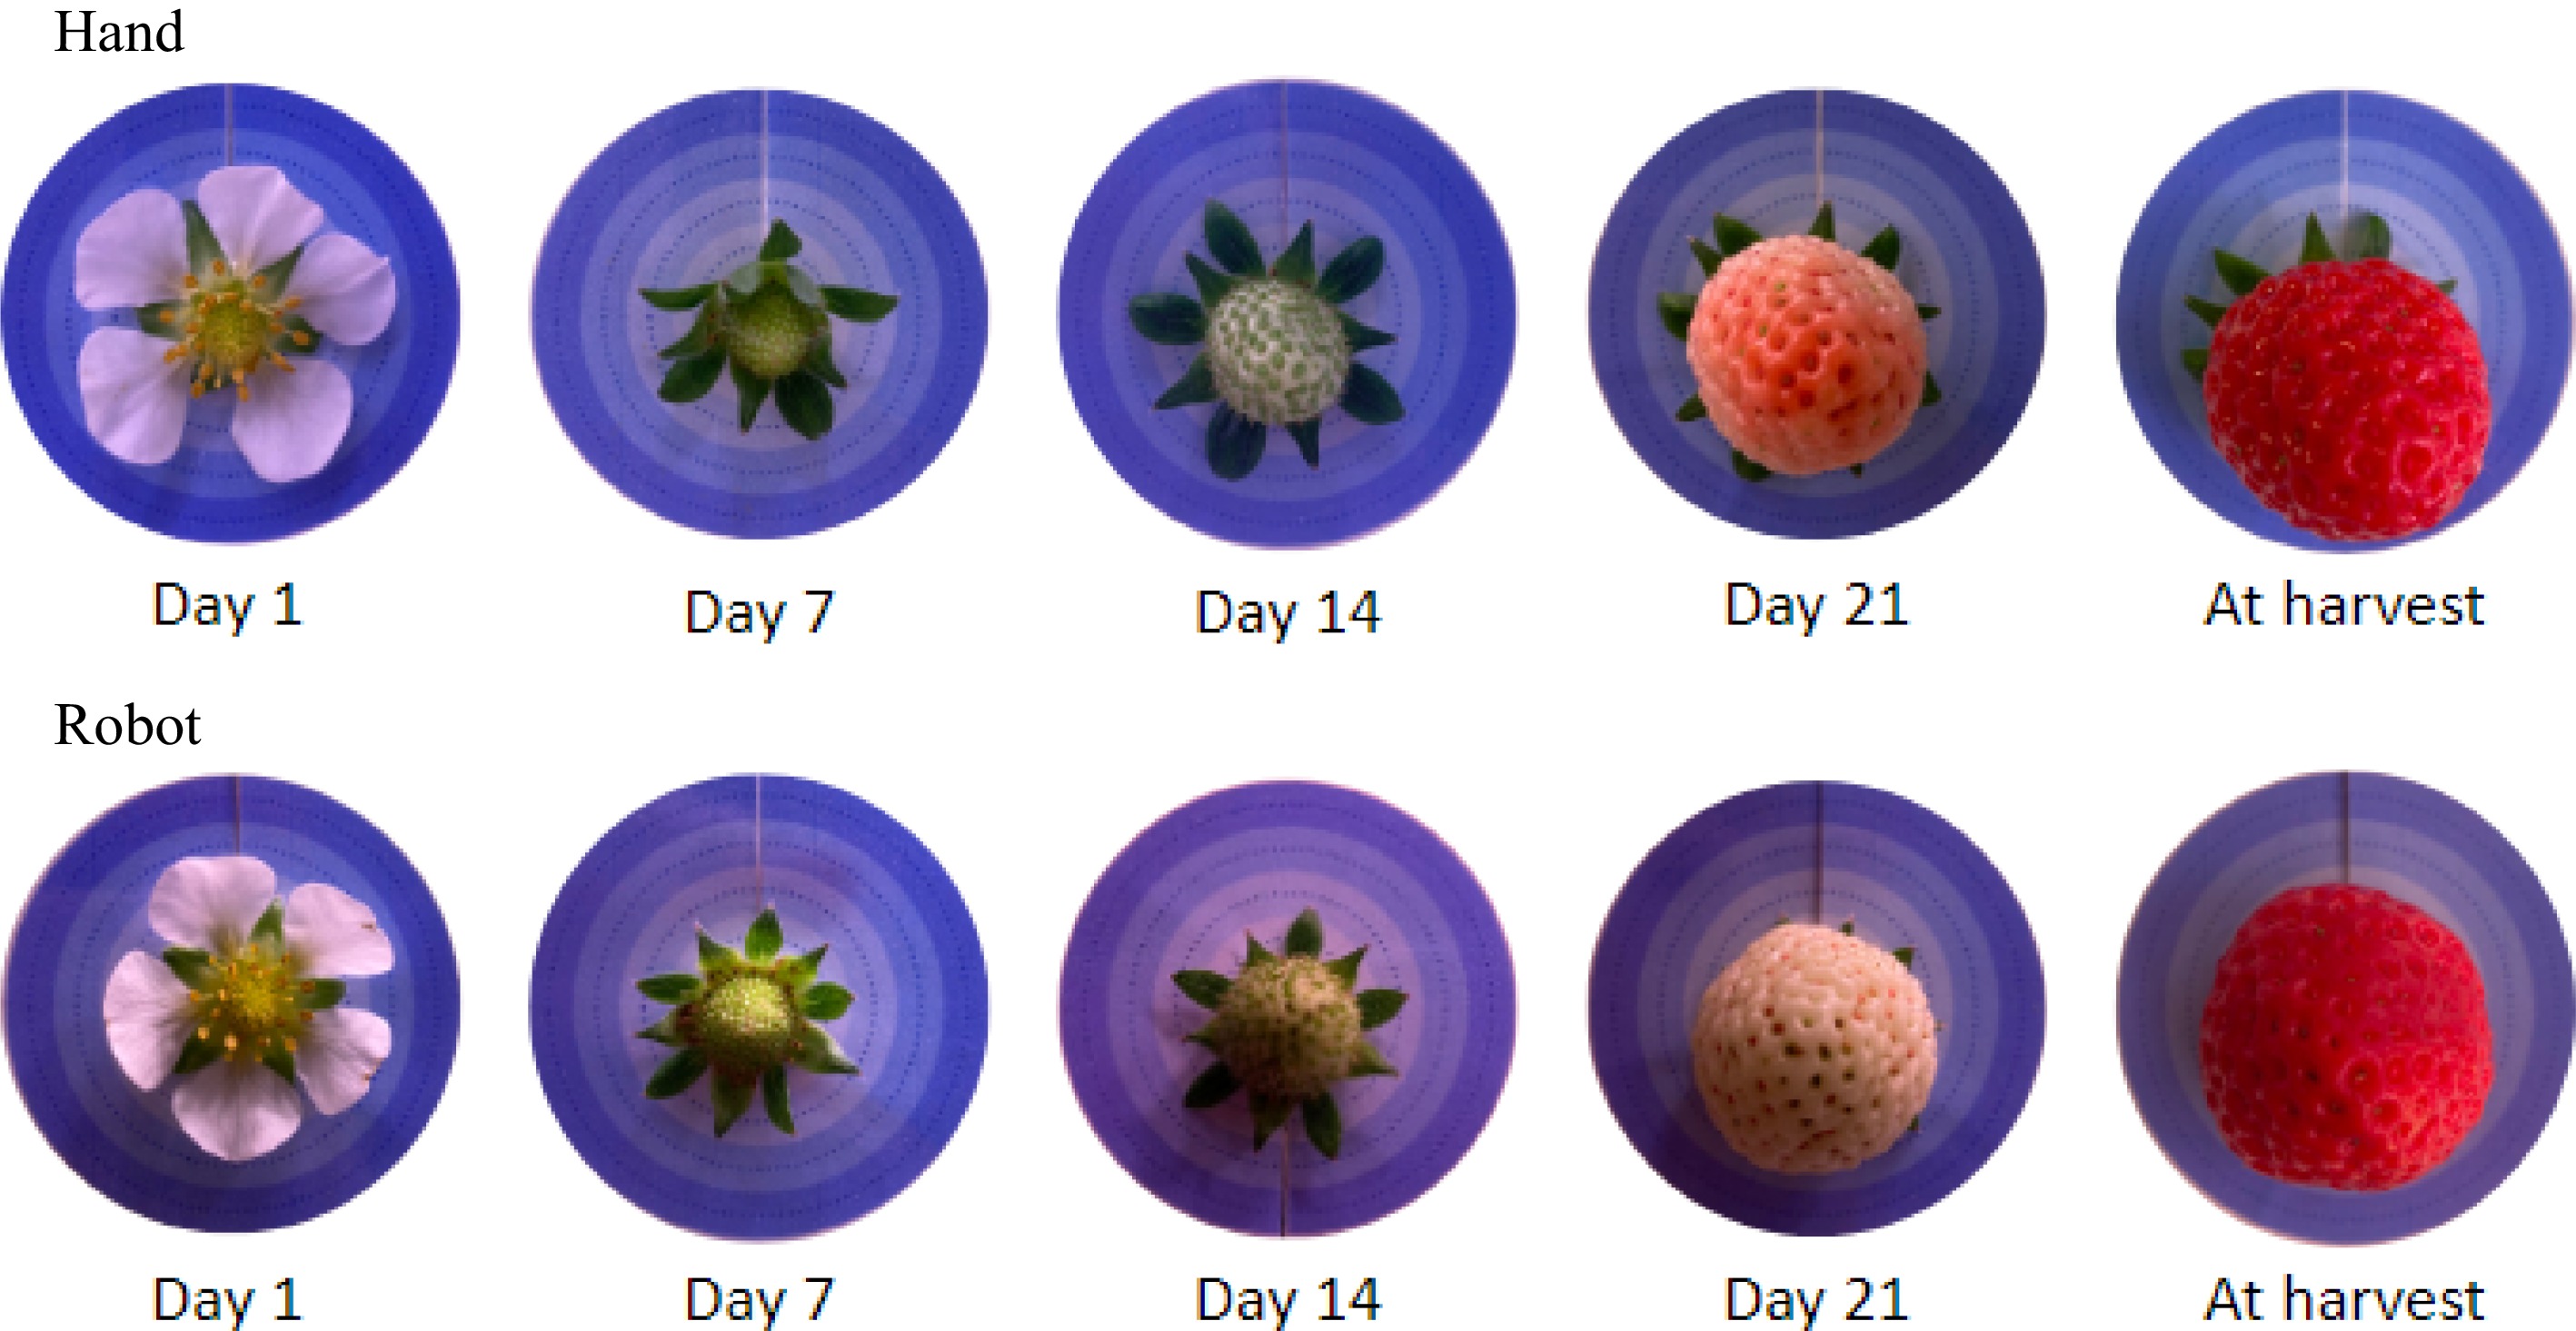
Figure 5.
Development of strawberry fruits.
-
Number of flowers/fruits*** Total weight of fruits (g) Hand Robot Hand Robot Fruited flowers** Grade 3 33 (66) (72) 27 (54) (59) 333 (75) 271 (62) Grade 2 6 (12) (13) 11 (22) (24) 60 (14) 128 (29) Grade 1 7 (14) (15) 8 (16) (17) 52 (12) 37 (8) Sub-total 46 (92) (100) 46 (92) (100) 446 (100) 436 (100) Sterile flowers 4 (8) 4 (8) Total 50 (100) 50 (100) * Numbers in parenthesis are percentages. ** For the definition of the grade, see Fig. 4. *** The chi-square test of the distribution of fruited flowers indicates that the null hypothesis that differences in pollination methods are independent of the distribution over the grades is not rejected at p = 0.05 (χ2 = 2.14, D.F. = 2, p = 0.34). Table 1.
The results of pollination: distributions of sampled flowers by pollination method.*
-
Factor Variation ratio Grade of fruits Pollination method Interaction effect Residual/Total*** Significance provability** Fruit weight (g/fruit)) 8.2E-04 0.646 0.260 0.811 Fruit volume (cm3/fruit) 0.001 0.596 0.316 0.945 Brix (%) 0.081 0.483 0.763 0.934 Number of achenes (no./fruit) 0.491 0.996 0.702 0.971 Percentage of fertilized achenes (%) 1.3E-13 0.027 0.431 0.469 * The degree of freedom is 2 for the grade, 1 for the pollination method, 2 for the interaction effect, 86 for the residual, and 91 for the total variation.
** For p < 0.001, probabilities are expressed in an index form, such as 8.2E-04, which stands for 8.2 × 10⁻⁴. The probability of less than the critical level of p = 0.05 is expressed in bold letters.
*** The variation ratio, residual/total, means the share in the total variation of the variation that is not explained by the factors.Table 2.
The results of ANOVA: the significance probability of fruit grade, pollination method, and their interaction effect, and the ratio of the residual variation to the total variation, for the five fruit characteristics.*
-
Hand Robot 1/2 Mean 1 CV (%) Mean 2 CV (%) Fruit weight (g/fruit) Grade 3 10.1a 38.9 10.0a 31.7 1.01 Grade 2 10.0ab 37.0 11.6a 42.5 0.86 Grade 1 7.50ab 61.9 4.60b 62.8 1.63 Fruit volume (cm3/fruit) Grade 3 6.84a 46.8 6.58a 33.9 1.04 Grade 2 6.84ab 39.9 7.98a 48.9 0.86 Grade 1 4.84ac 64.2 2.77bc 68.6 1.75 Brix (%) Grade 3 9.36a 12.7 9.35a 13.2 1.00 Grade 2 9.38a 10.6 9.55a 8.7 0.98 Grade 1 9.87a 8.9 10.3a 11.5 0.95 Number of achenes (no./fruit) Grade 3 144a 32.3 133a 25.3 1.08 Grade 2 131a 38.8 140a 40.2 0.94 Grade 1 122a 55.9 125a 28.3 0.98 Percentage of fertilized achenes (%) Grade 3 81.5a 17.6 78.2a 19.6 1.04 Grade 2 60.3ab 45.7 47.0bc 36.1 1.28 Grade 1 43.9bc 55.4 30.5c 67.9 1.44 * Of the six means for each characteristic, the means followed by the same alphabet letter are not statistically different at p < 0.05 (tested by the Tukey method). Table 3.
The means and coefficient of variations (CV) of the weight, volume, and brix of strawberry fruits, the total number of achenes per fruit, and percentage share of fertilized achenes in the total achenes, by pollination method and grade.*
Figures
(5)
Tables
(3)