-
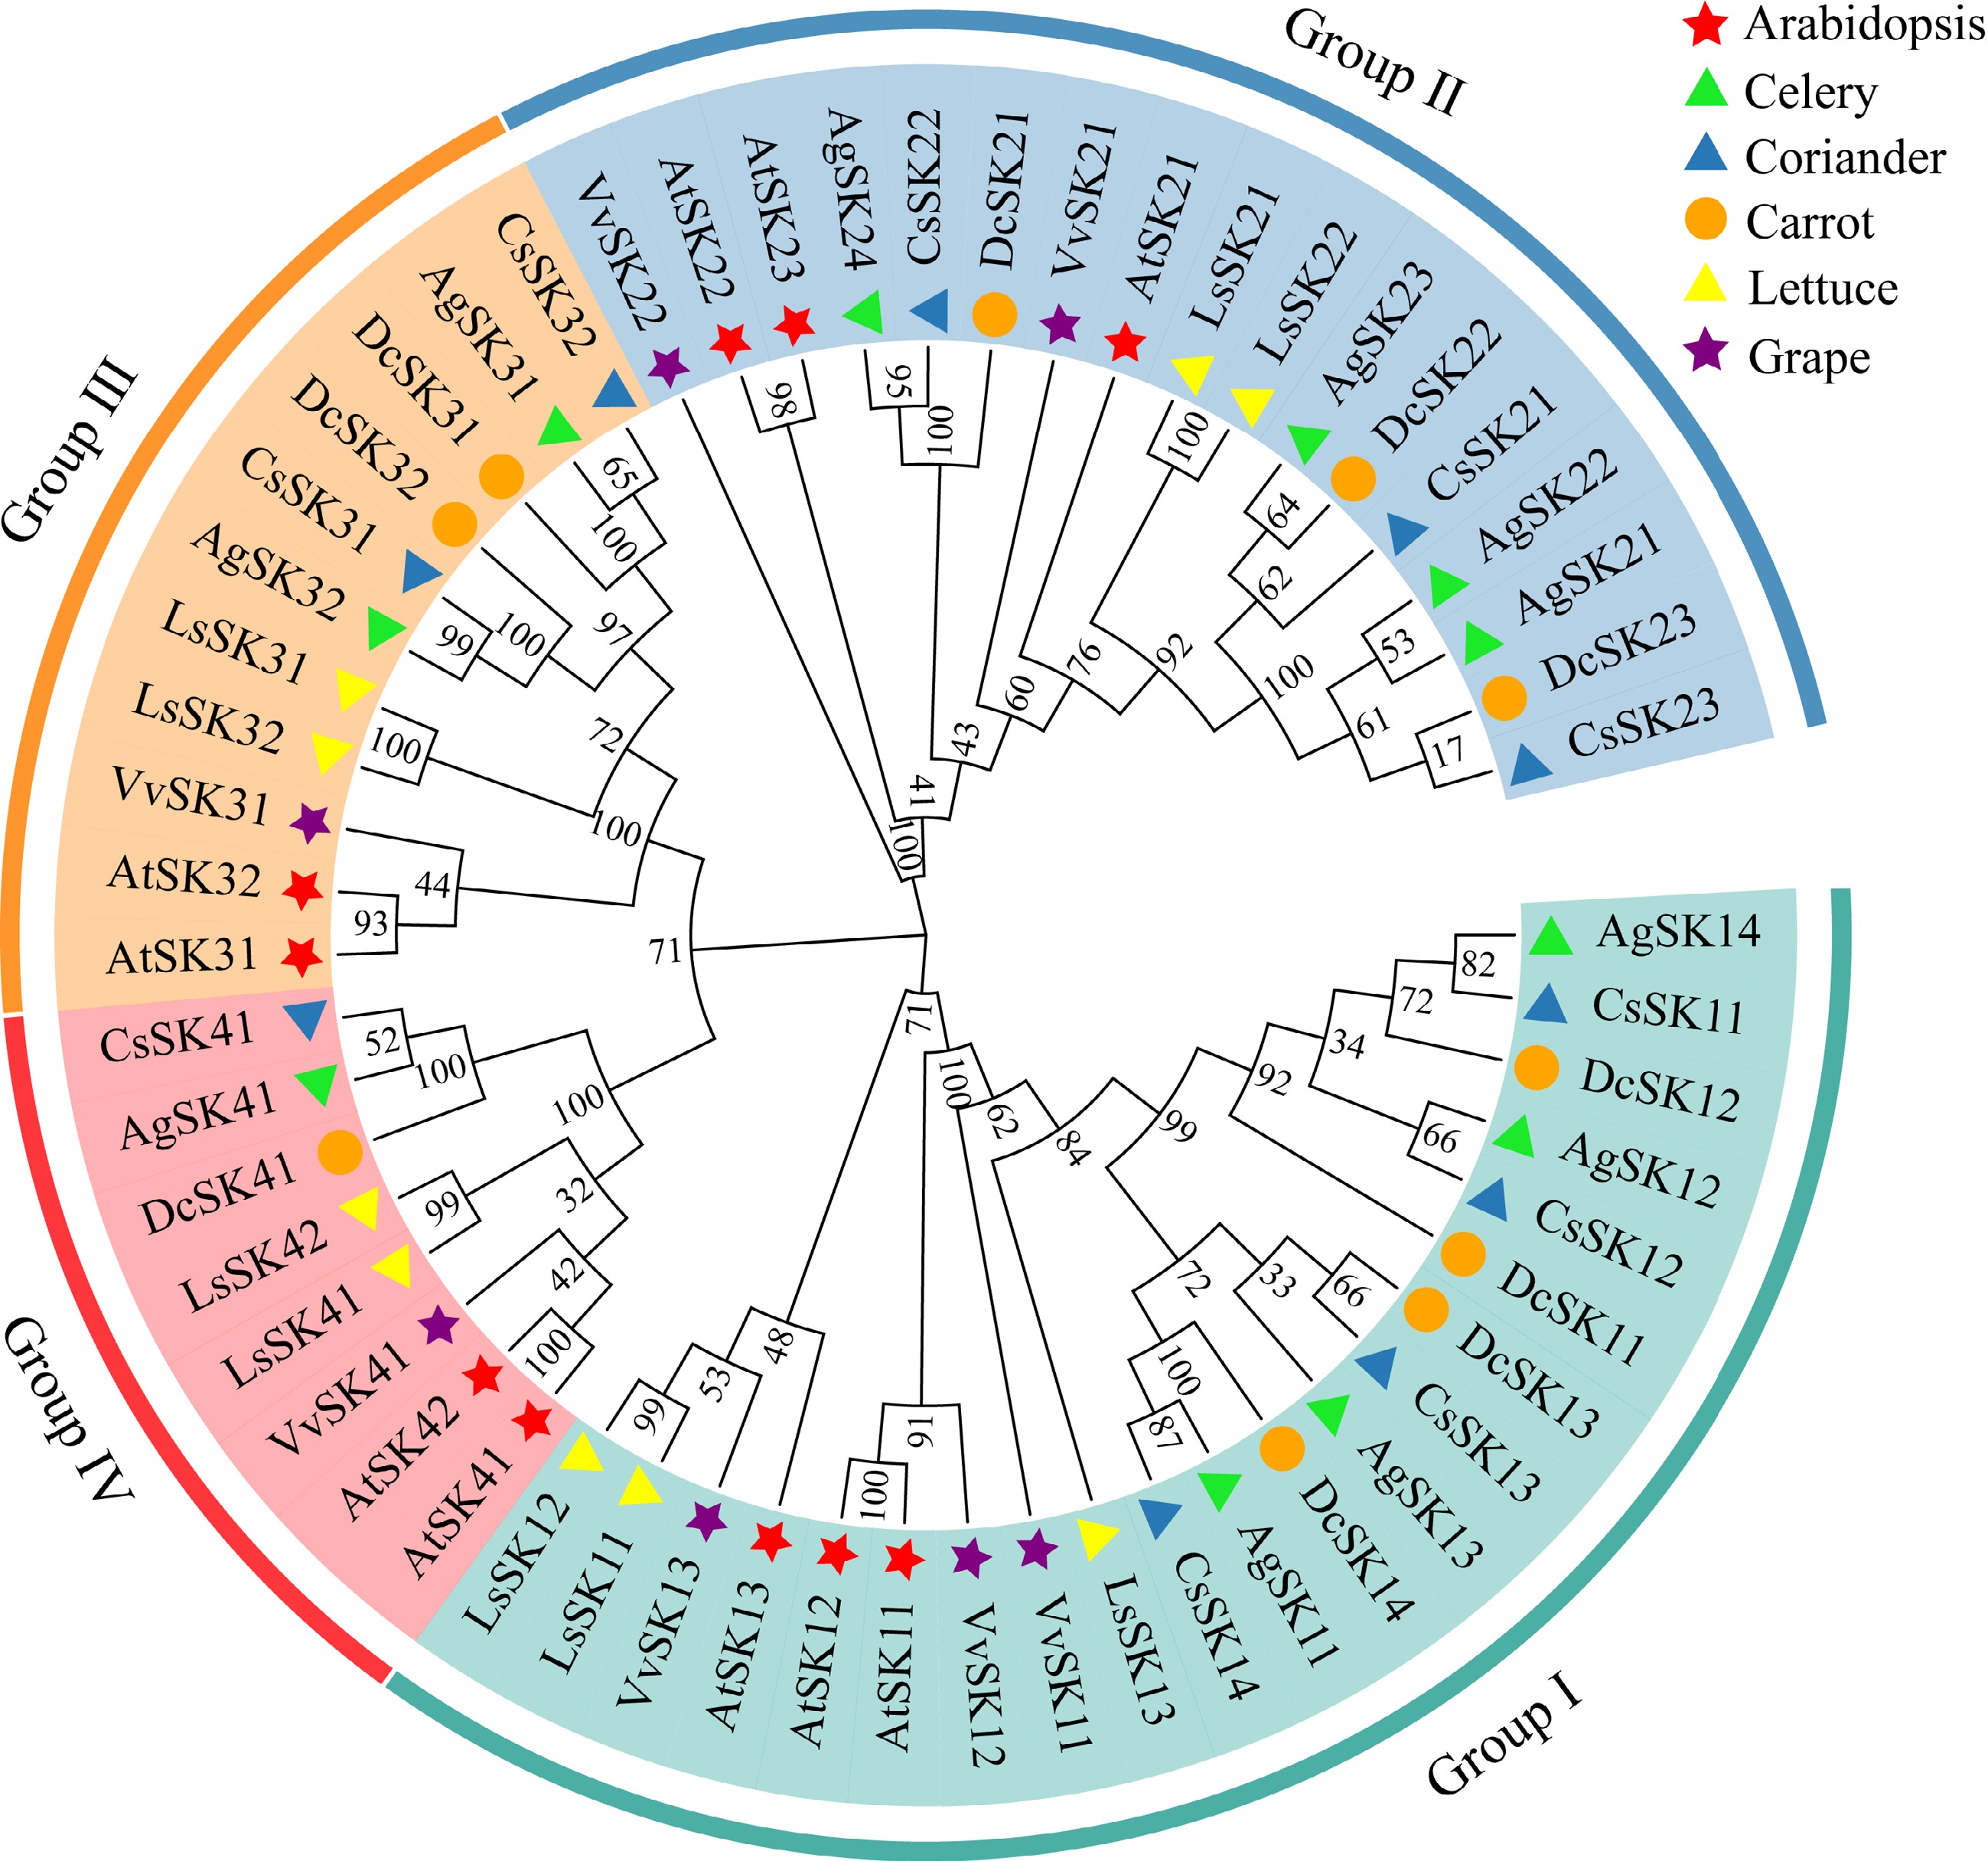
Figure 1.
Phylogenetic analysis of the GSK3 proteins in Arabidopsis (Arabidopsis thaliana, At), celery (Apium graveolens, Ag), coriander (Coriandrum sativum, Cs), carrot (Daucus carota, Dc), lettuce (Lactuca sativa, Ls) and grape (Vitis vinifera, Vv). Clades with colored branches referred to four subgroups I−IV.
-
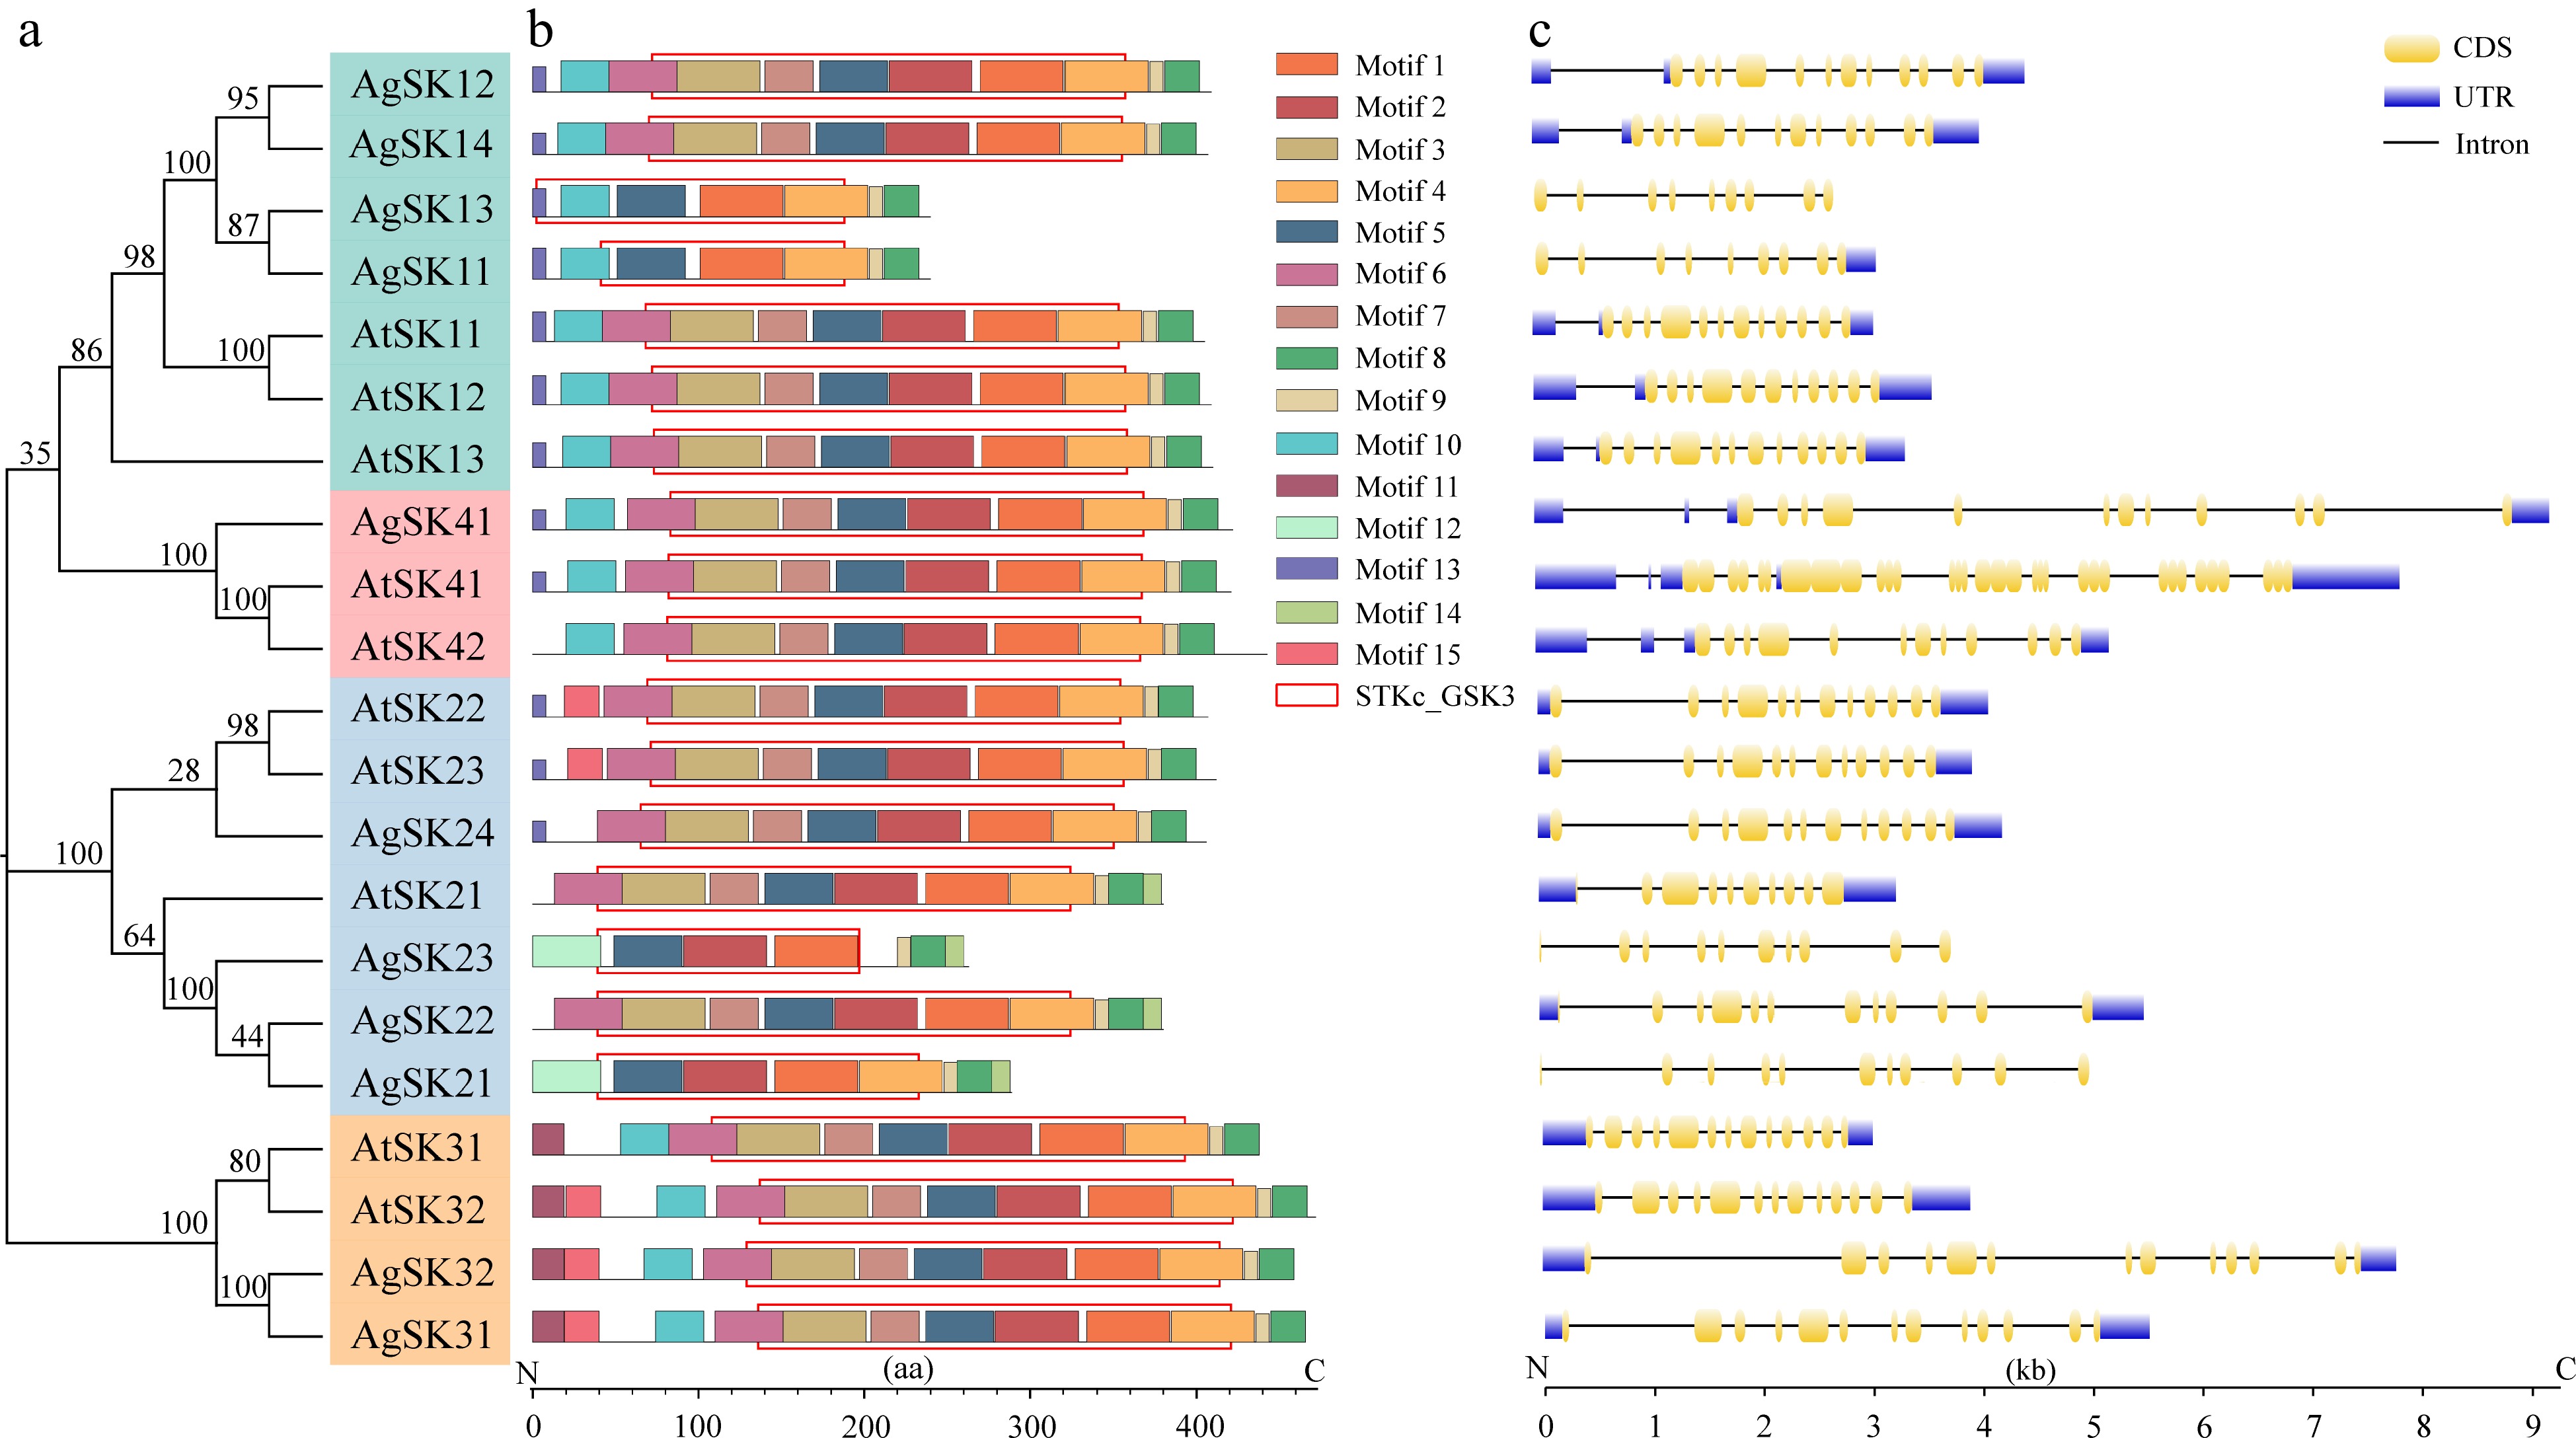
Figure 2.
Conserved motifs and gene structure analyses of the GSK3s in celery and Arabidopsis. (a) Phylogenetic tree of the GSK3 proteins. (b) Conserved motifs and domains of the GSK3 proteins. Different color boxes indicated different kinds of motifs. The position of the conserved domain was framed by rectangular boxes. (c) Structure prediction of the GSK3 genes. The coding sequence (CDS) and untranslated region (UTR) were displayed in yellow and blue boxes, respectively. The lines between boxes represent introns.
-
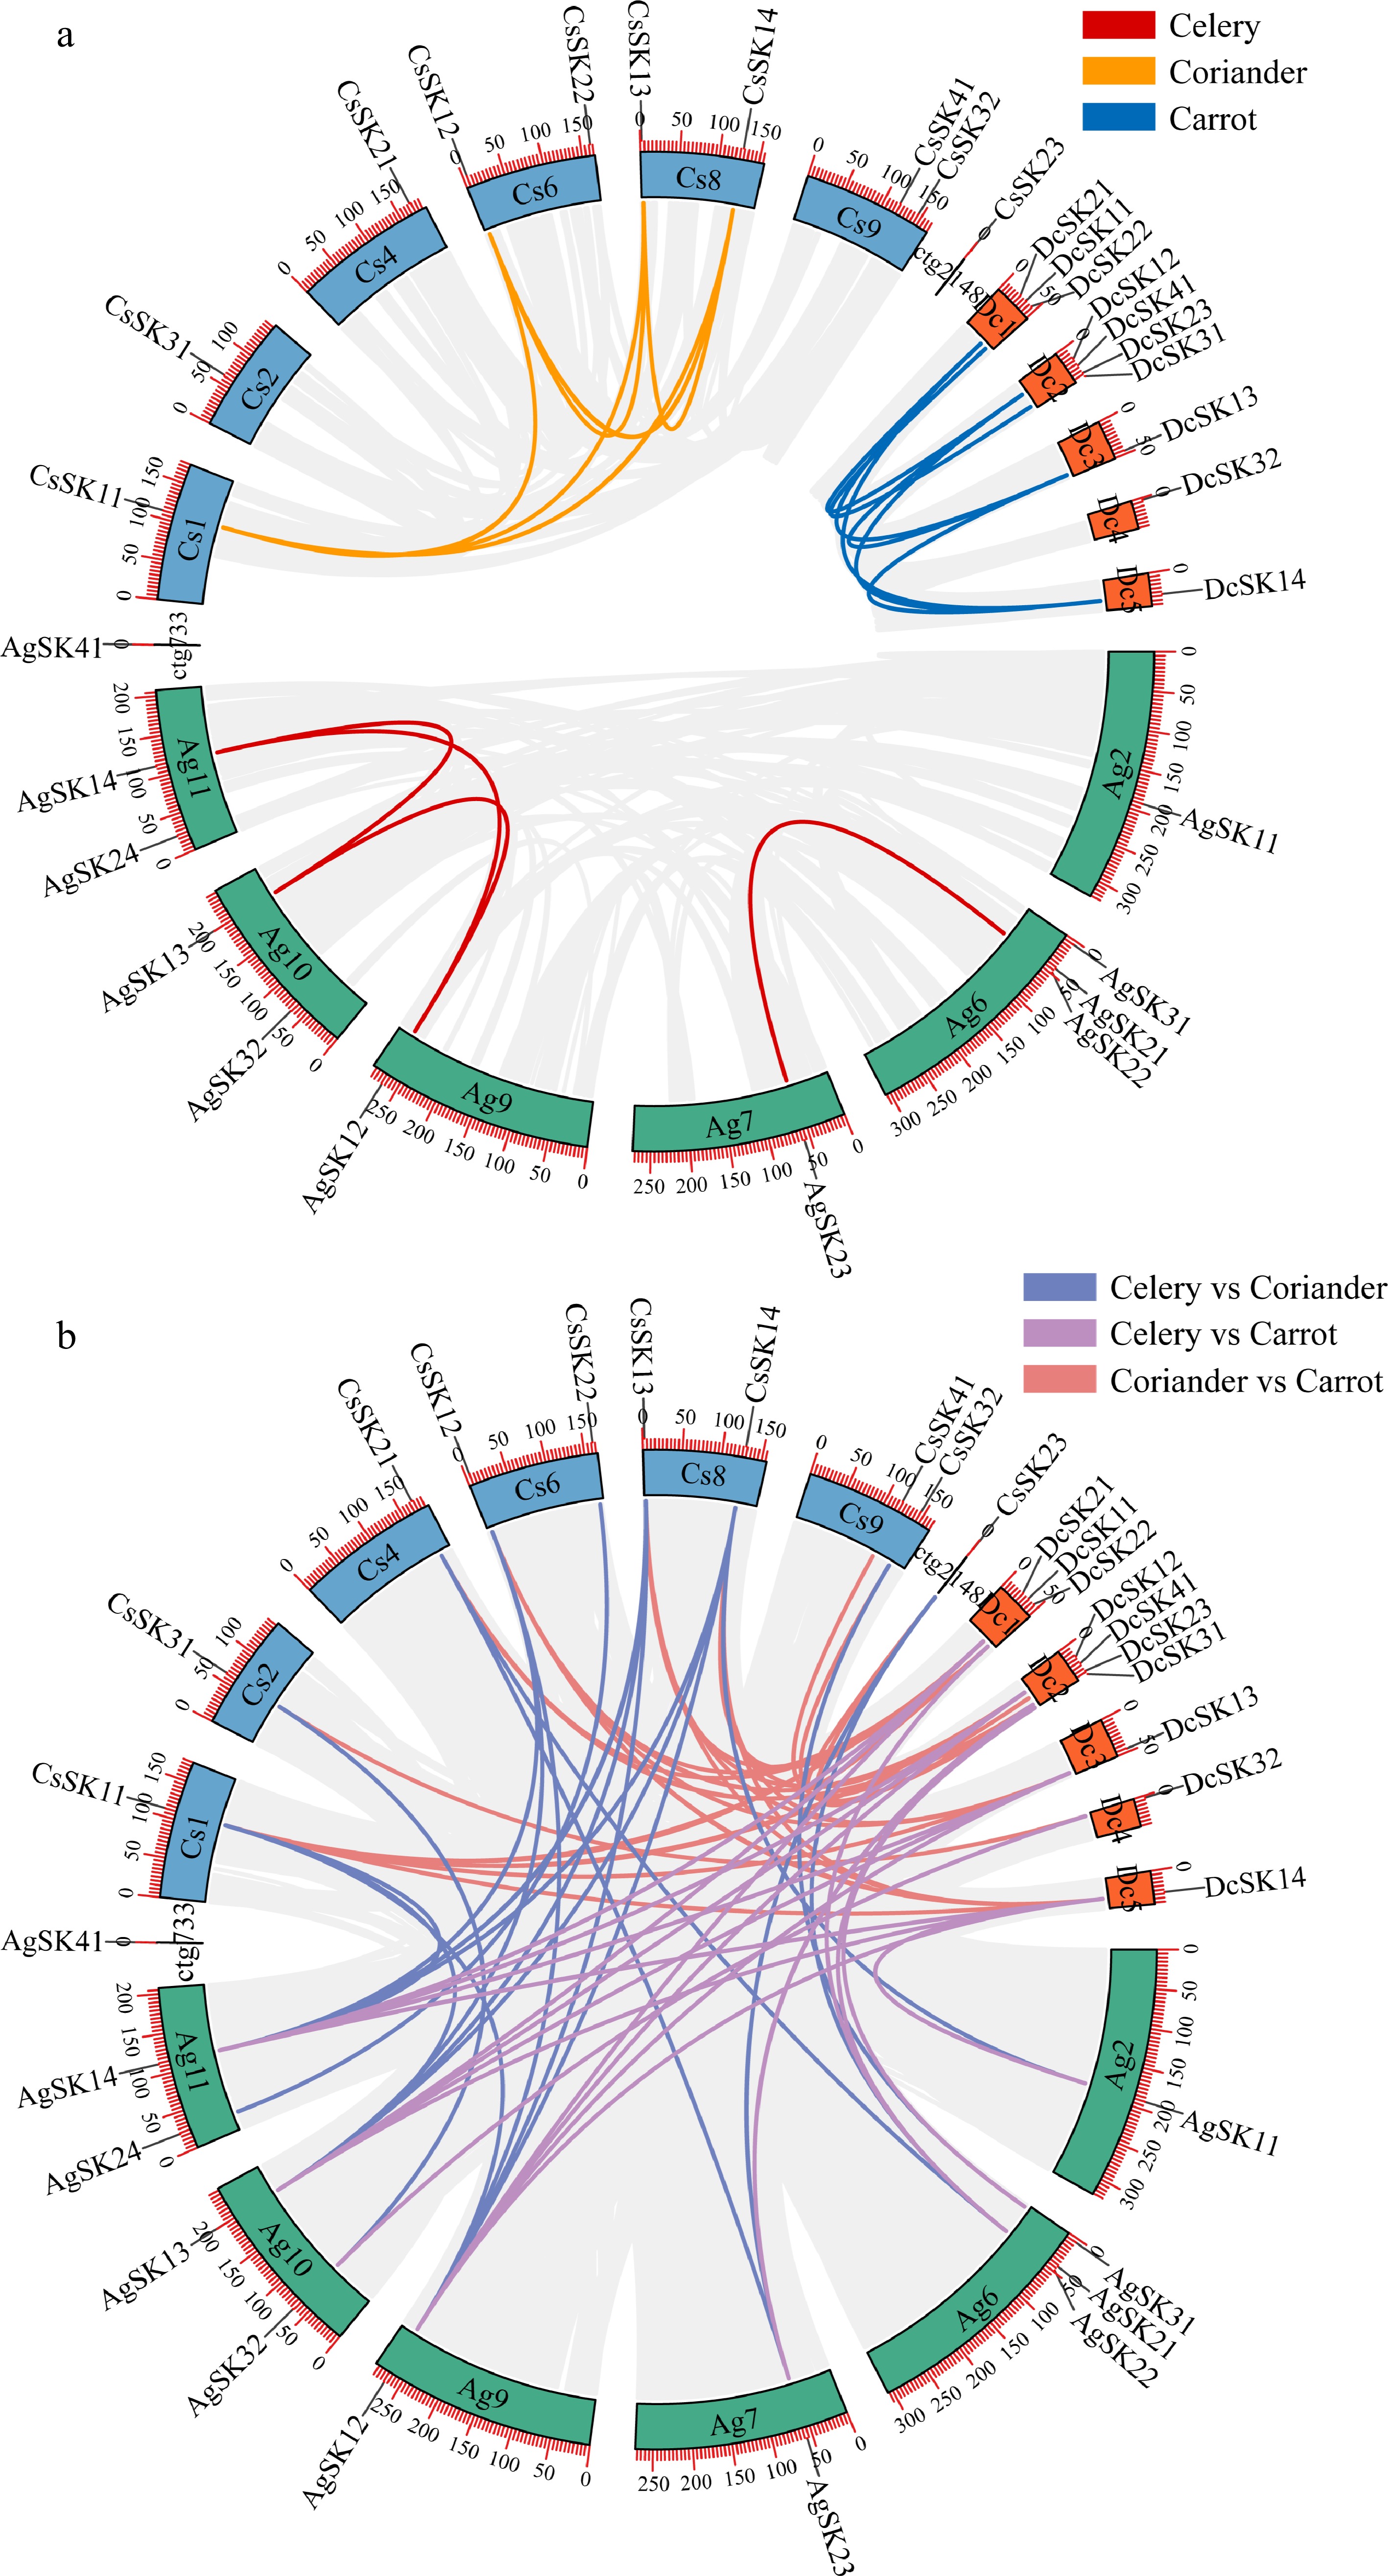
Figure 3.
Analysis of the GSK3 paralogs and orthologs. (a) Circos plot of the GSK3 paralogs within each Apiaceae species. (b) Circos plot of the GSK3 orthologs among the three Apiaceae species. The number on the scale represents the physical location in each chromosome. Duplicated GSK3 gene pairs are linked by lines with the corresponding colors. Chromosomal distributions are indicated in the outer layer.
-
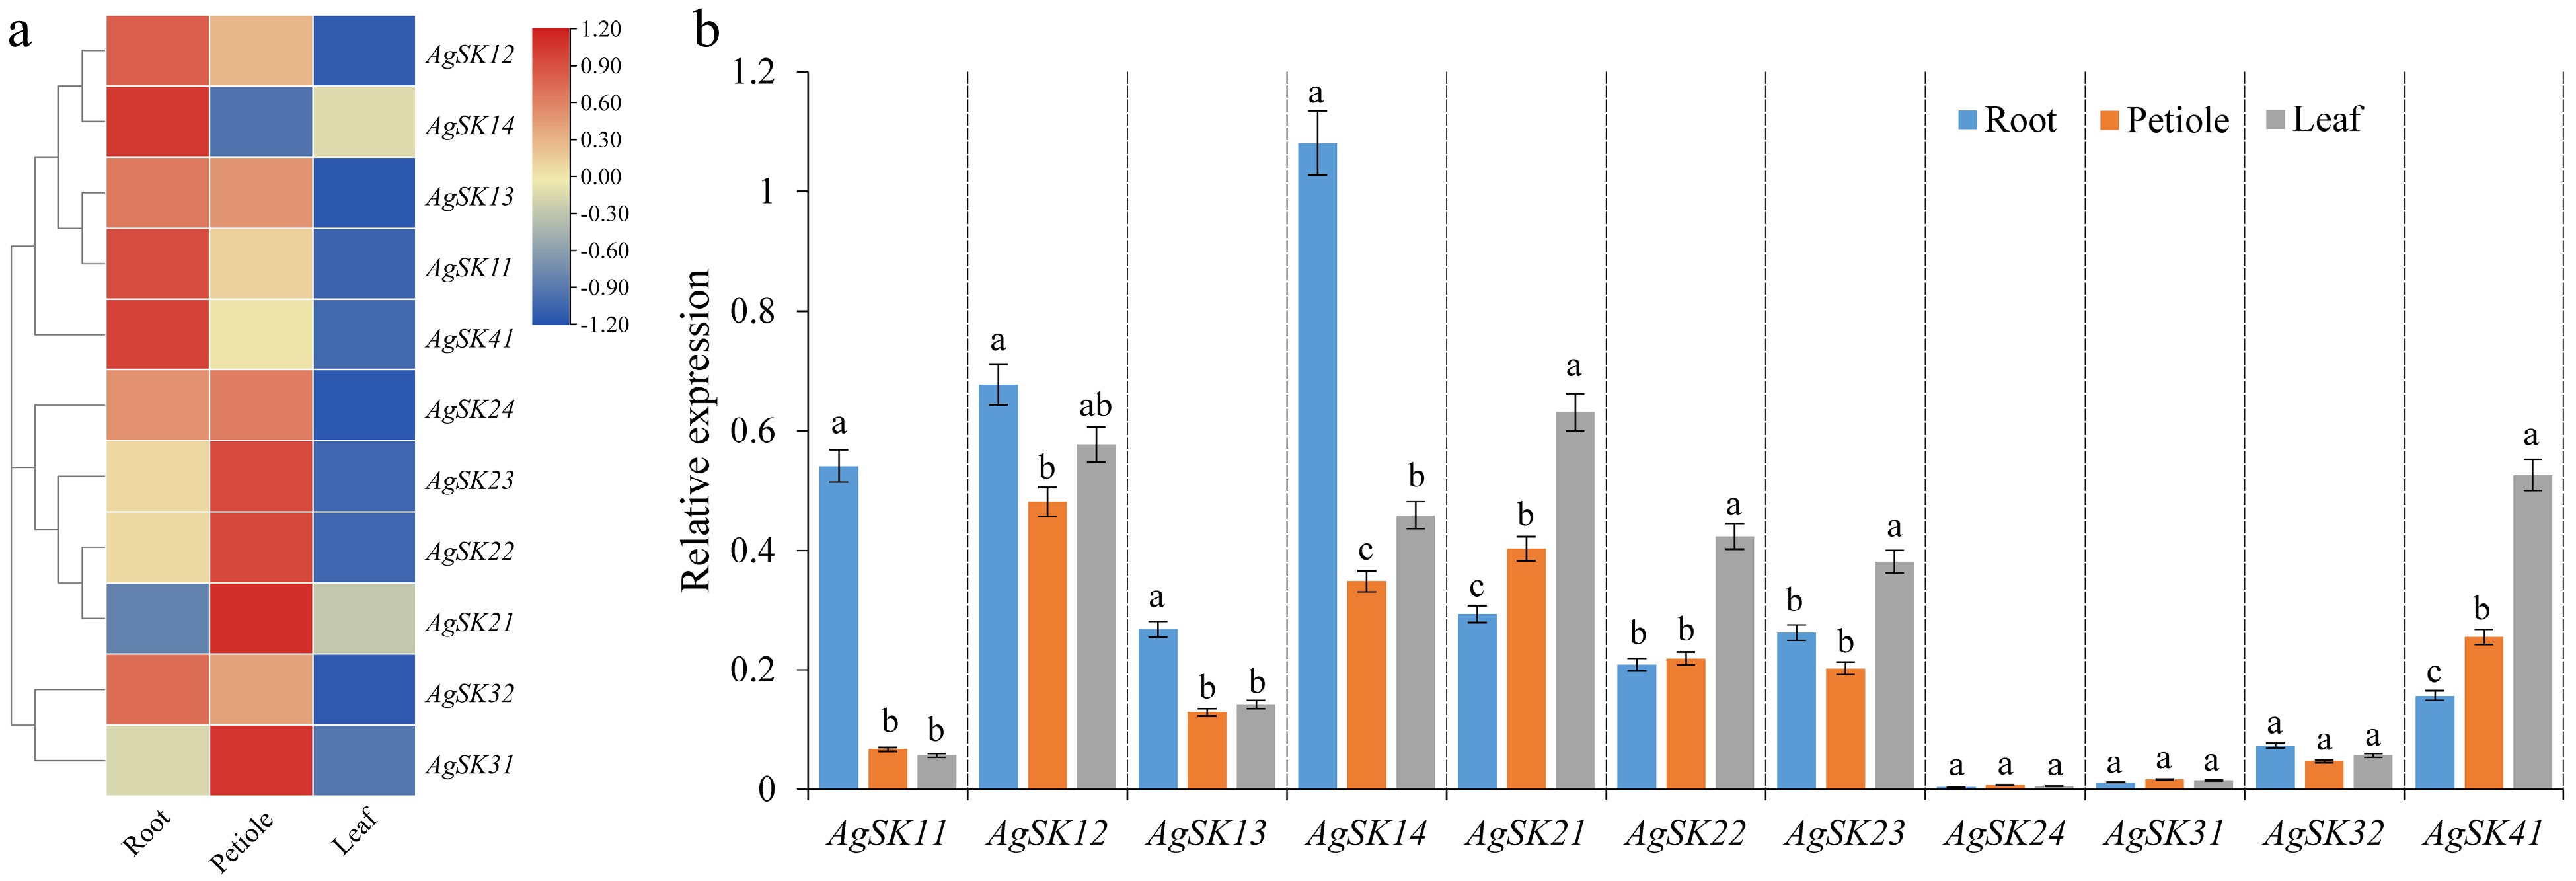
Figure 4.
Tissues-specific expression patterns of the AgSK genes (root, petiole and leaf). (a) Hierarchical clustering of gene expression profiles of all the AgSK genes. The log2-transformed FPKM values were utilized to generate the heatmap. (b) Validation by qRT-PCR of tissues-specific expression patterns of the AgSK genes.
-
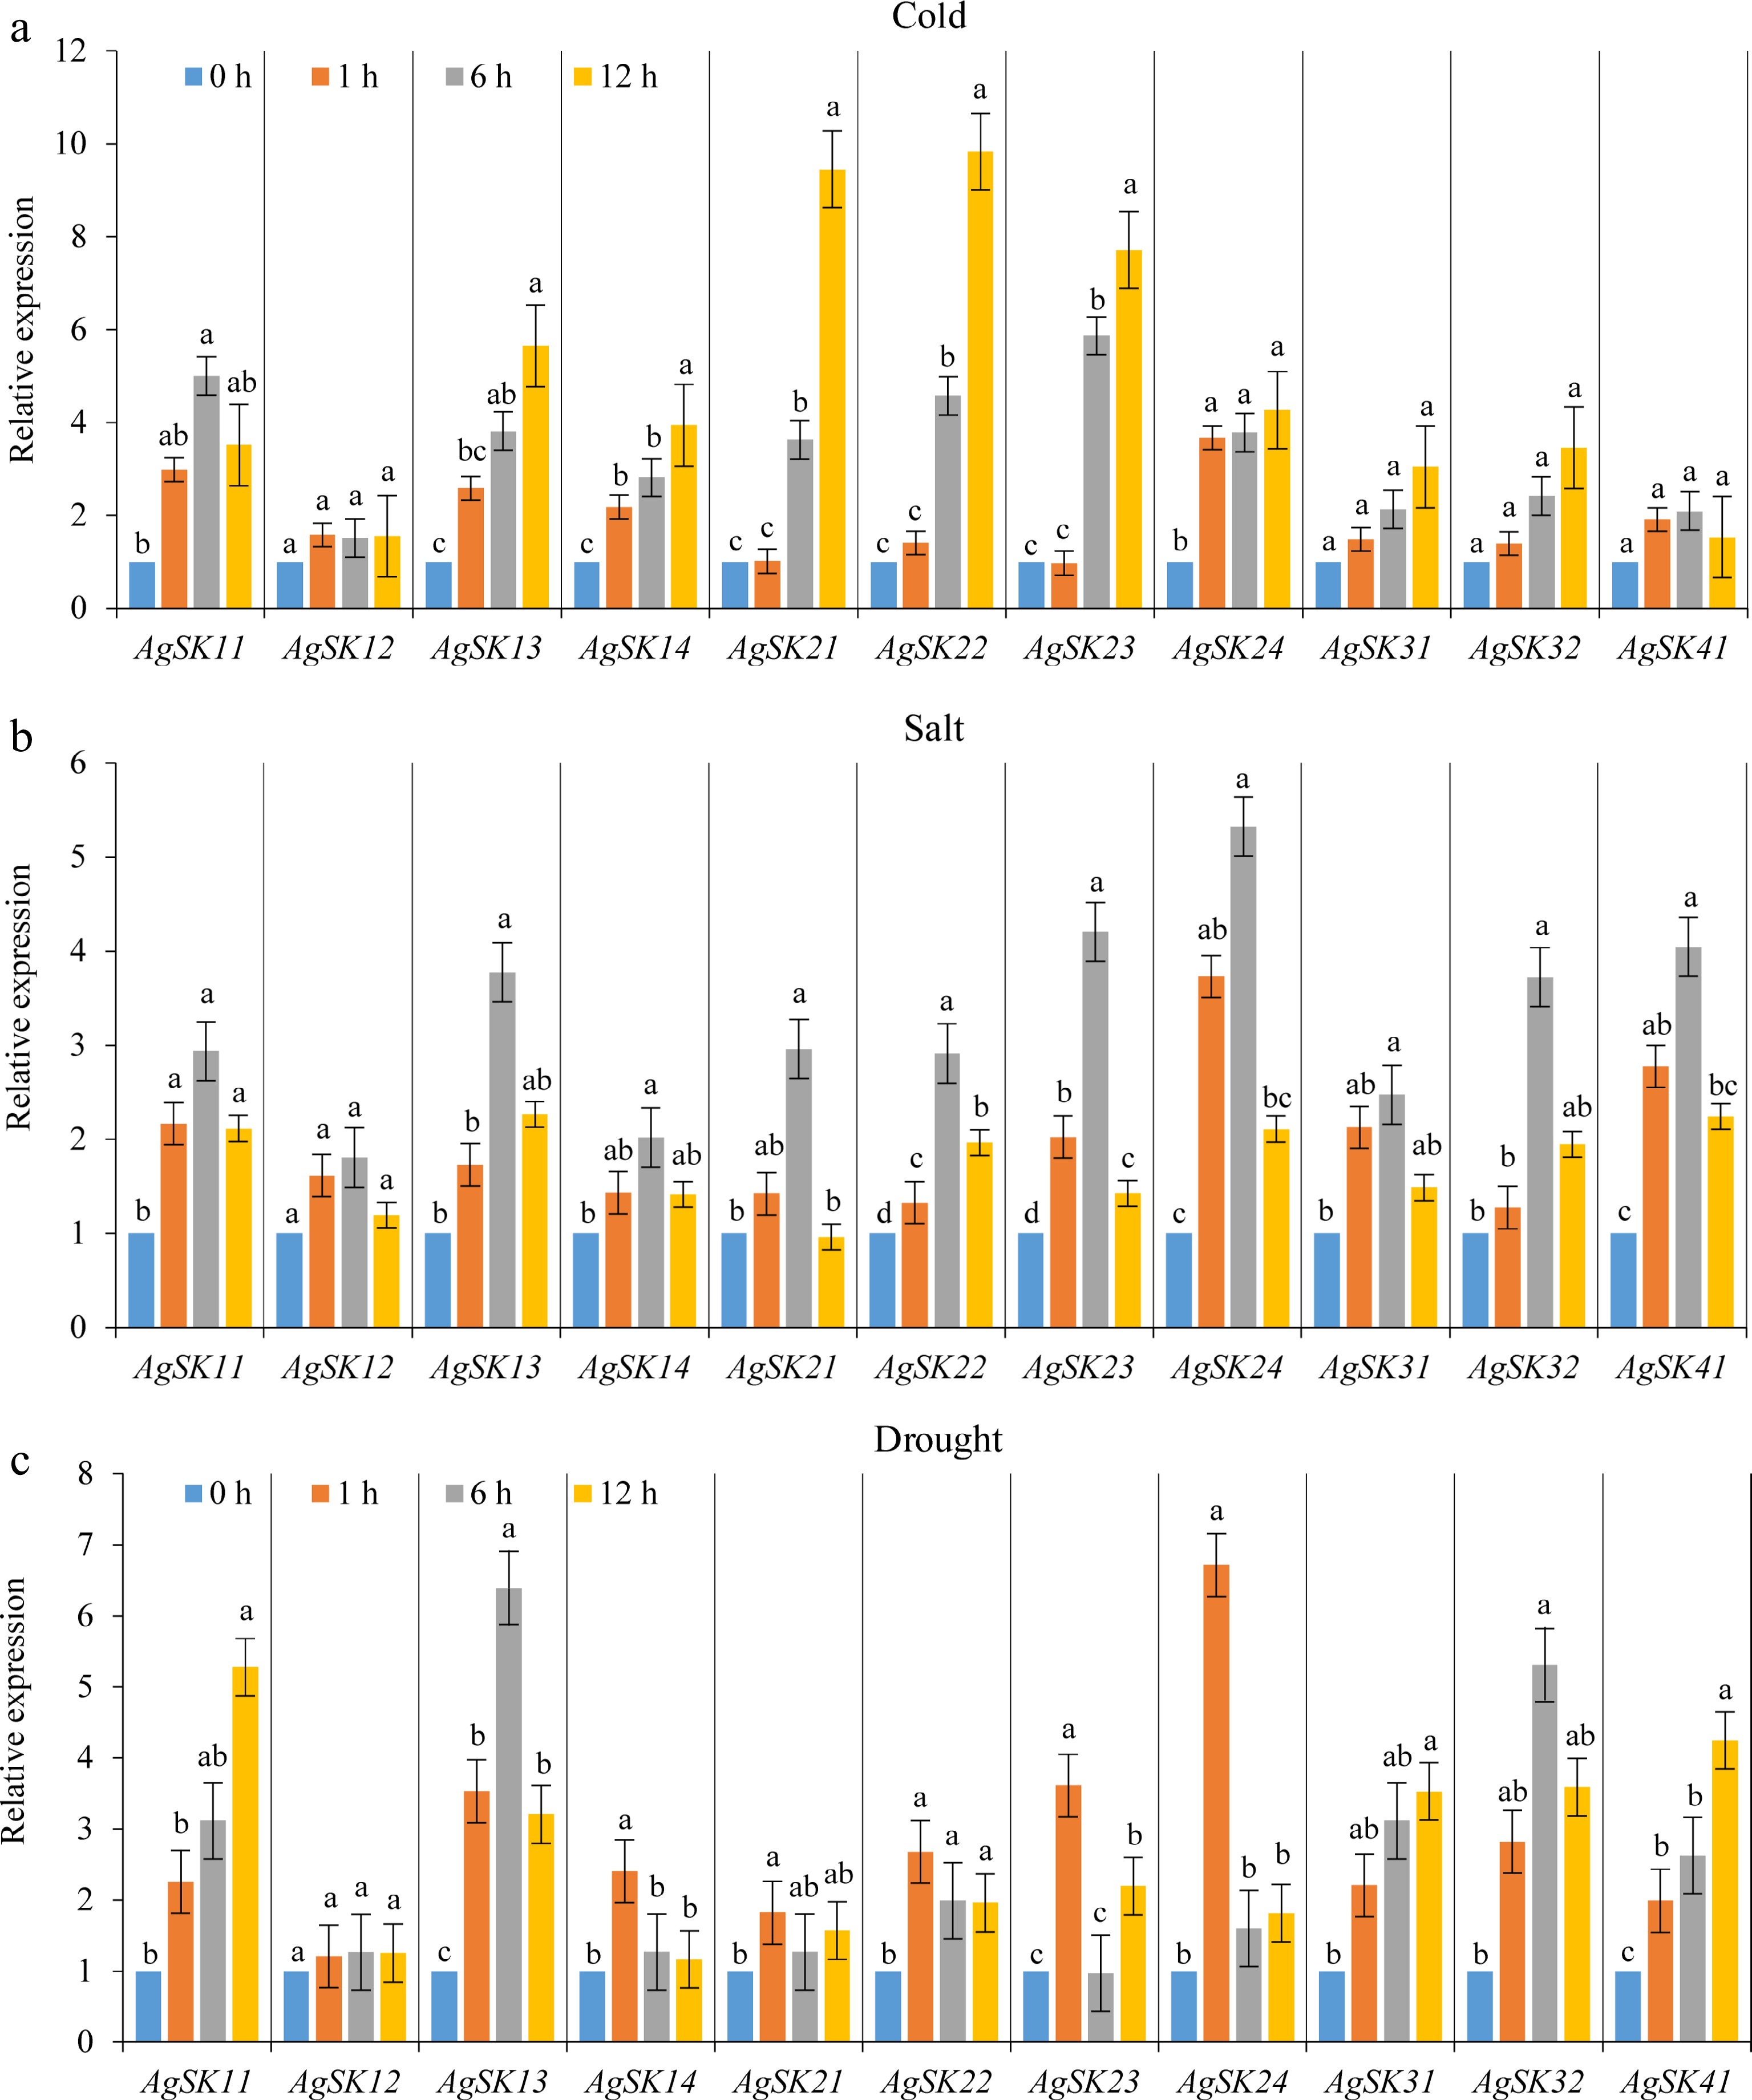
Figure 5.
The responses of the AgSKs to (a) cold, (b) salt, and (c) drought stresses were analyzed by qRT-PCR. Different lowercase letters among different timepoints for each gene in each stress indicate significant difference on the relative expression following Duncan’s test (p < 0.05), while the same letters represent no significant difference.
-
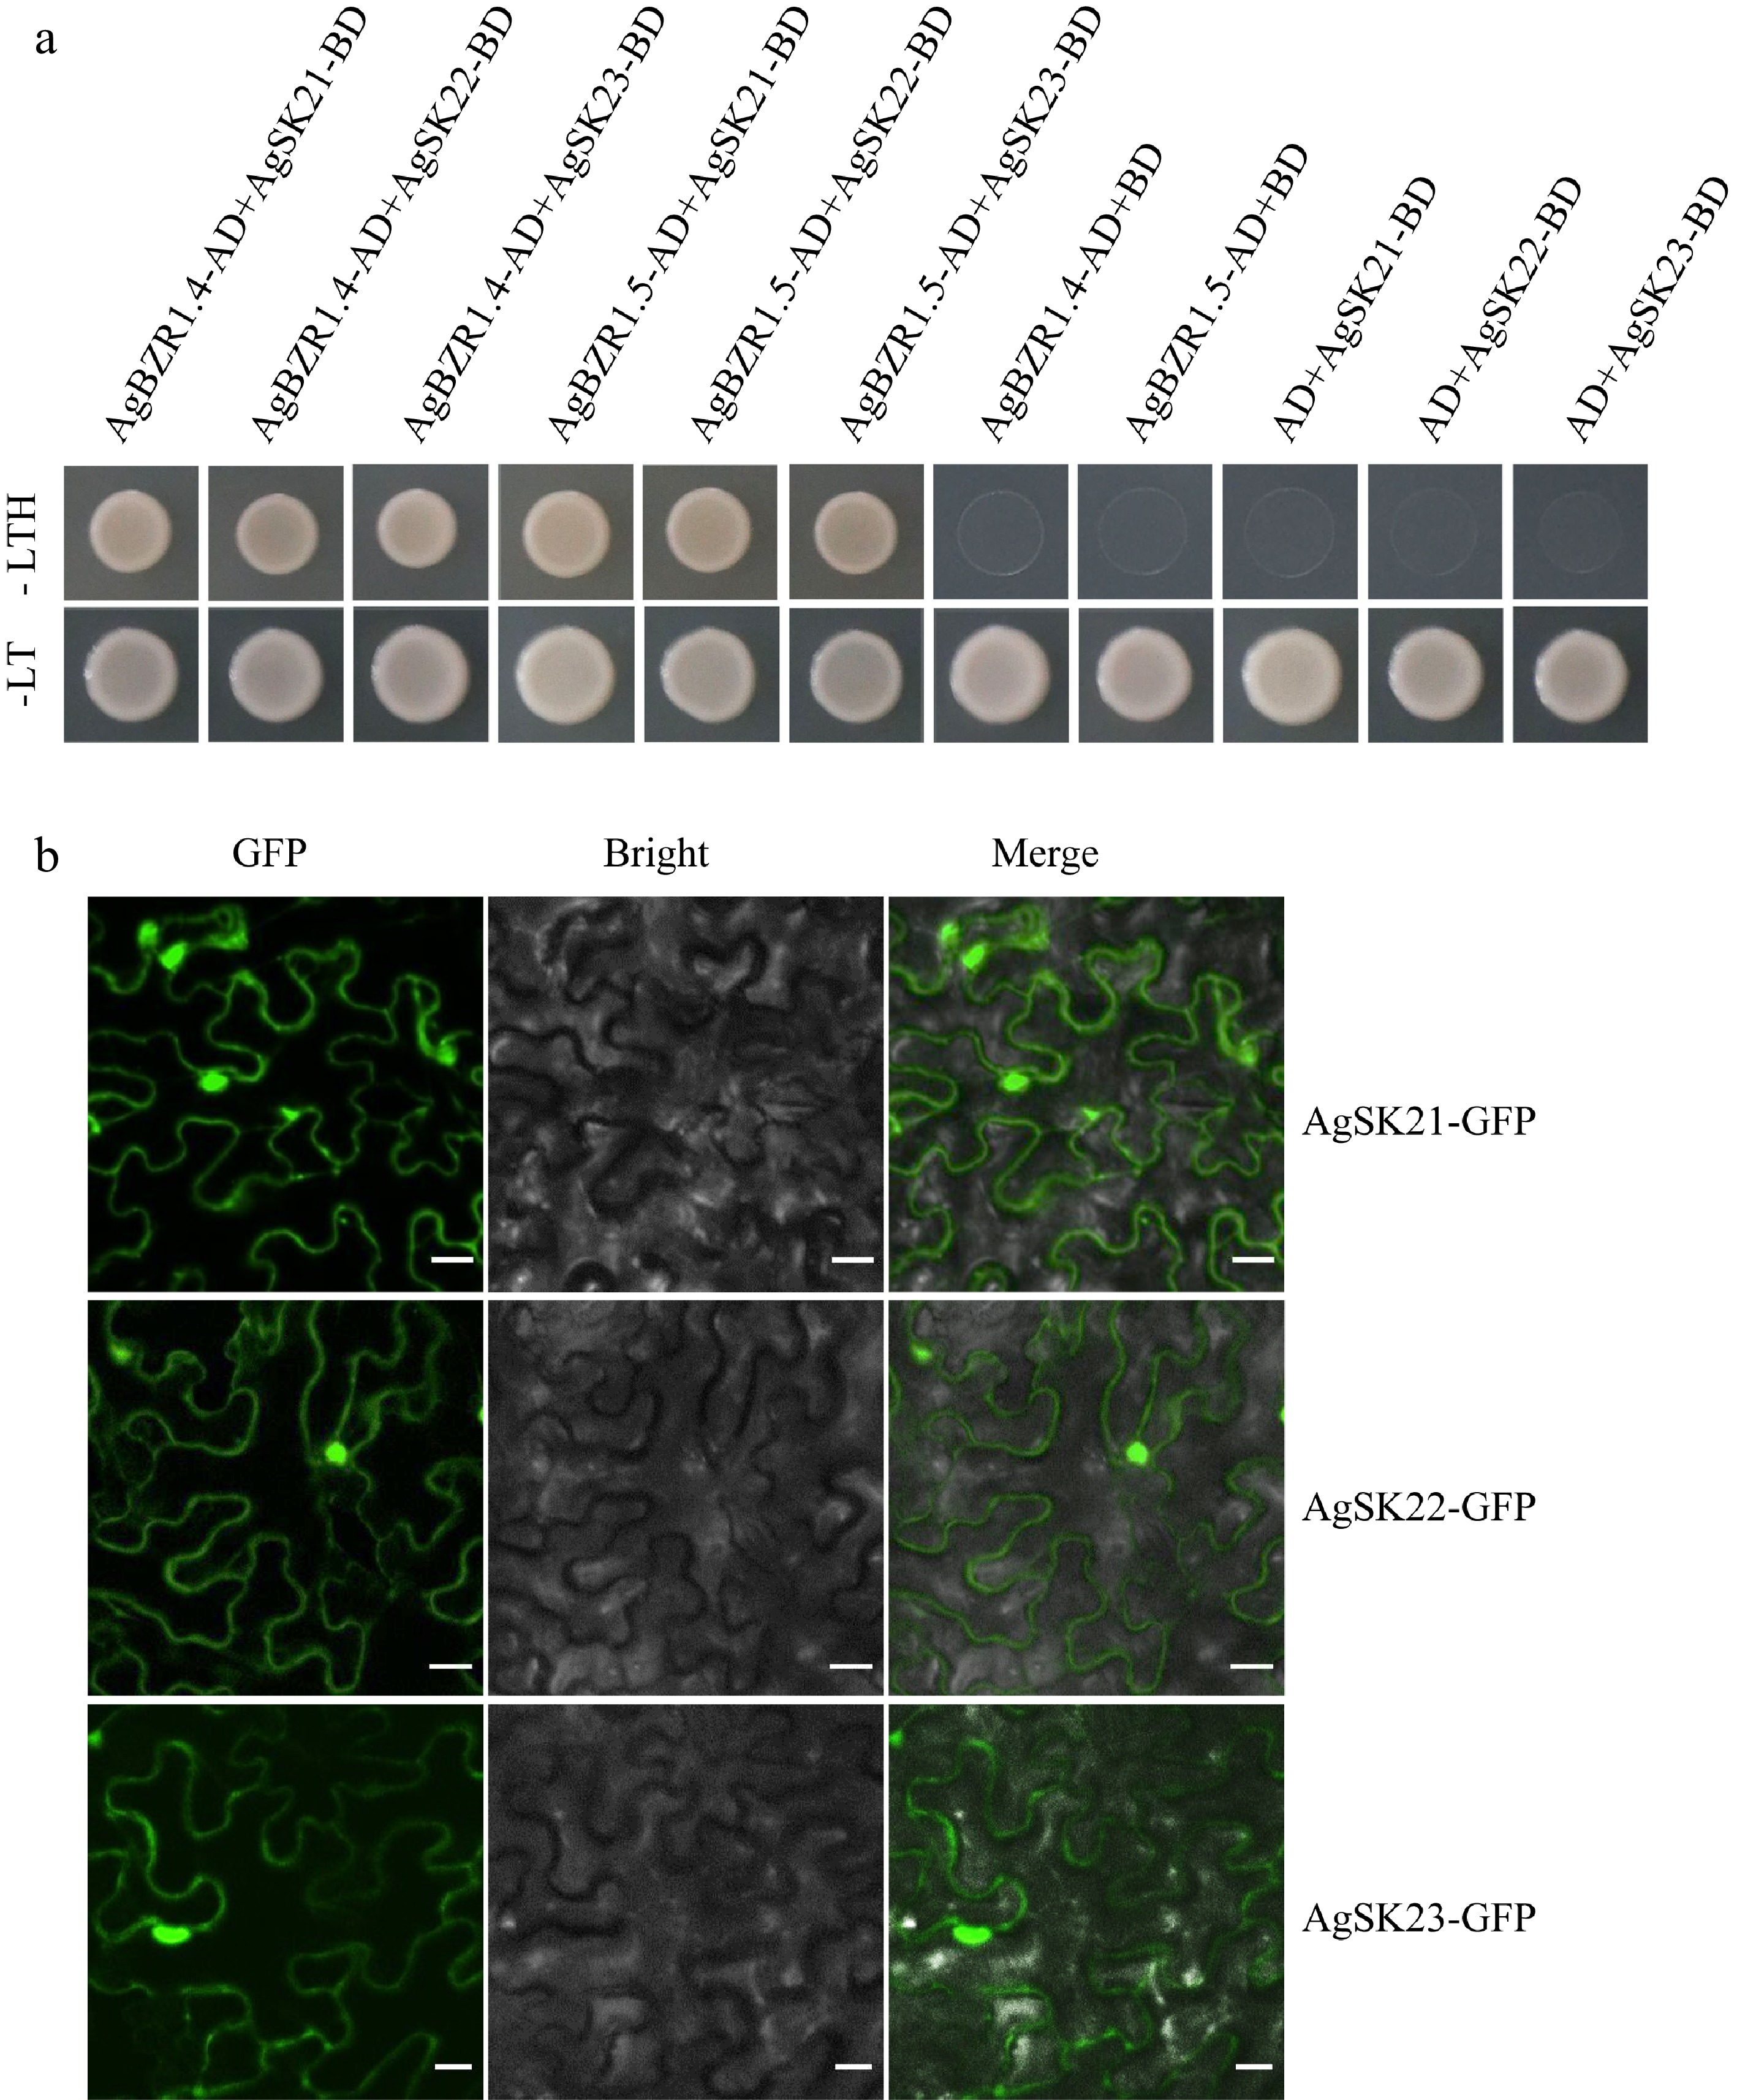
Figure 6.
AgSKs directly interact with AgBZR1. (a) Yeast-two-hybrid assay showed AgSK interacted with AgBZR1 in yeast. The pGBKT7-AgSK and pGADT7-AgBZR1 fusion vectors were co-transformed into AH109 yeast cells. The transformants were screened on SD/-Leu-Trp-His (-LTH) medium. (b) Subcellular localization analysis of AgSK proteins. Tobacco (Nicotiana benthamiana) leaves transiently expressed AgSK-GFP fusion proteins were observed through the laser scanning confocal microscope. Scale bars represent 100 μm.
-
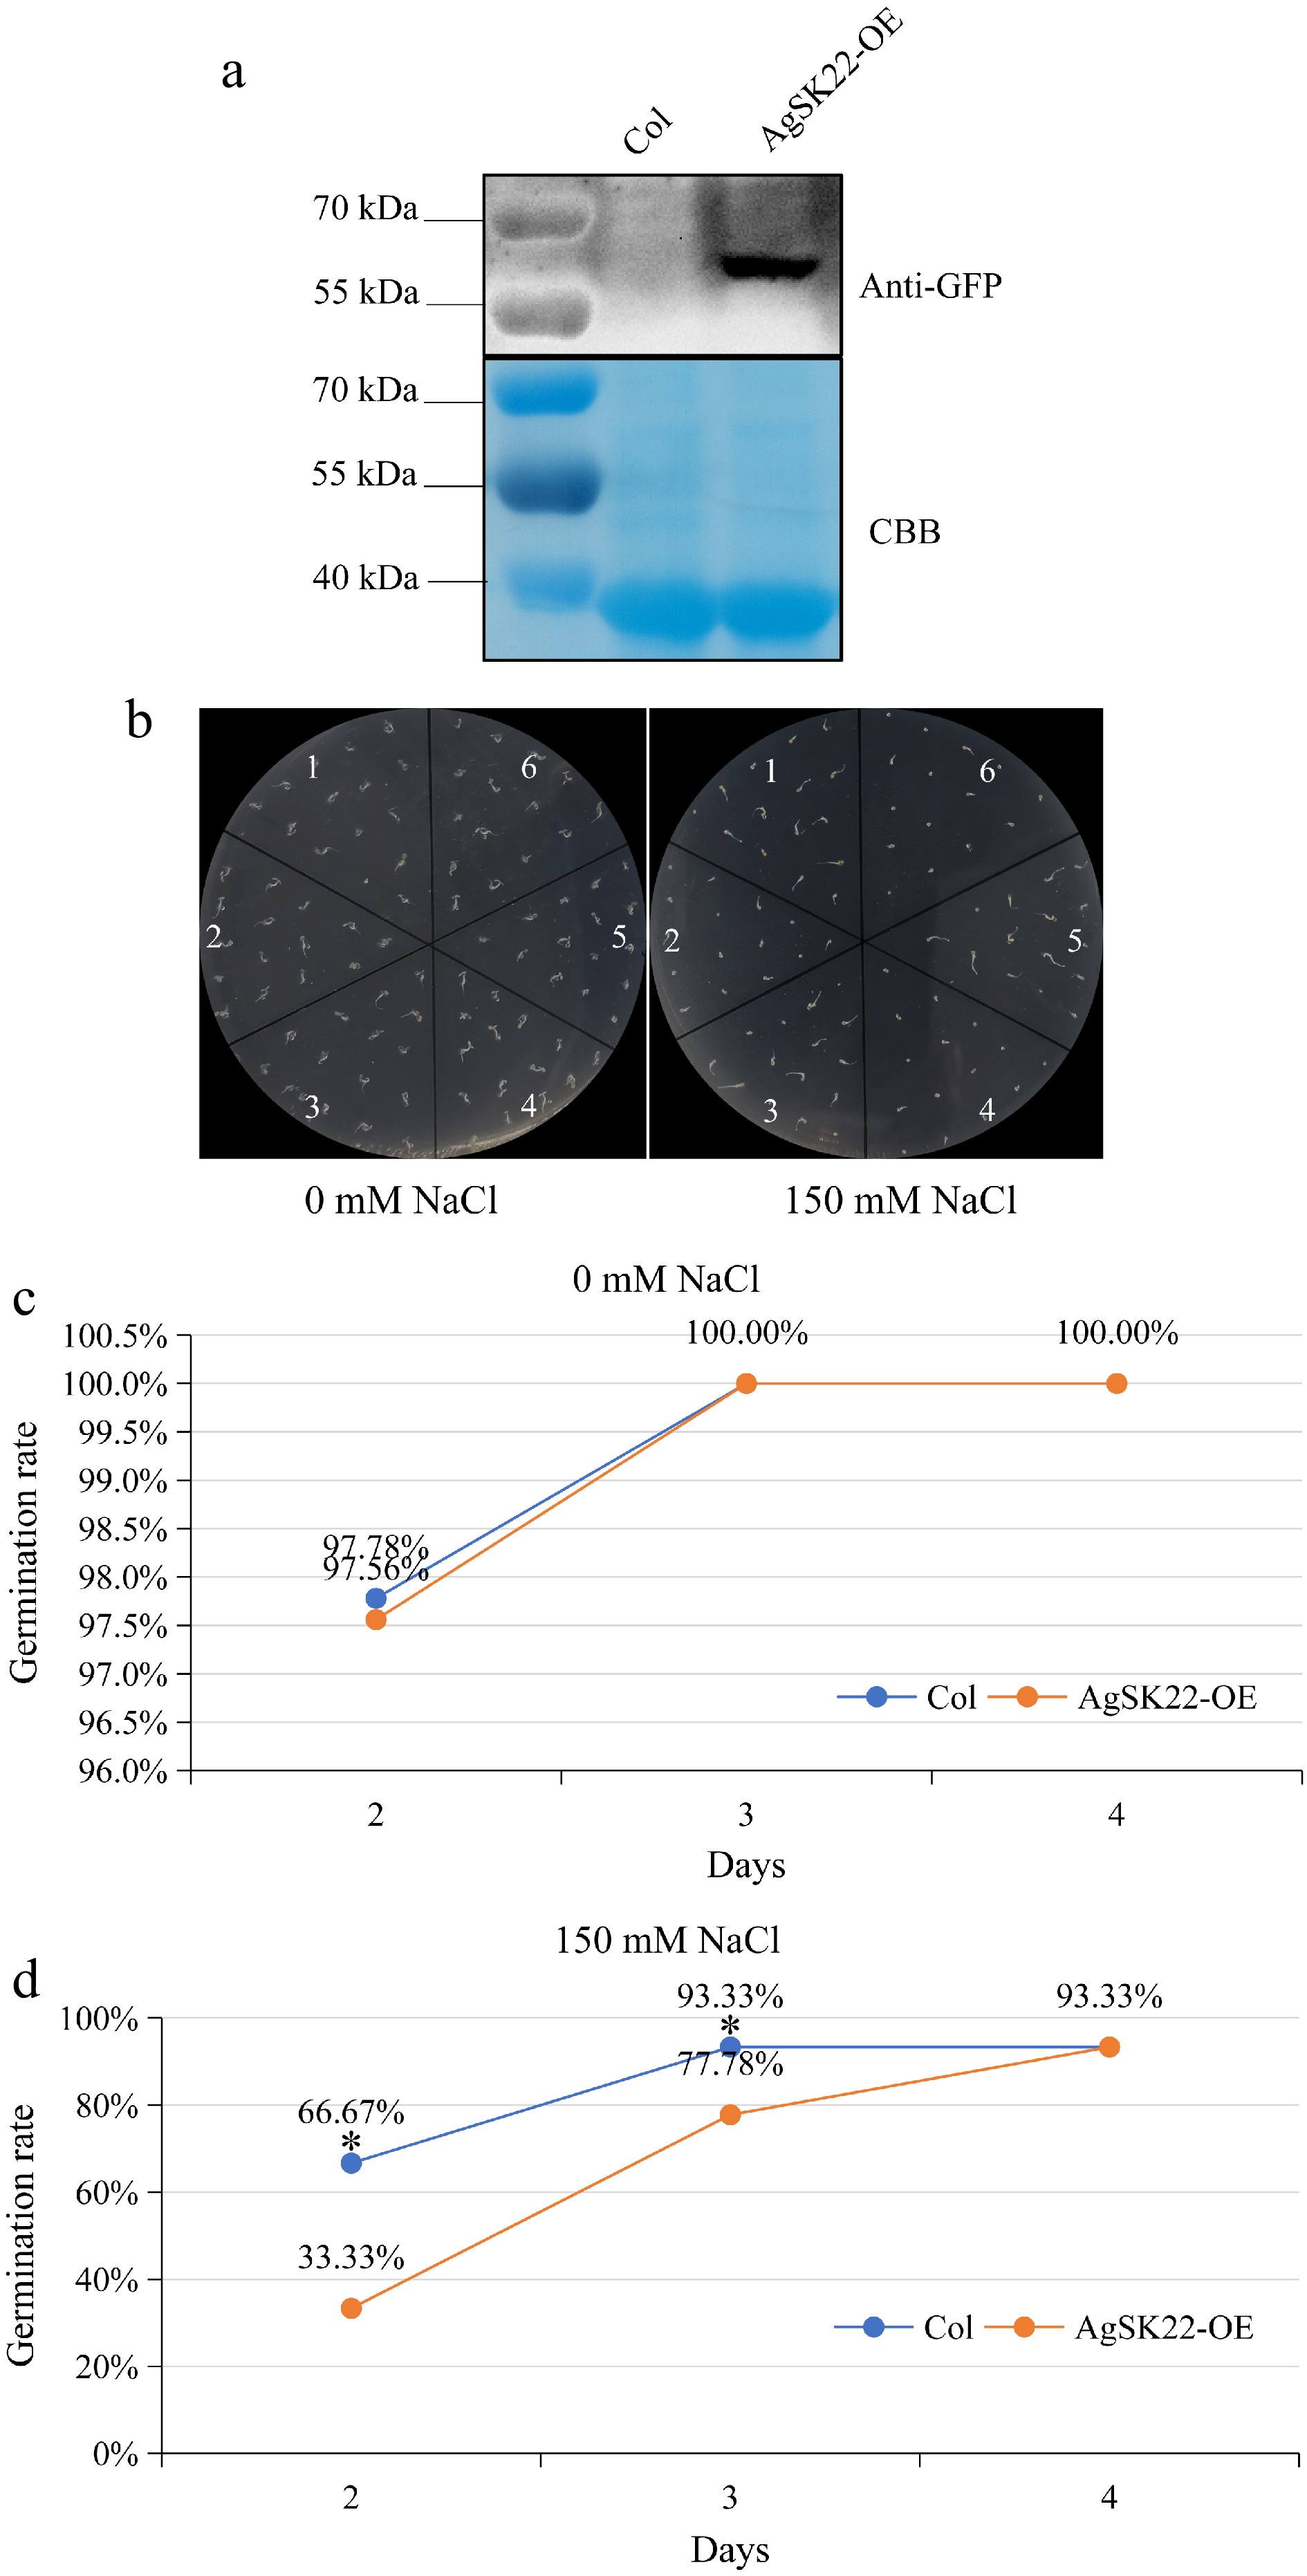
Figure 7.
Responses of AgSK22 overexpression transgenic Arabidopsis plants to NaCl. (a) AgSK22 protein was detected using an anti-GFP antibody. (b) AgSK22 overexpression transgenic lines showed more sensitive phenotypes when germinated on 1/2 MS media with 0 or 150 mM NaCl for 3 days. 1, 3, 5: Col; 2, 4, 6: AgSK22-OE. (c) & (d) Germination rate of Col-0 and AgSK22-OE overexpression transgenic lines at 2-, 3-, and 4-d on 1/2 MS media containing 0 or 150 mM NaCl. * denotes p < 0.05, as determined by a Student’s t-test.
Figures
(7)
Tables
(0)