-
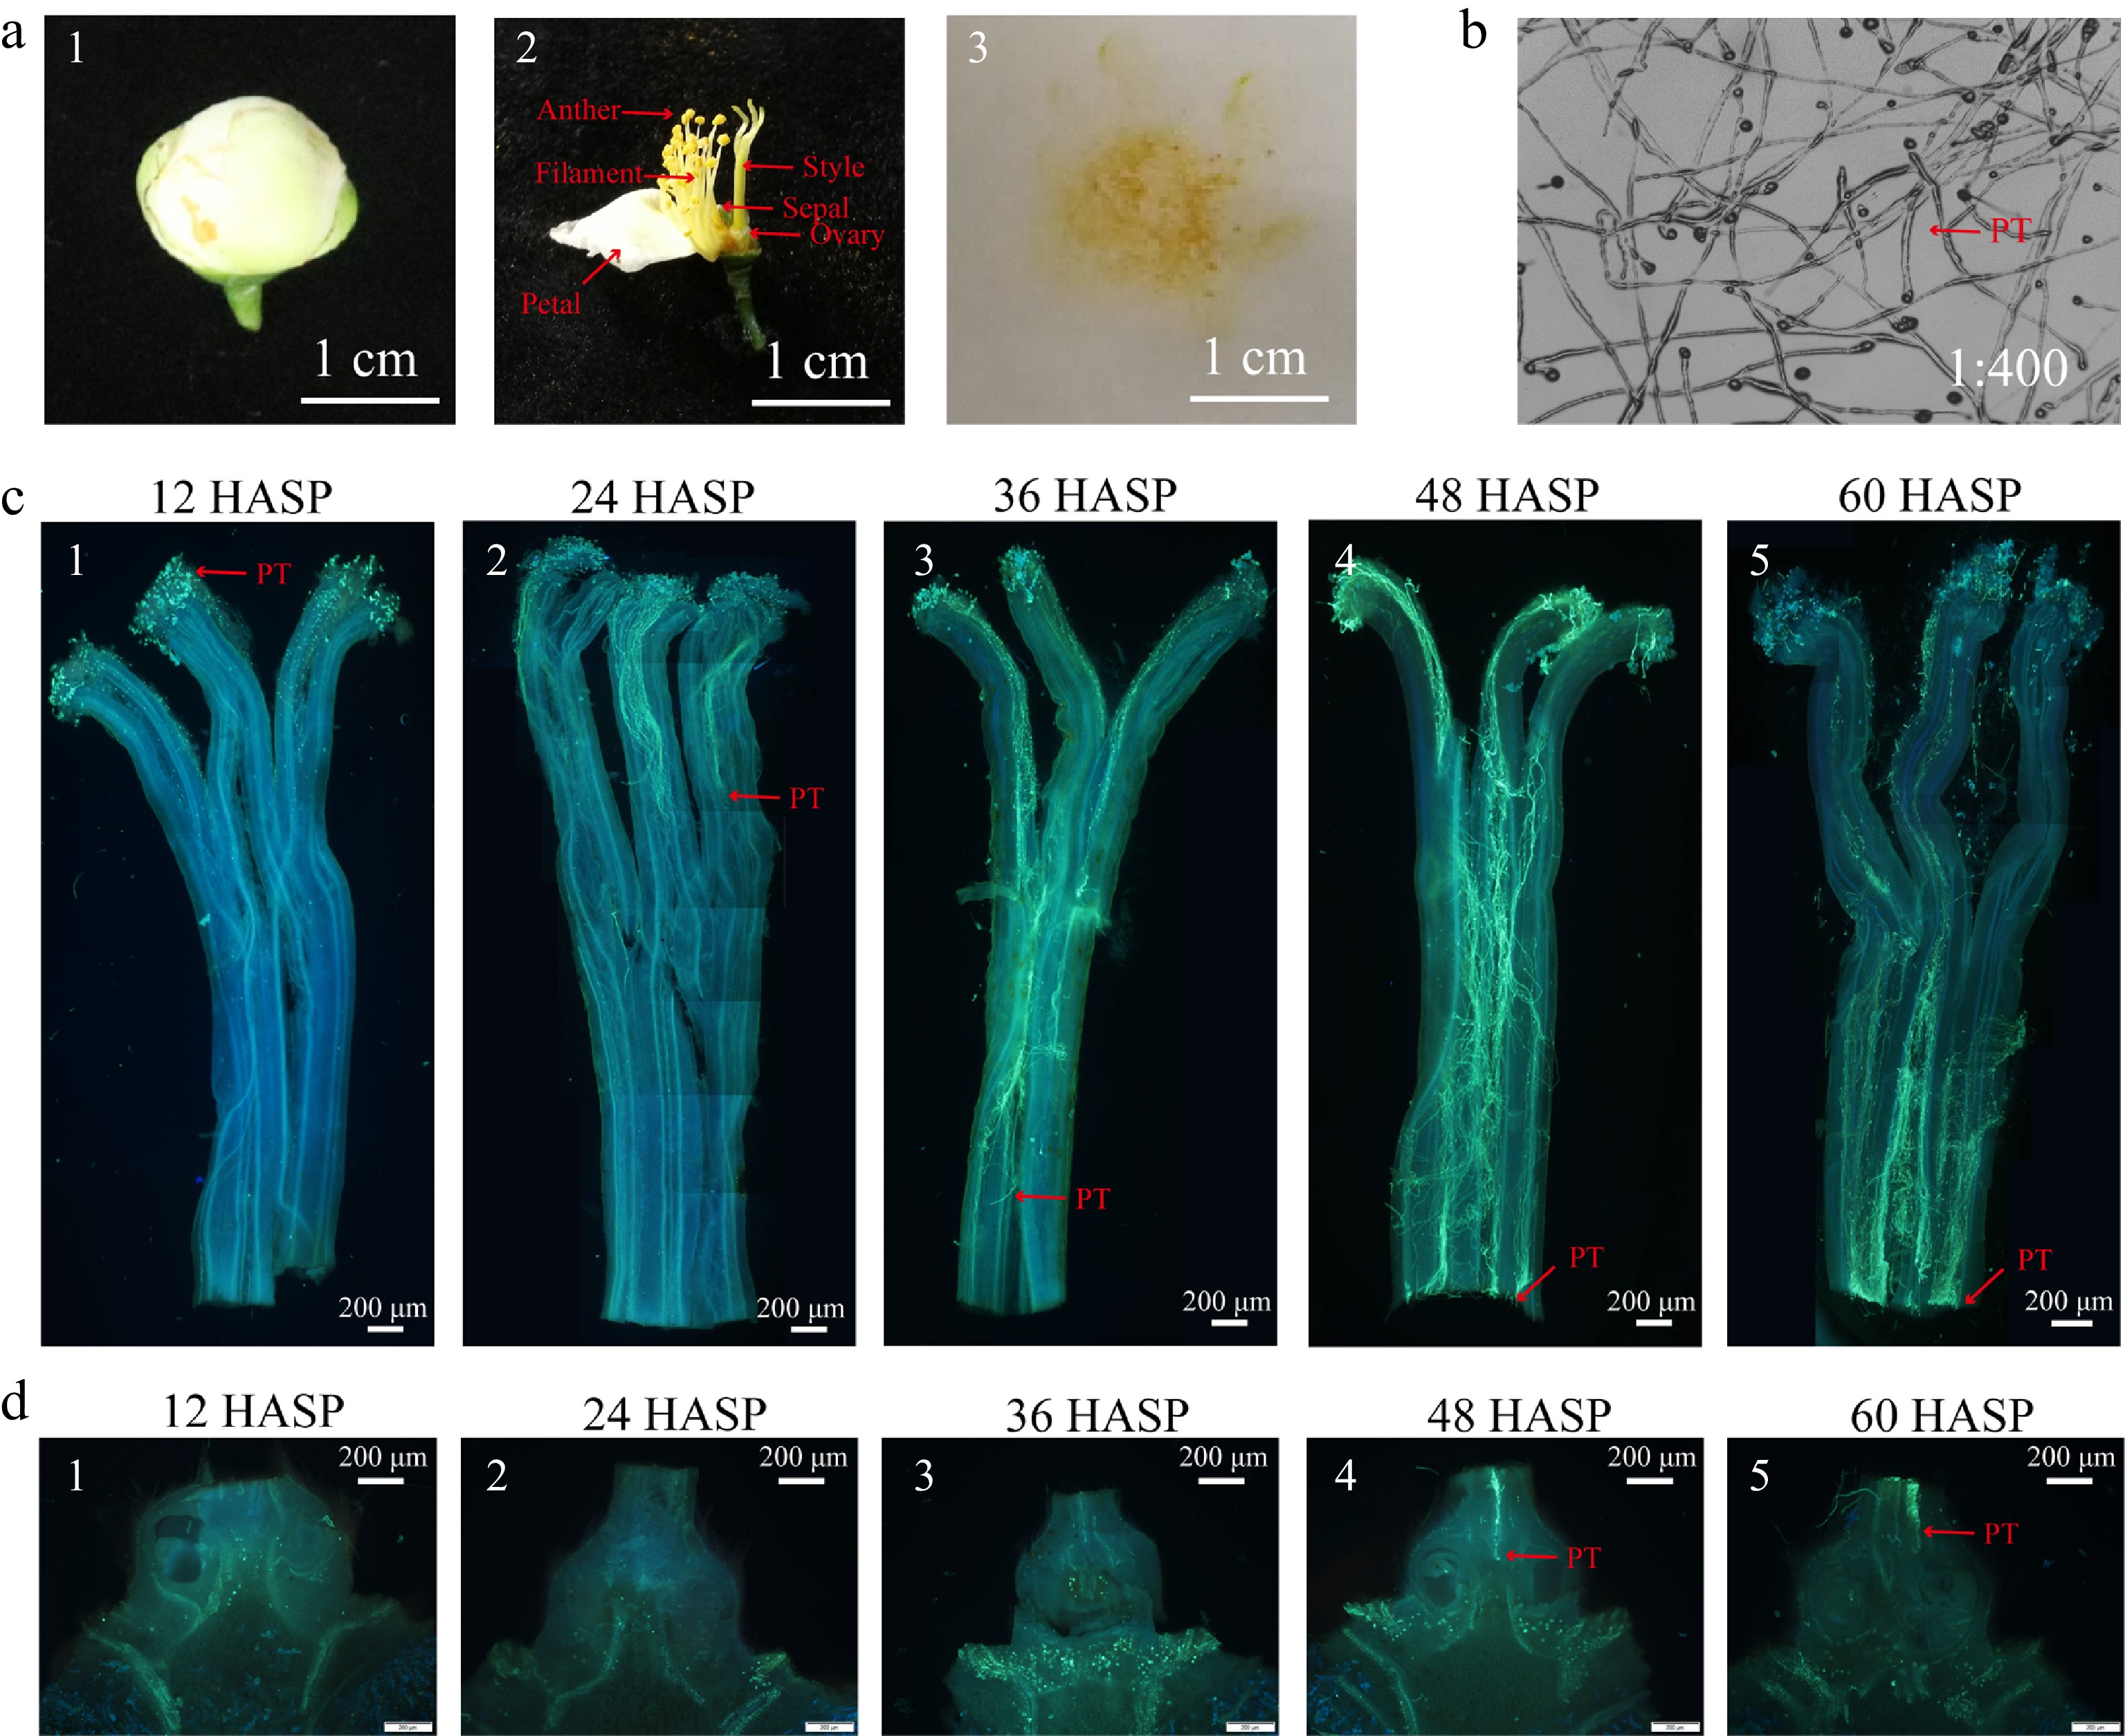
Figure 1.
Growth of pollen tube in pistil after self-pollination. (a) 1−2 Picture and internal structure of balloon stage flower used to collect pollen; 3 Pollen. (b) Pollen germination experiment in vitro. (c) 1−5 Pollen tube growth in style after self-pollination. (d) 1−5 Longitudinal section of the ovary after self-pollination. HASP: hours after self-pollination; PT: pollen tube.
-
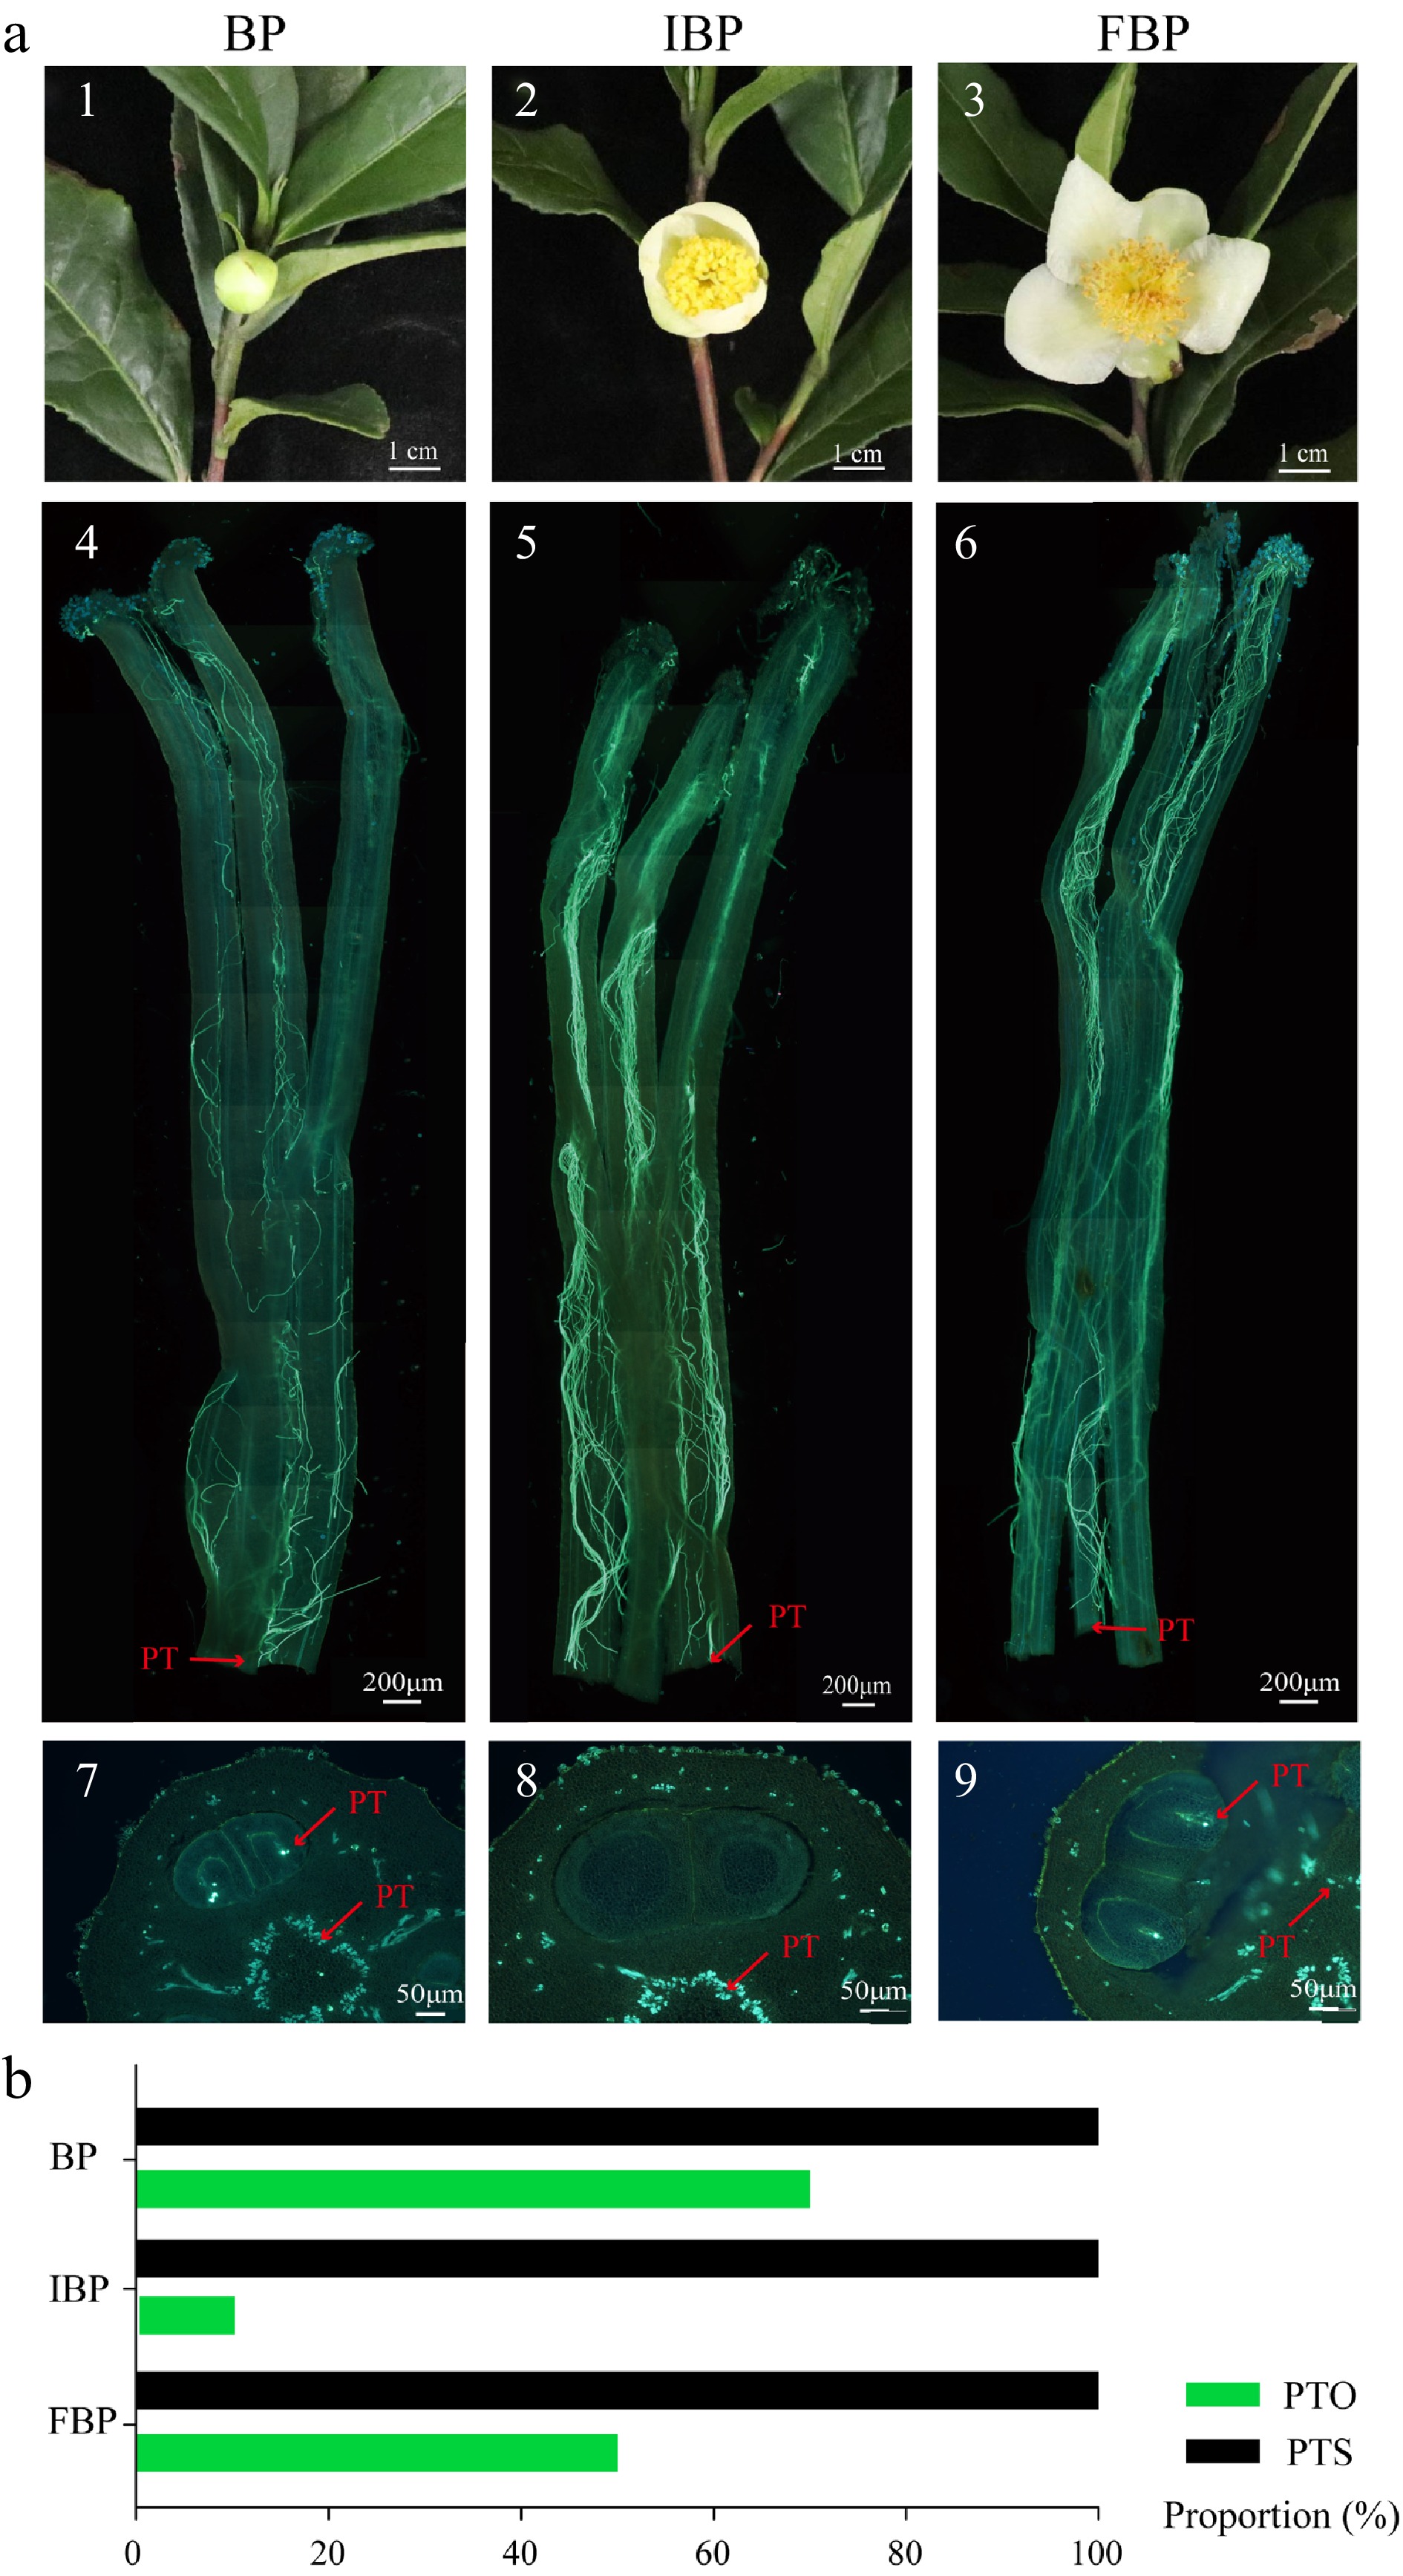
Figure 2.
Growth of pollen tube in different flowering stage at 48 HASP. (a) 1−3 Pictures of flowers at different flowering stages; 4−6 Growth of pollen tubes in style at 48 HASP at different flowering stages; 7−9 Cross section of ovary at 48 HASP. (b) Fluorescence microscope was used to observe and count the PTS and PTO at 48 HASP. HASP: hours after self-pollination; BP: pistil at 48 HASP at bud stage; IBP: pistil at 48 HASP at initial bloom stage; FBP: pistil at 48 HASP at full bloom stage; PT: pollen tube; PTS: proportion of pollen tube through the base of the style; PTO: proportion of pollen tube into ovule.
-
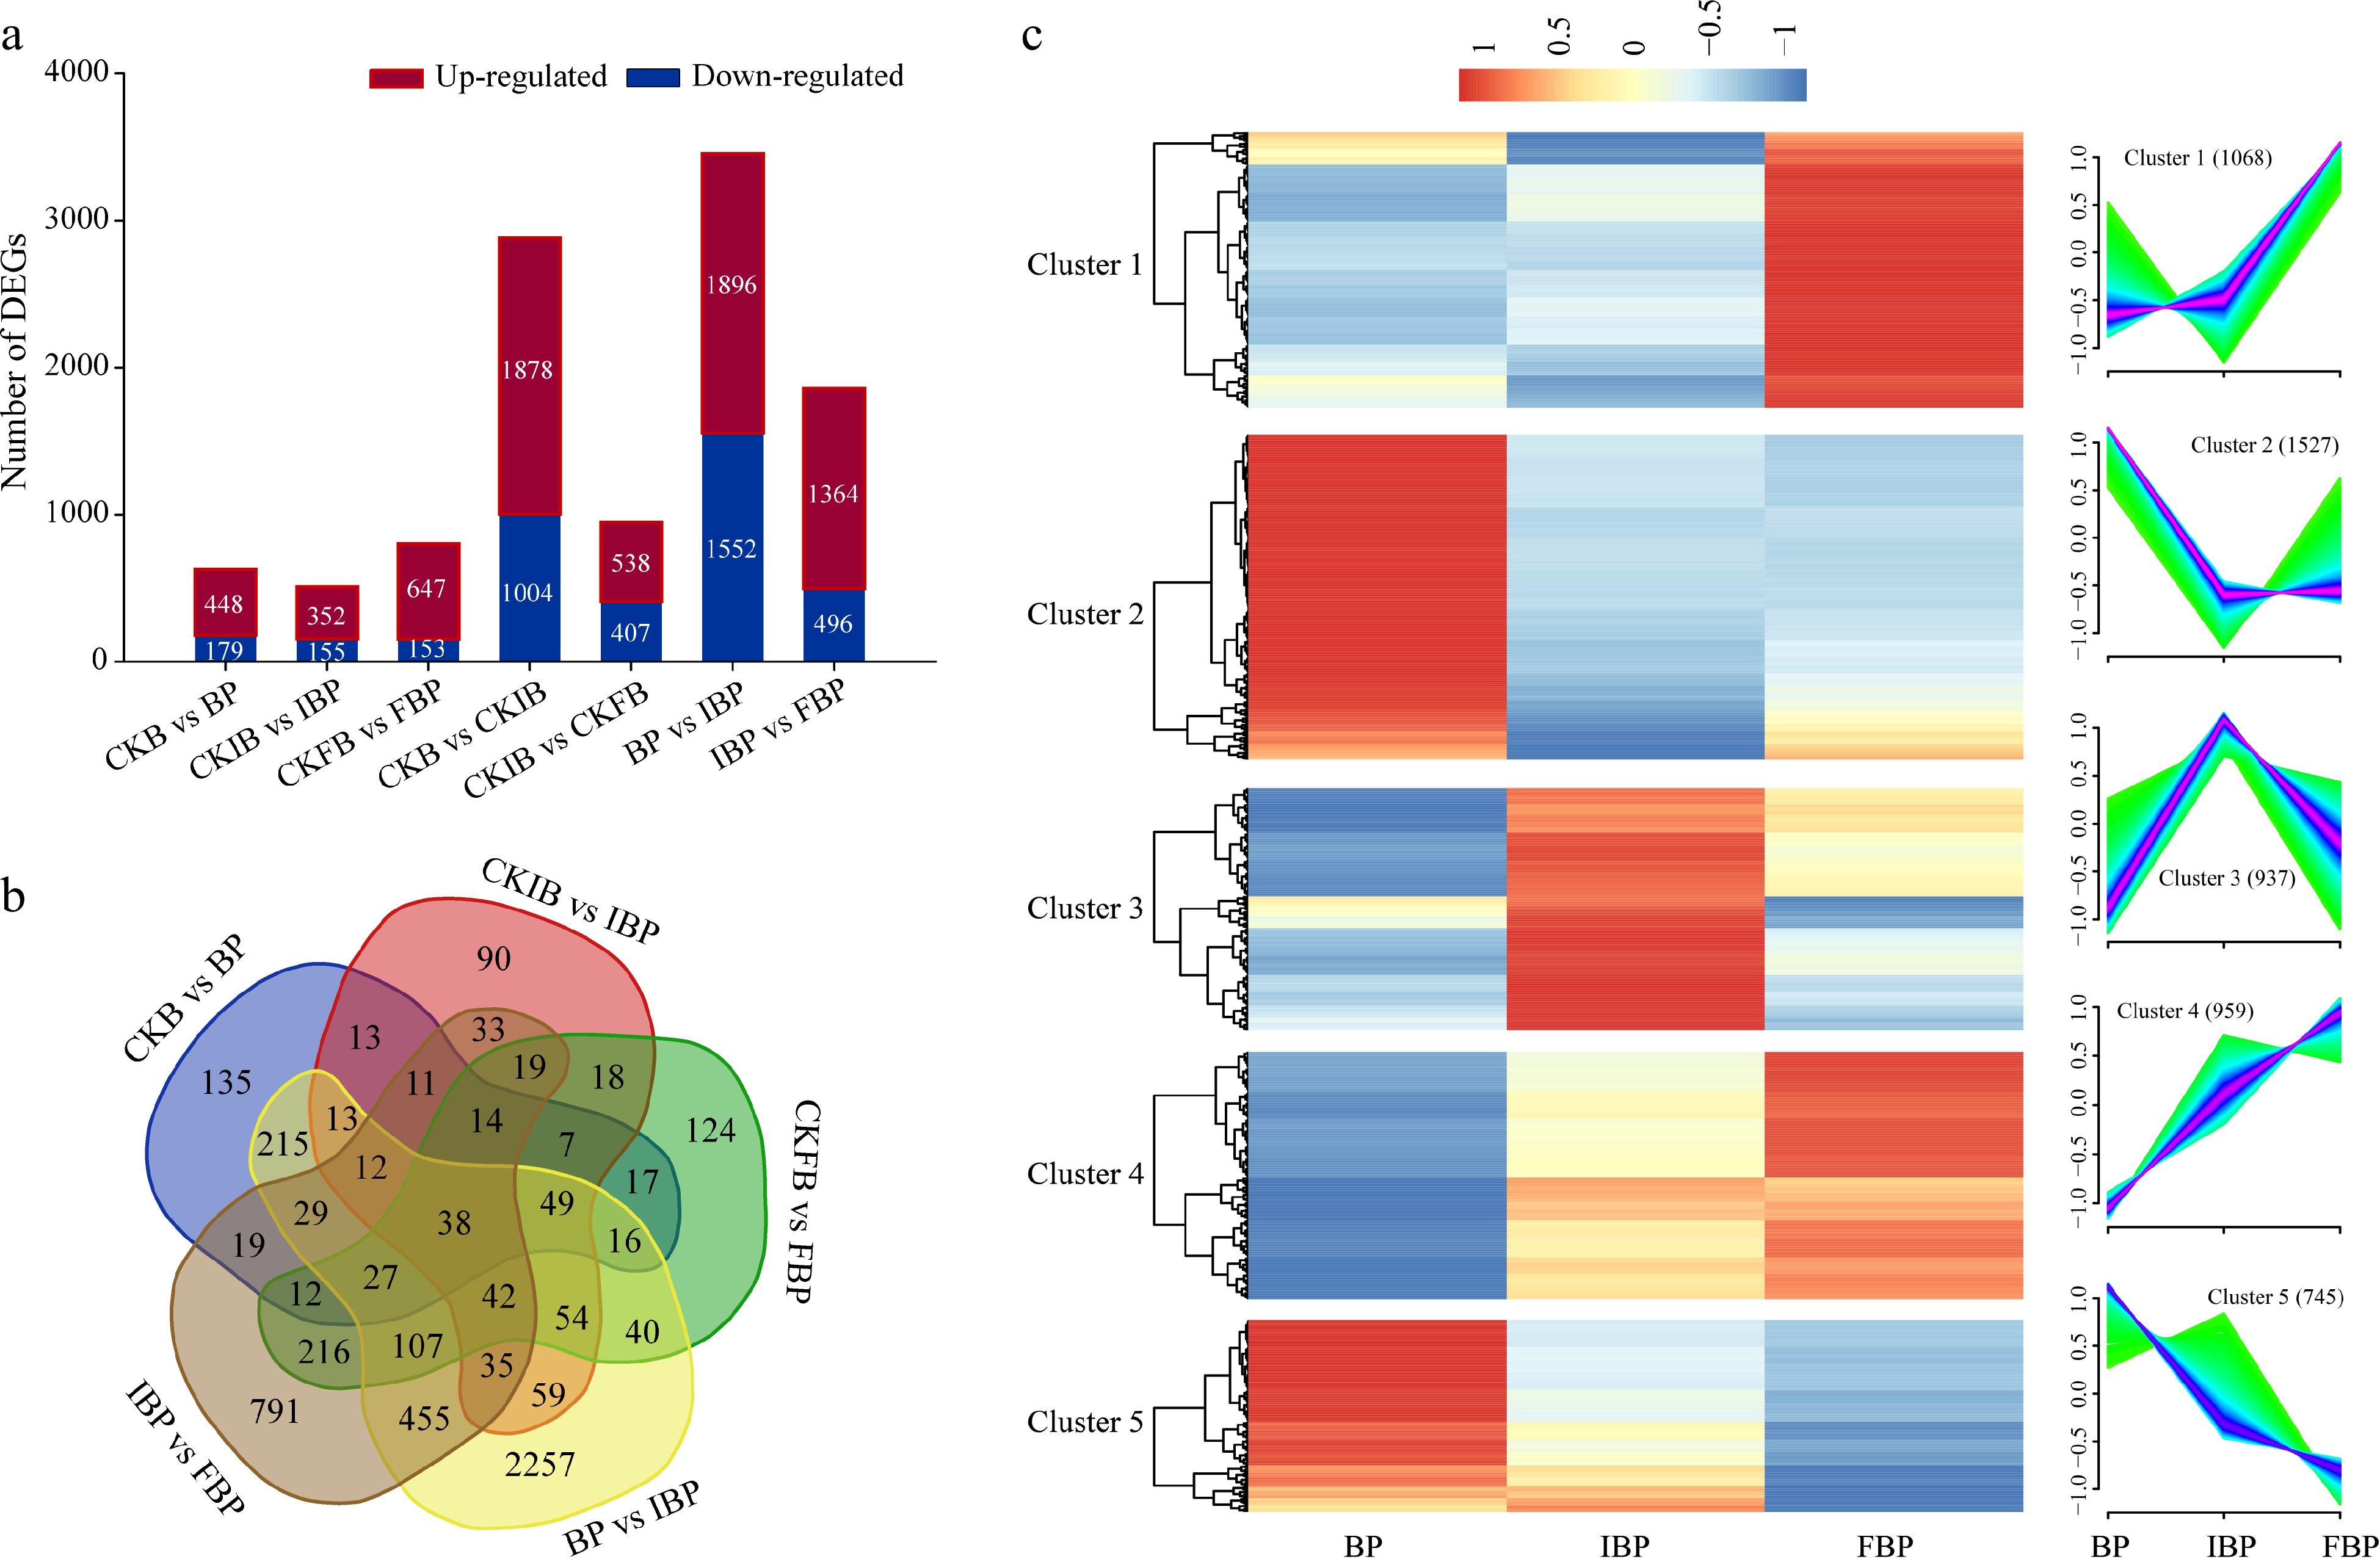
Figure 3.
Analysis of differentially expressed genes (DEGs) after self-pollination. (a) Numbers of DEGs in different comparisons. (b) Venn-flower diagram of DEGs. CKB: unpollinated pistil at bud stage; CKIB: unpollinated pistil at initial bloom stage; CKFB: unpollinated pistil at full bloom stage; BP: pistil at 48 HASP at bud stage; IBP: pistil at 48 HASP at initial bloom stage; FBP: pistil at 48 HASP at full bloom stage. (c) Cluster analysis of all DEGs.
-
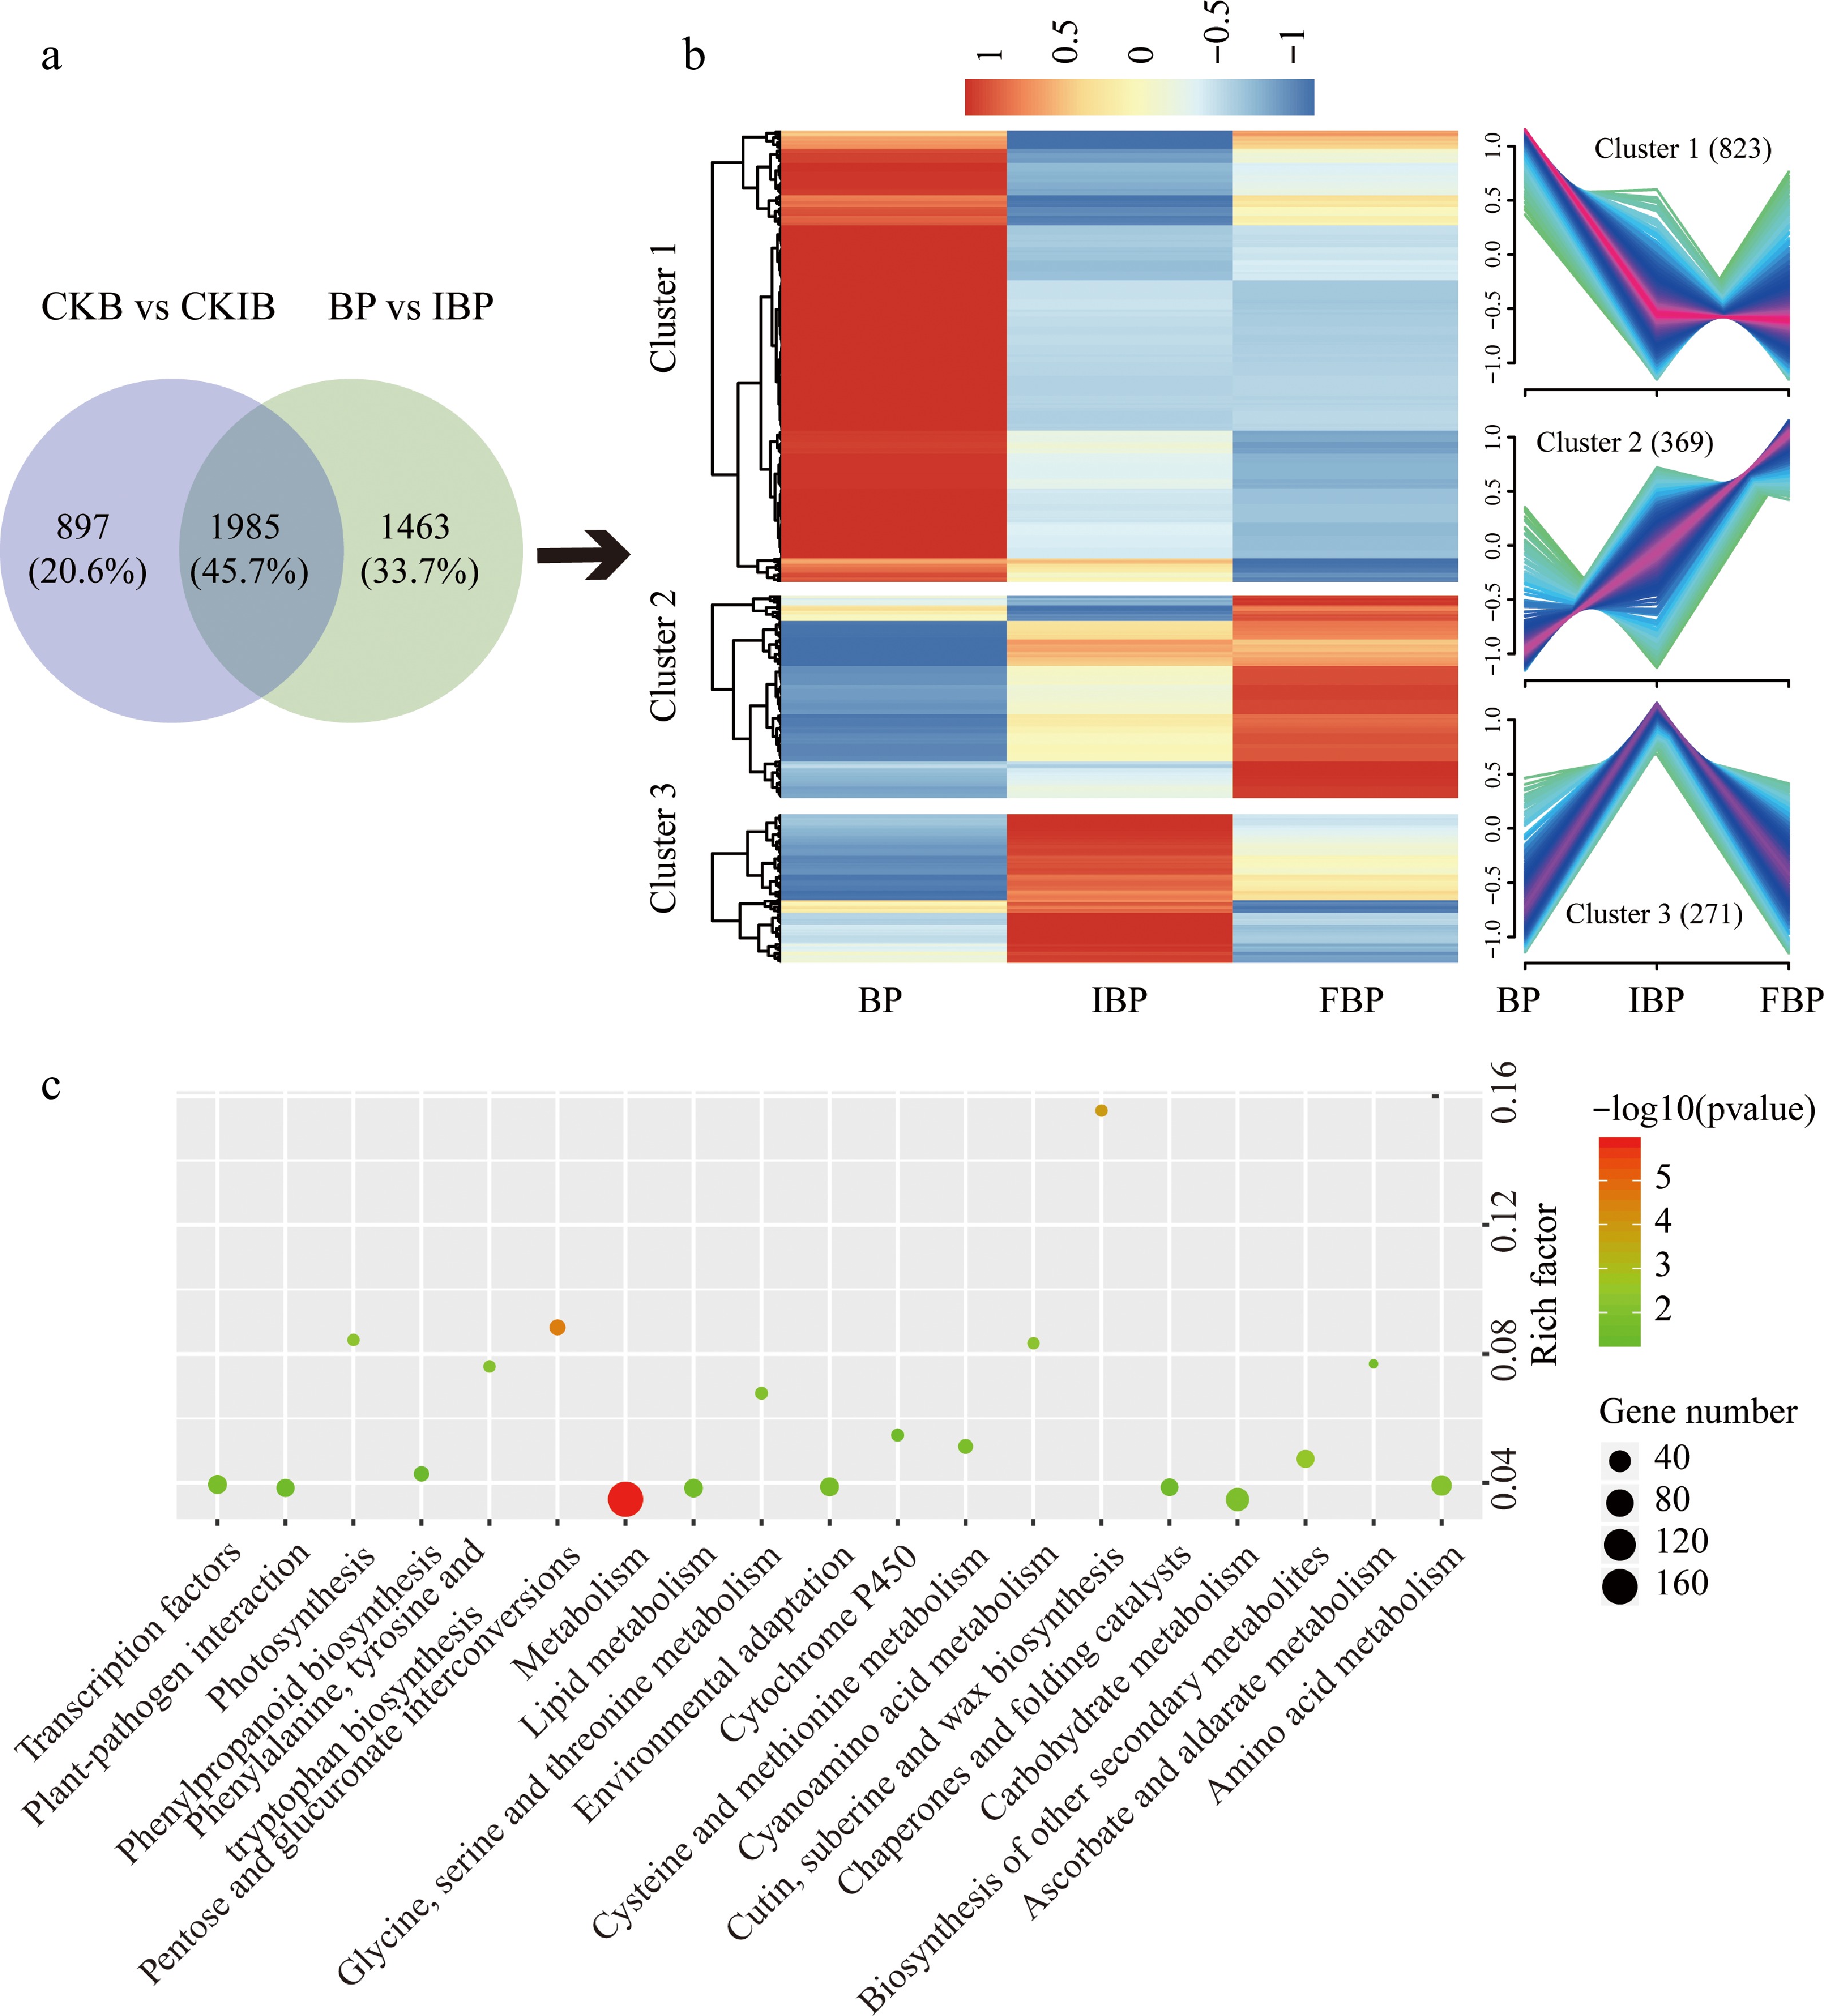
Figure 4.
Analysis of SI related genes in BP. (a) Venn diagram displays the number of specific genes in BP. (b) Cluster analysis of DEGs in BP. (c) KEGG pathway enrichment analysis of genes in cluster 1 and cluster 2. The rich factor represents the ratio of the number of DEGs and the number of all the unigenes in the pathway.
-
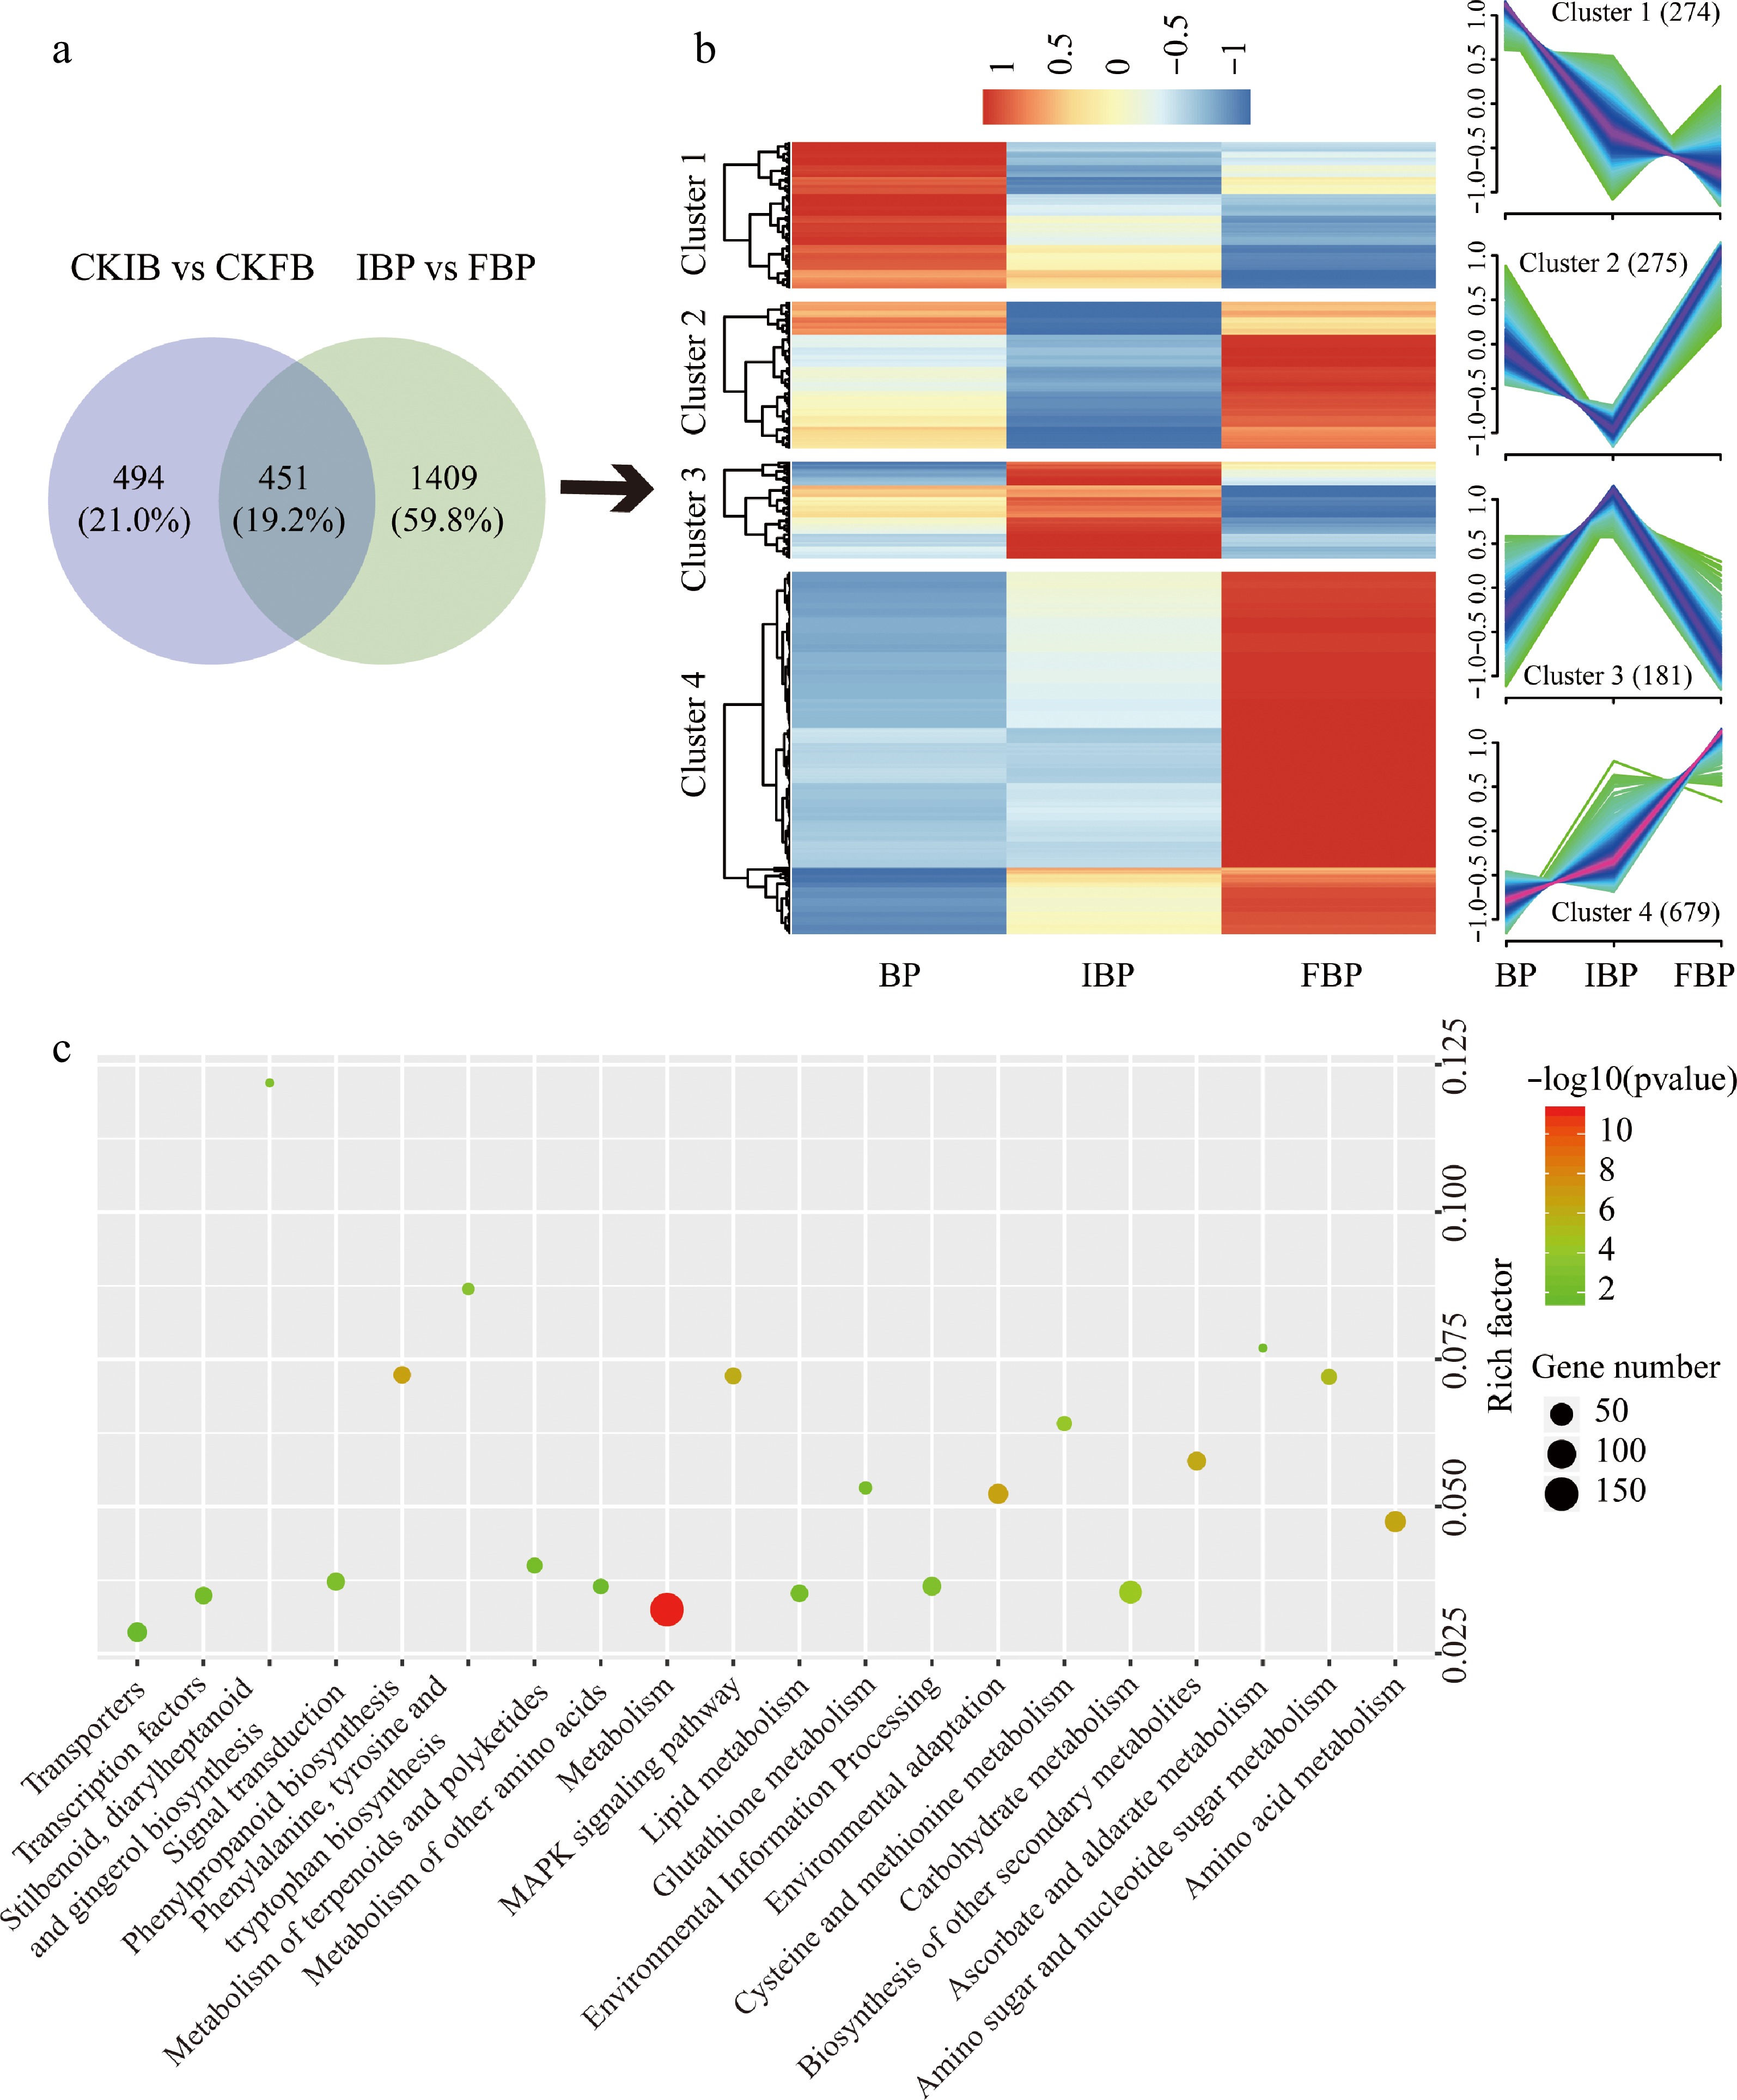
Figure 5.
Analysis of SI related genes in FBP. (a) Venn diagram displays the number of specific genes in FBP. (b) Cluster analysis of DEGs in FBP. (c) KEGG pathway enrichment analysis of genes in cluster 1 and cluster 4.
-
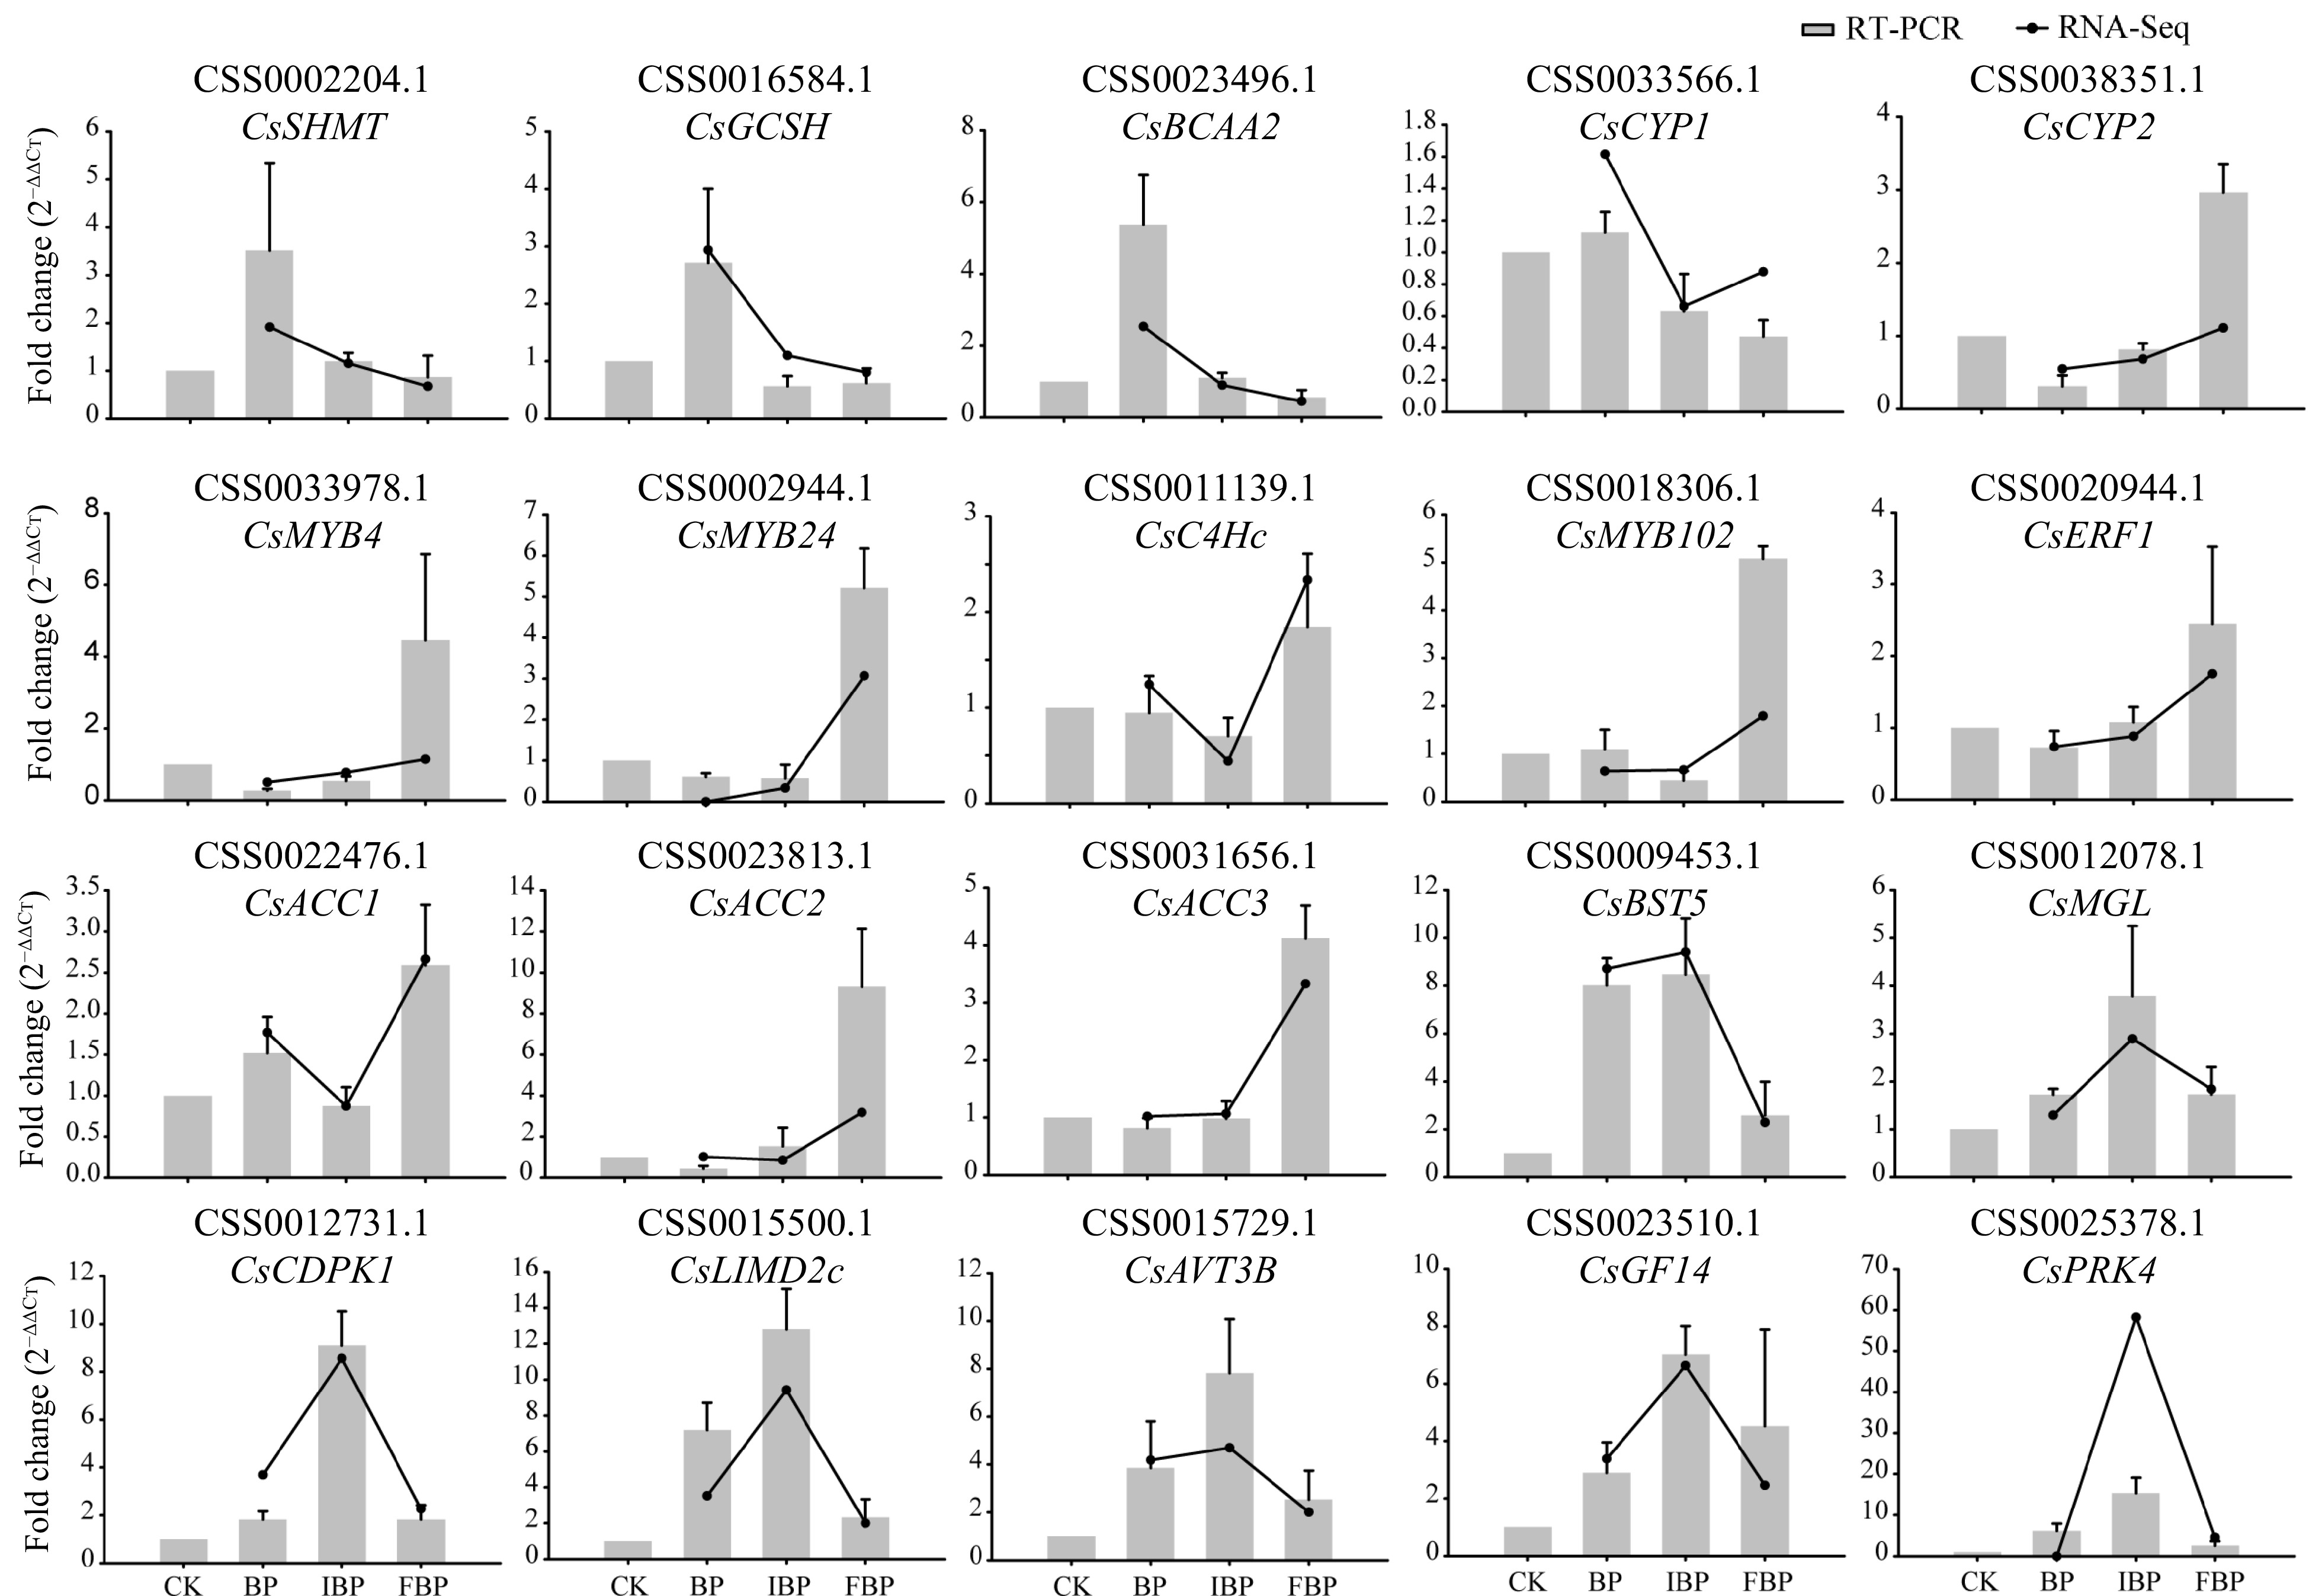
Figure 6.
qRT-PCR validation of 20 DEGs related toSI. Gray pillars represents the results of qRT-PCR, and the black line represents the results of RNA-seq.
-
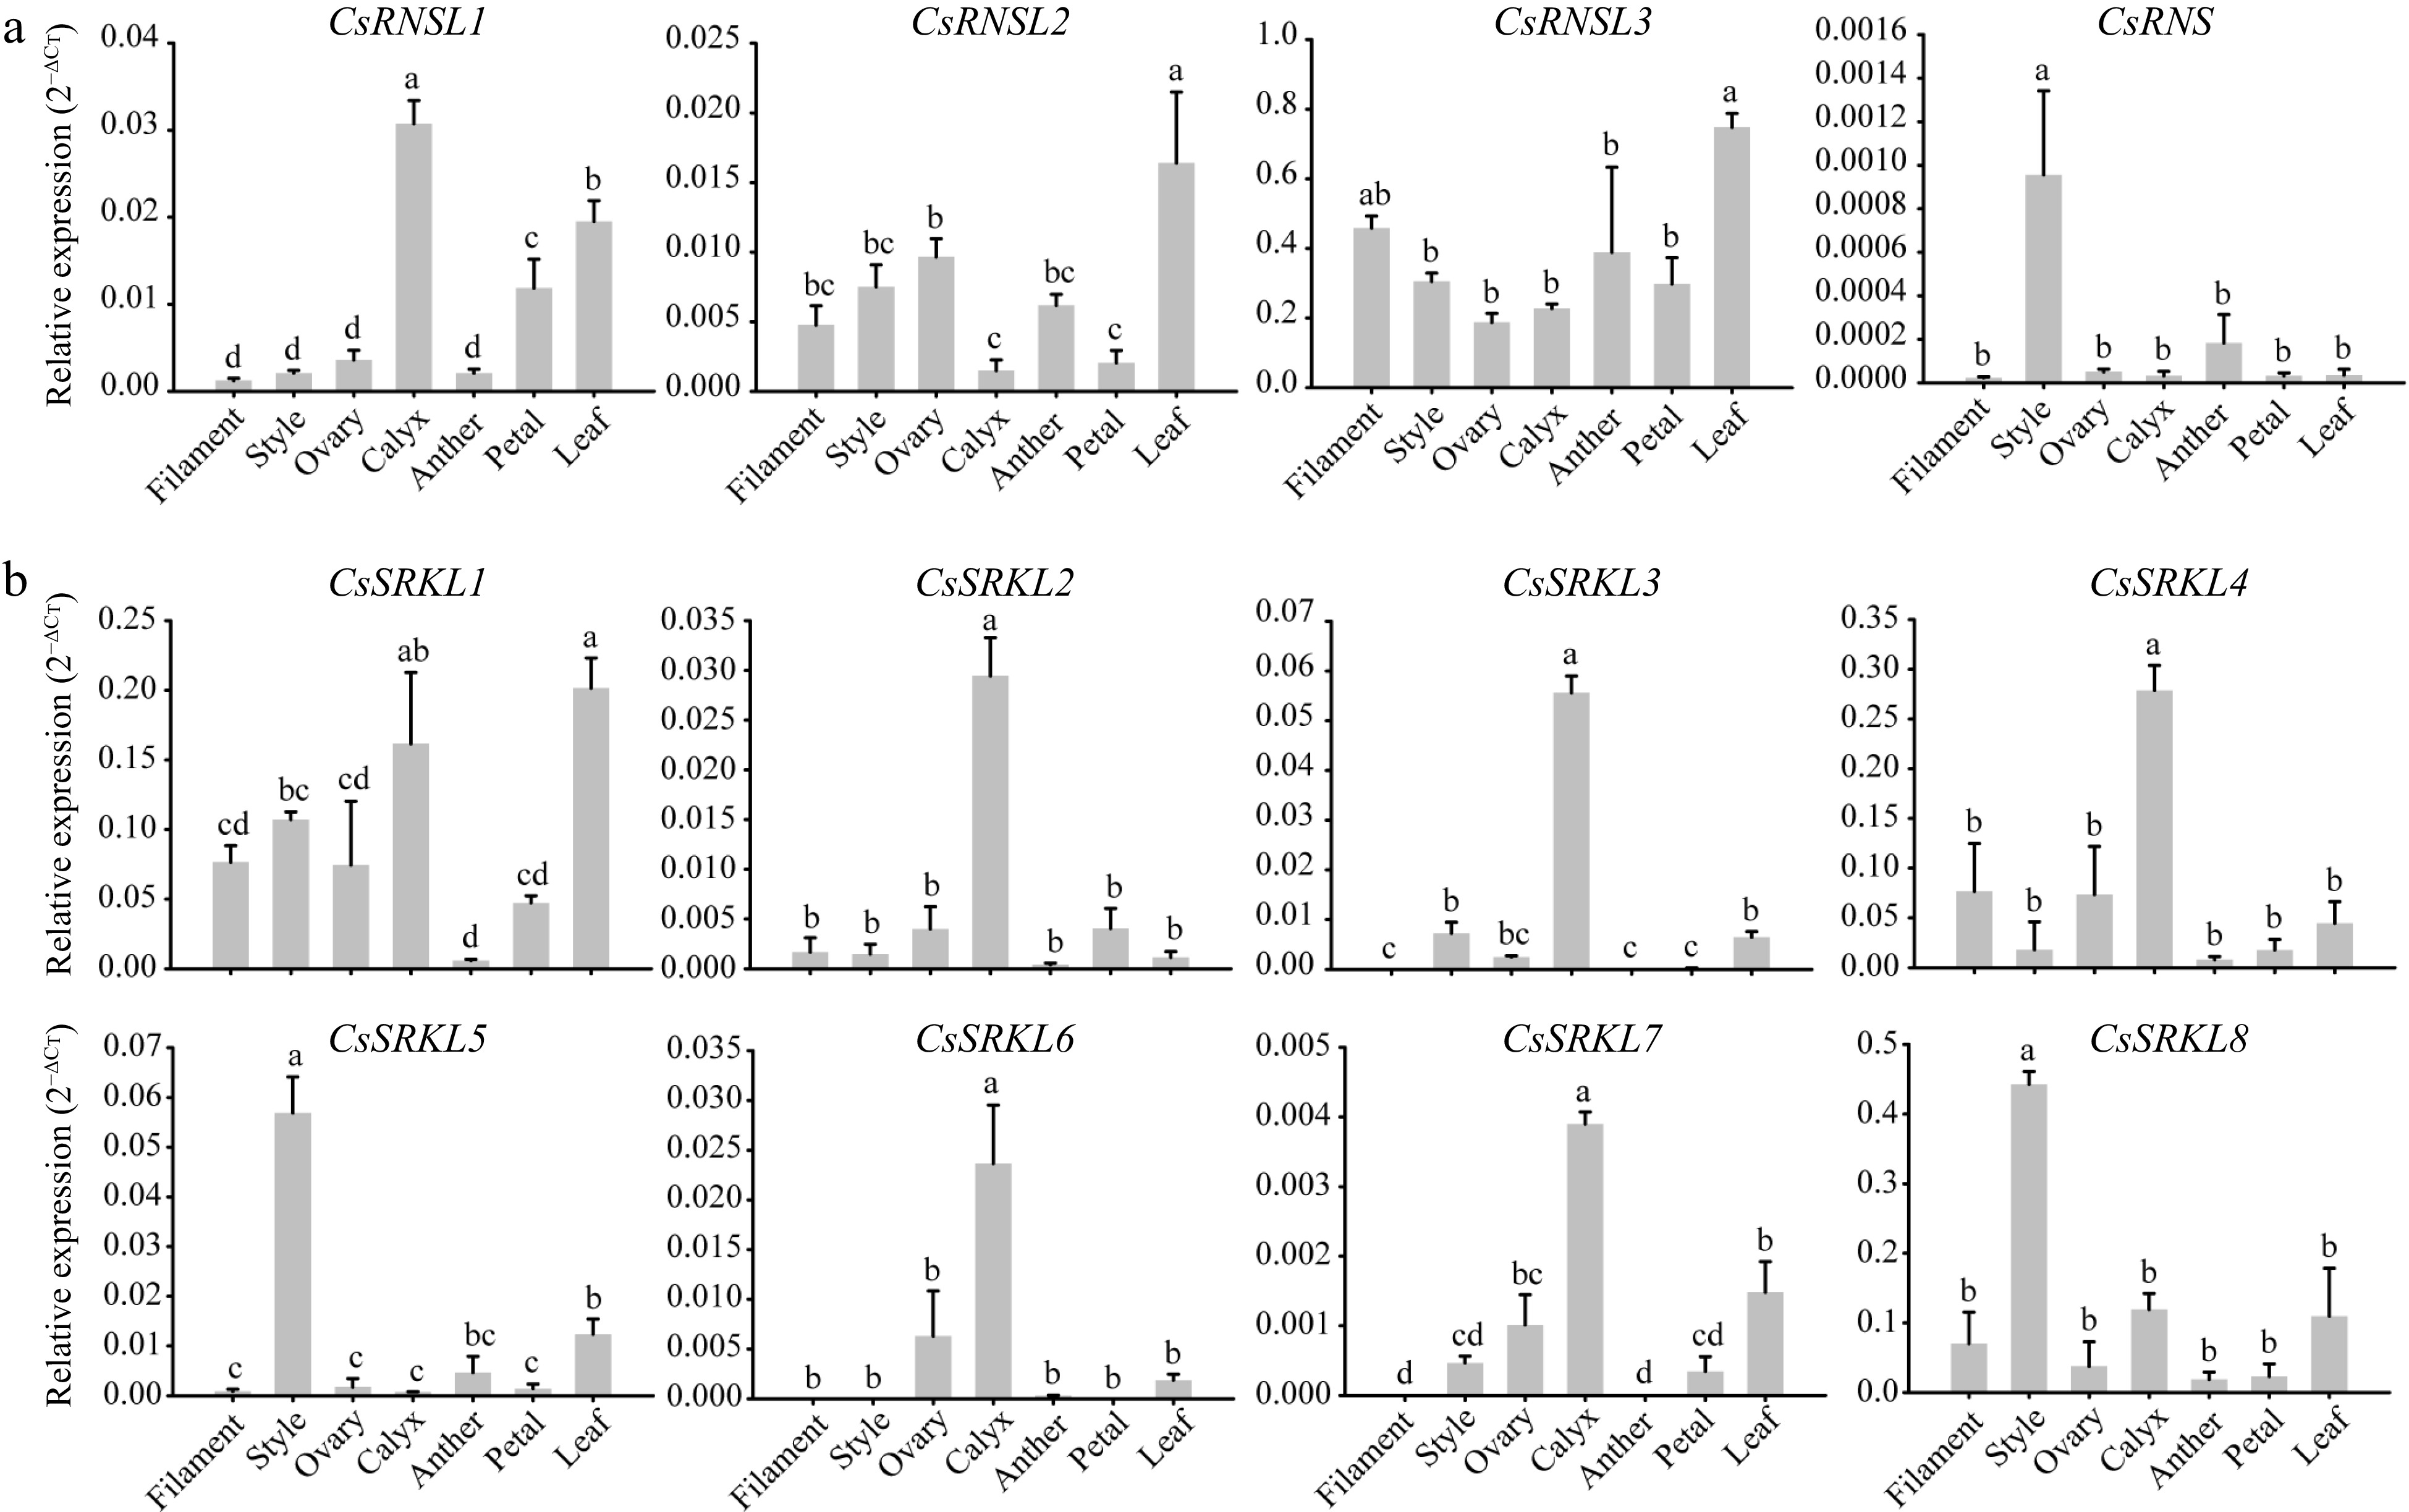
Figure 7.
Expression patterns of the putative 12 SI genes in different flower organs. (a) The relative expression levels of four S-RNase genes in seven different flower organs. (b) The expression patterns of eight SRK genes in seven different flower organs.
-
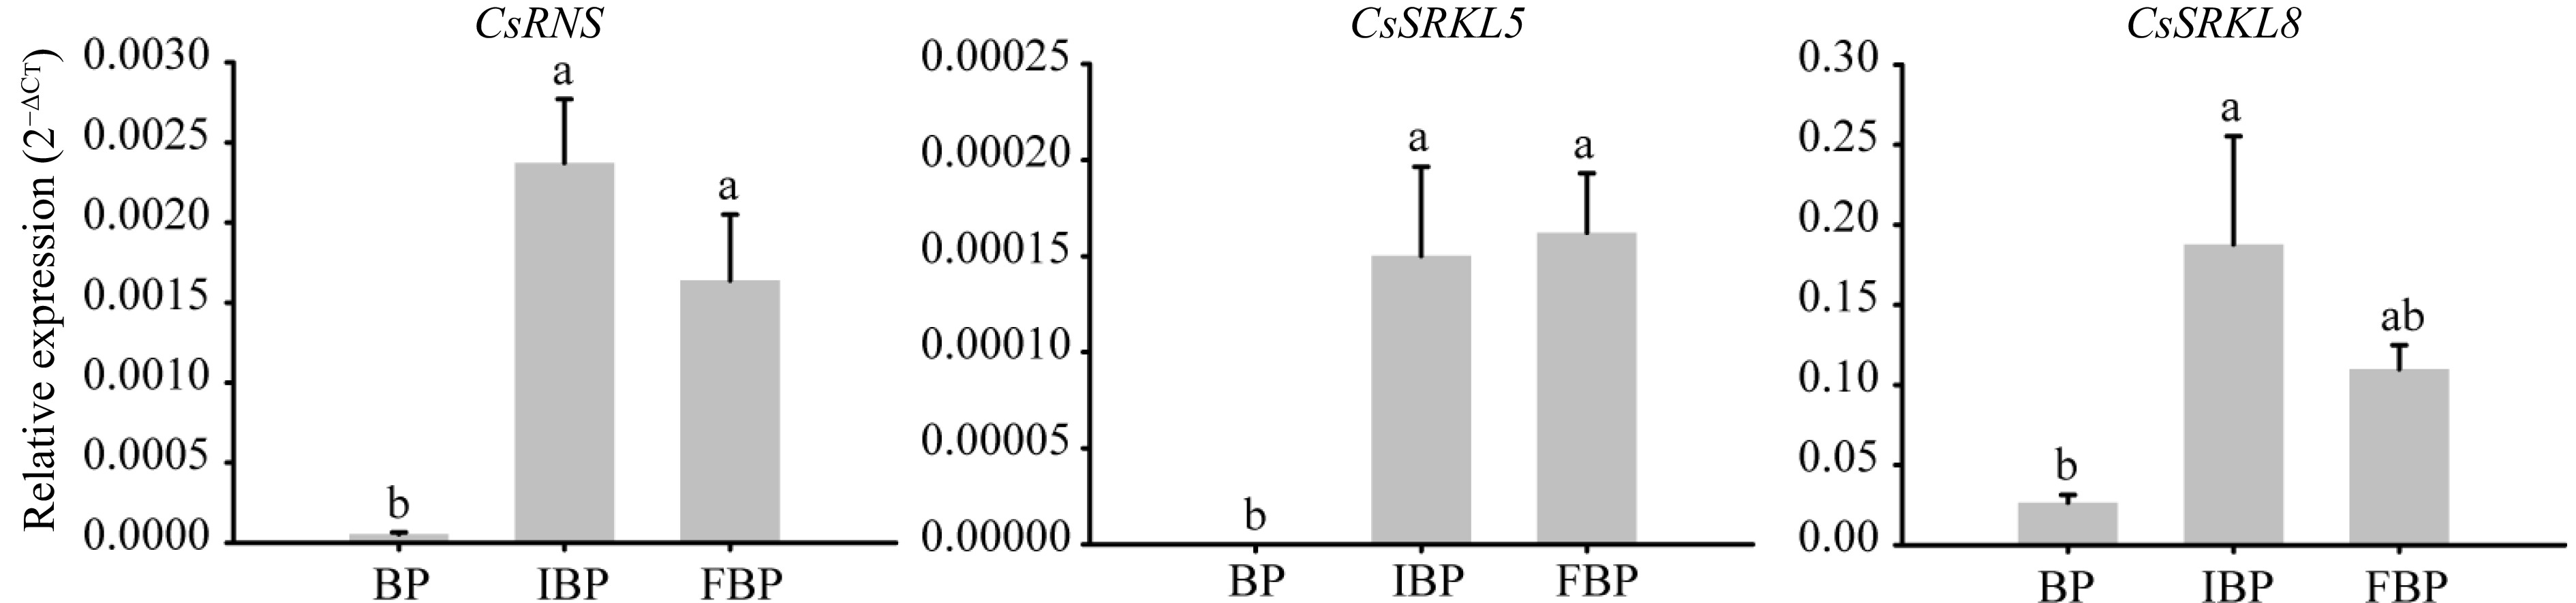
Figure 8.
The relative expression levels of putative three SI genes at different flowering stage pistils.
-
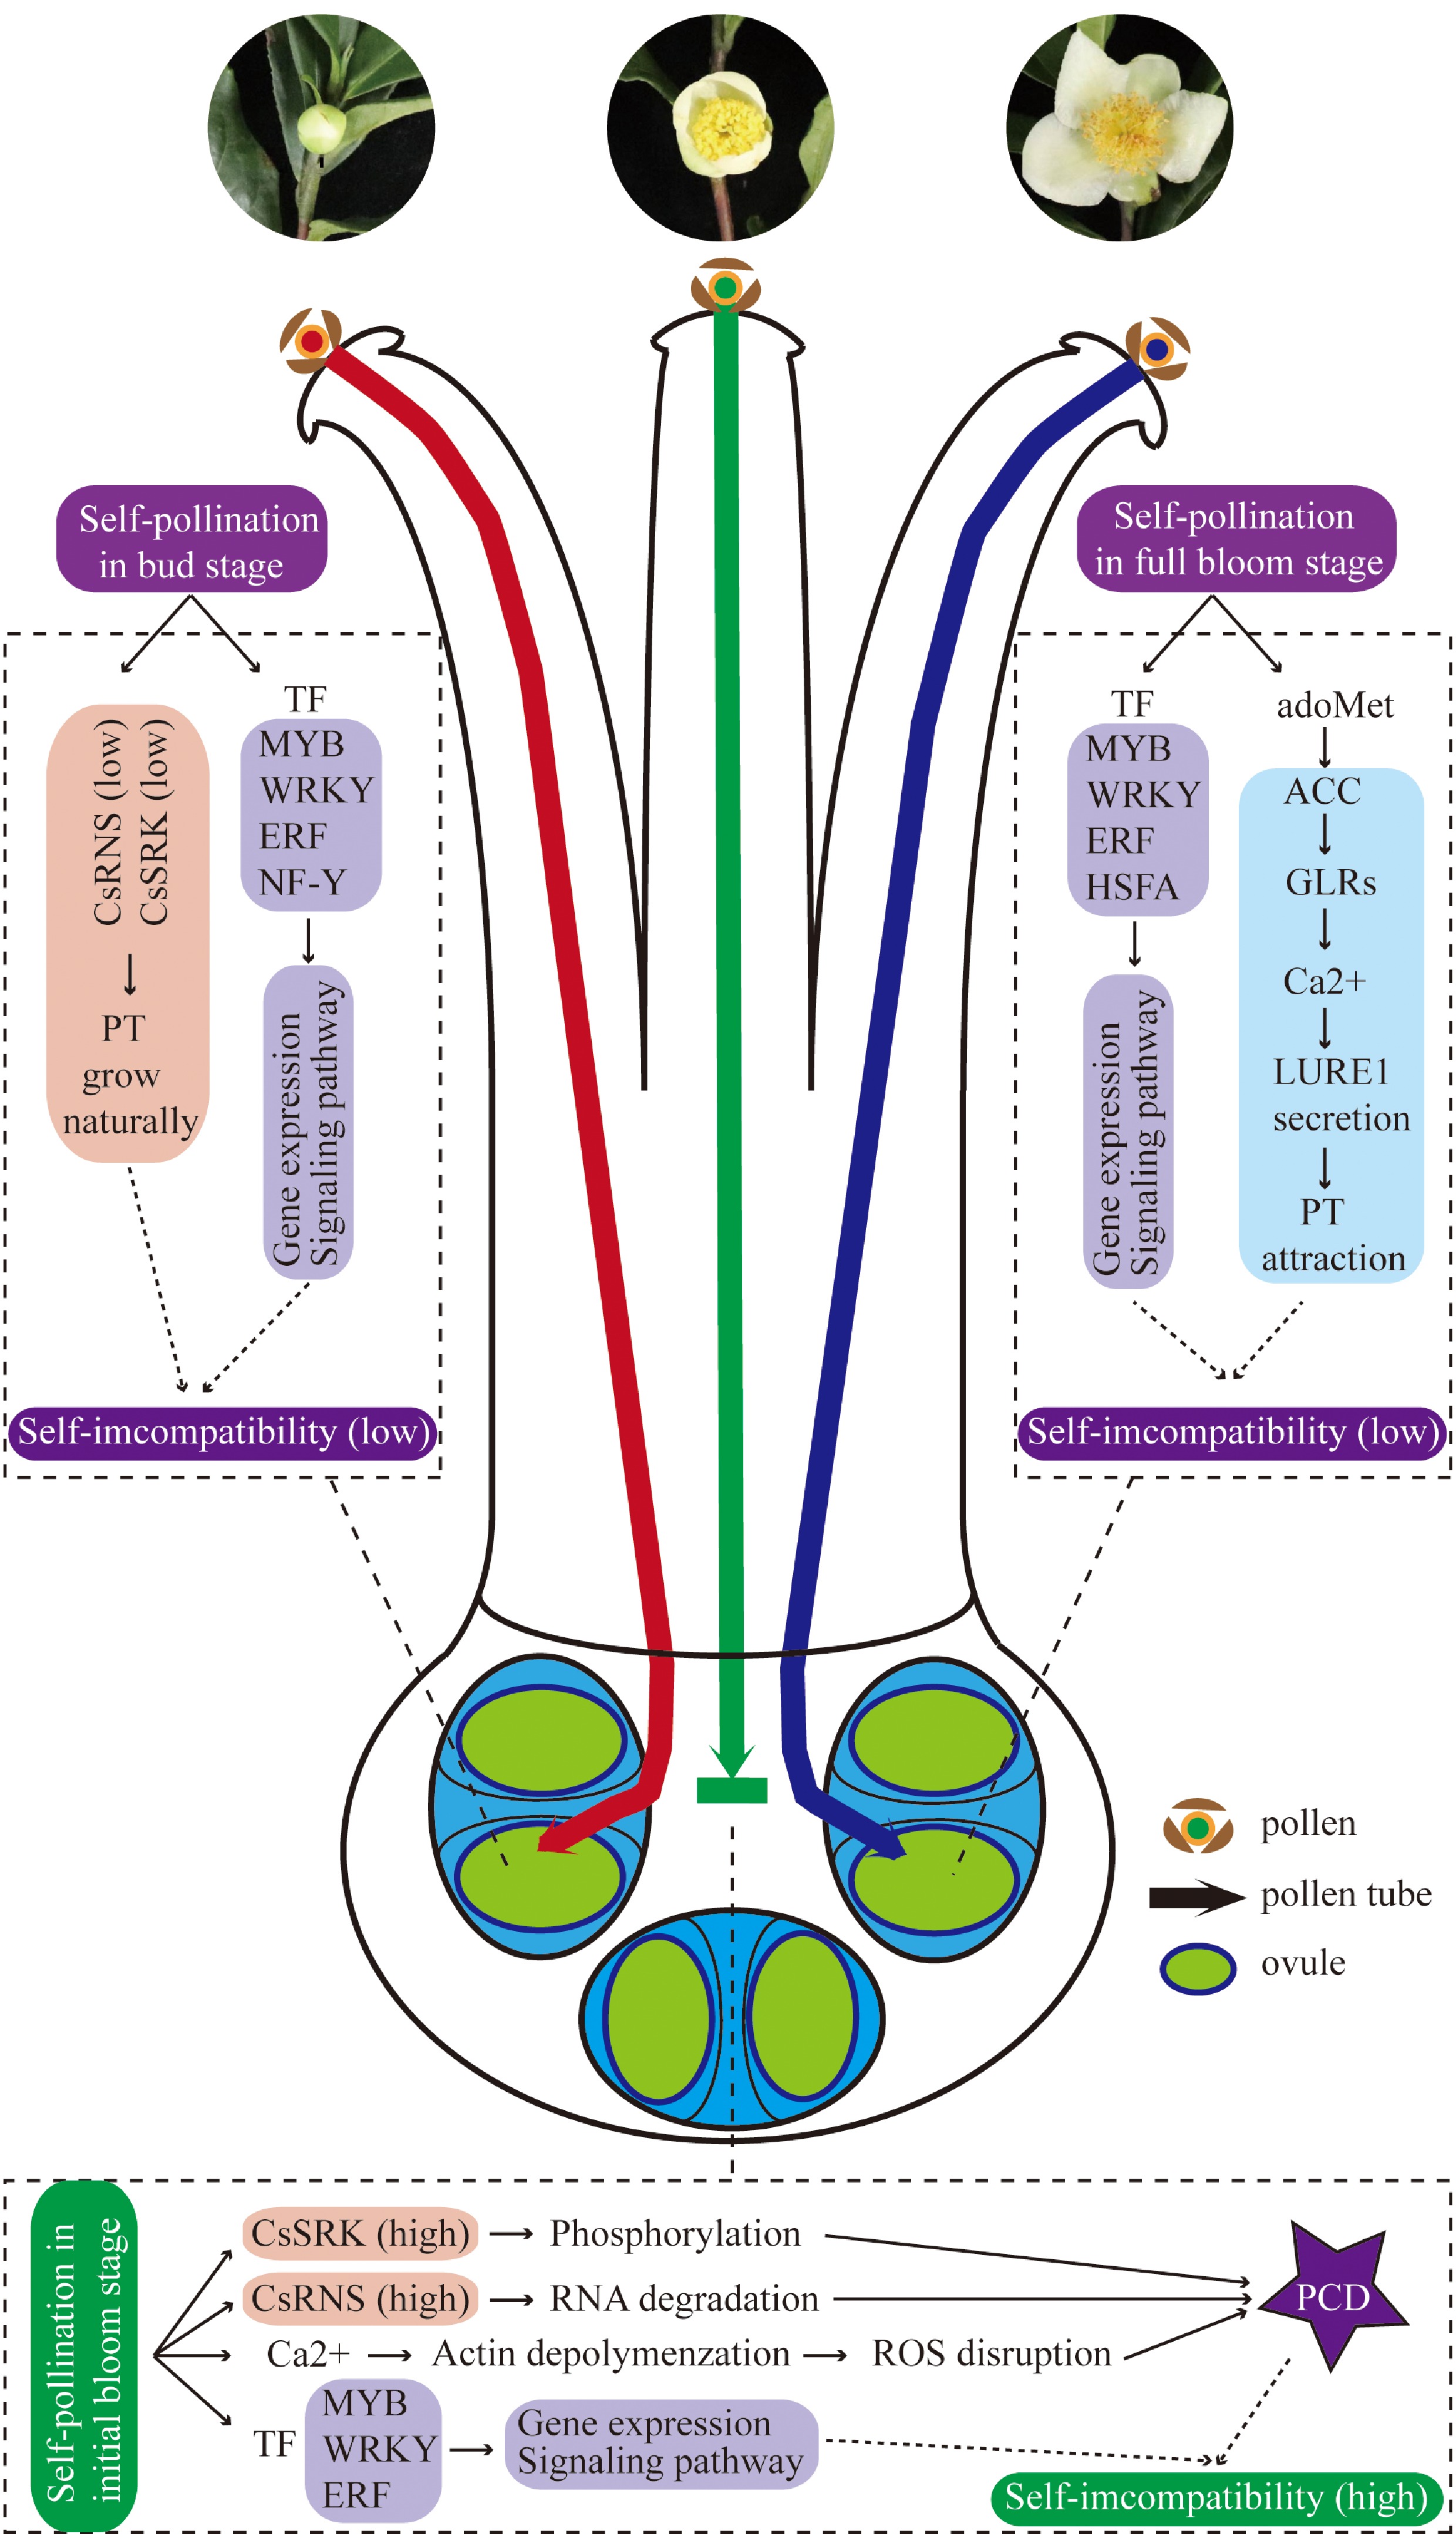
Figure 9.
Proposed molecular mechanism model of SI difference at different flowering stage pistils.
Figures
(9)
Tables
(0)