-
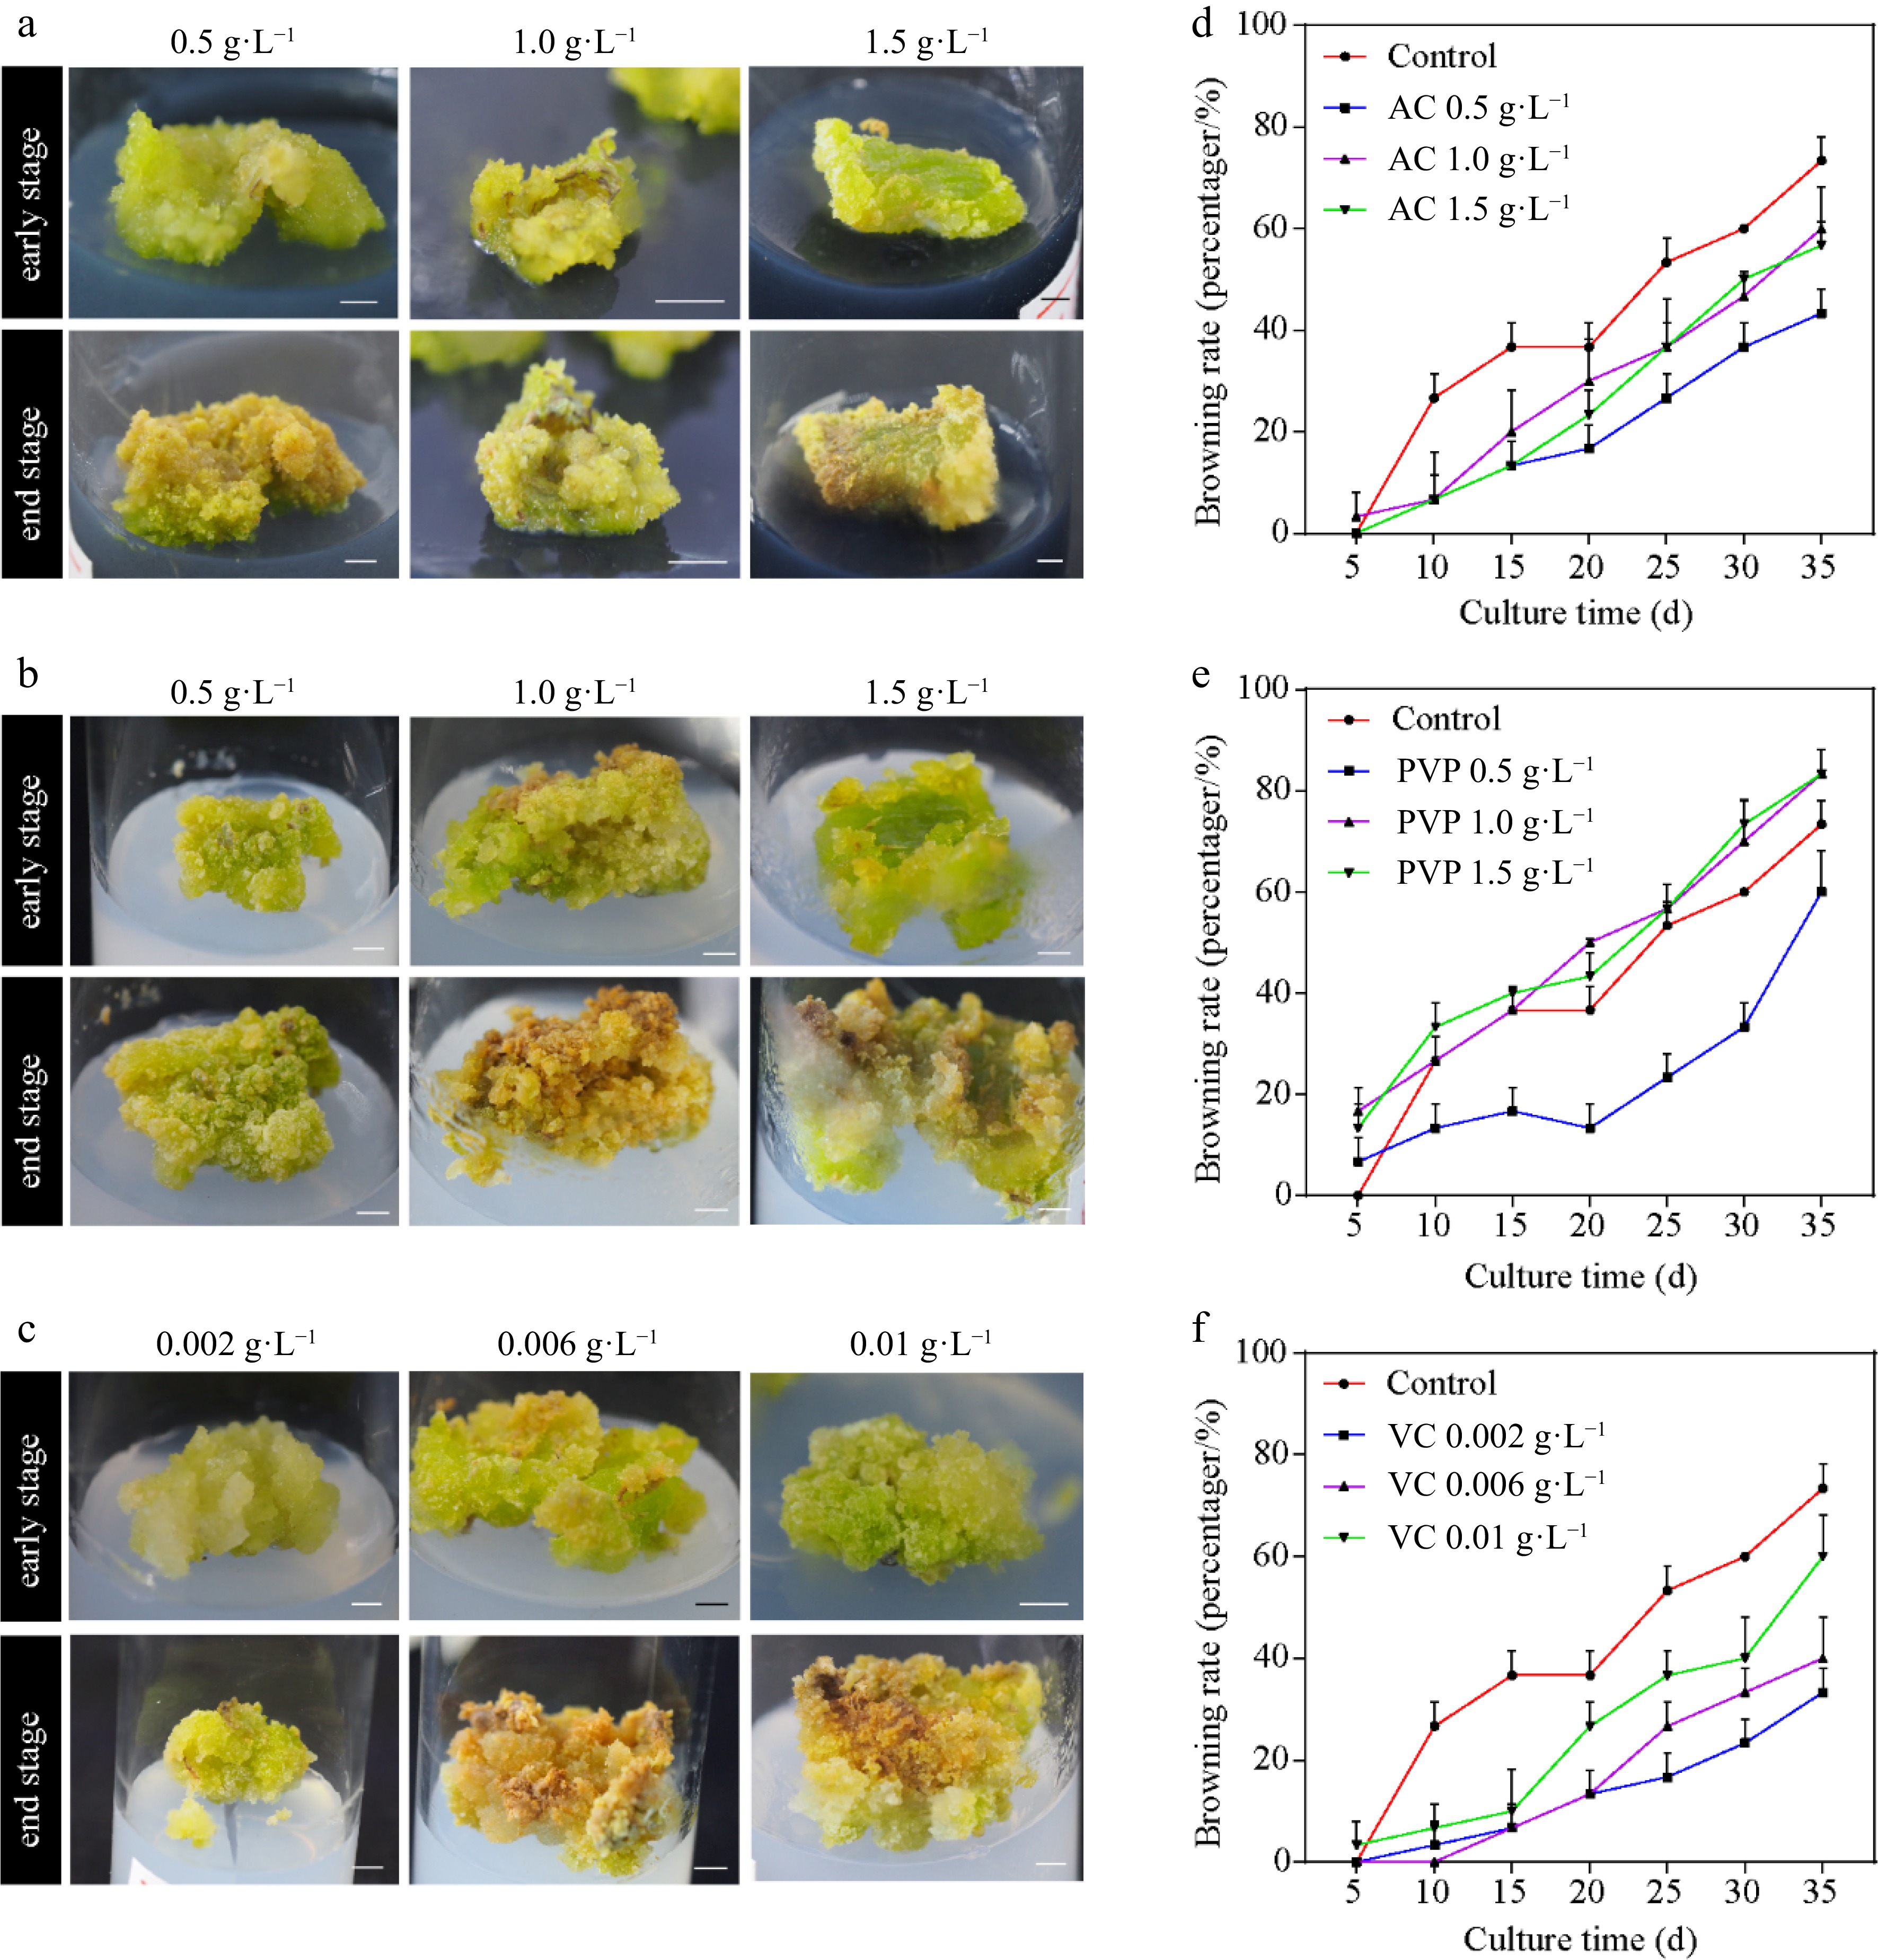
Figure 1.
Callus induction from Ginkgo biloba leaves and browning rates. The morphology of calli cultured on the induction medium supplemented with different concentrations of browning inhibitors. (a) 0.5, 1.0, and 1.5 g·L−1 activated carbon (AC). (b) 0.5, 1.0, and 1.5 g·L−1 polyvinylpyrrolidone (PVP). (c) 0.002, 0.006, and 0.01 g·L−1 vitamin C (VC). (d)–(f) Effects of different concentrations of AC, PVP, and VC on the browning rate of ginkgo calli. Scale bars = 5 mm.
-
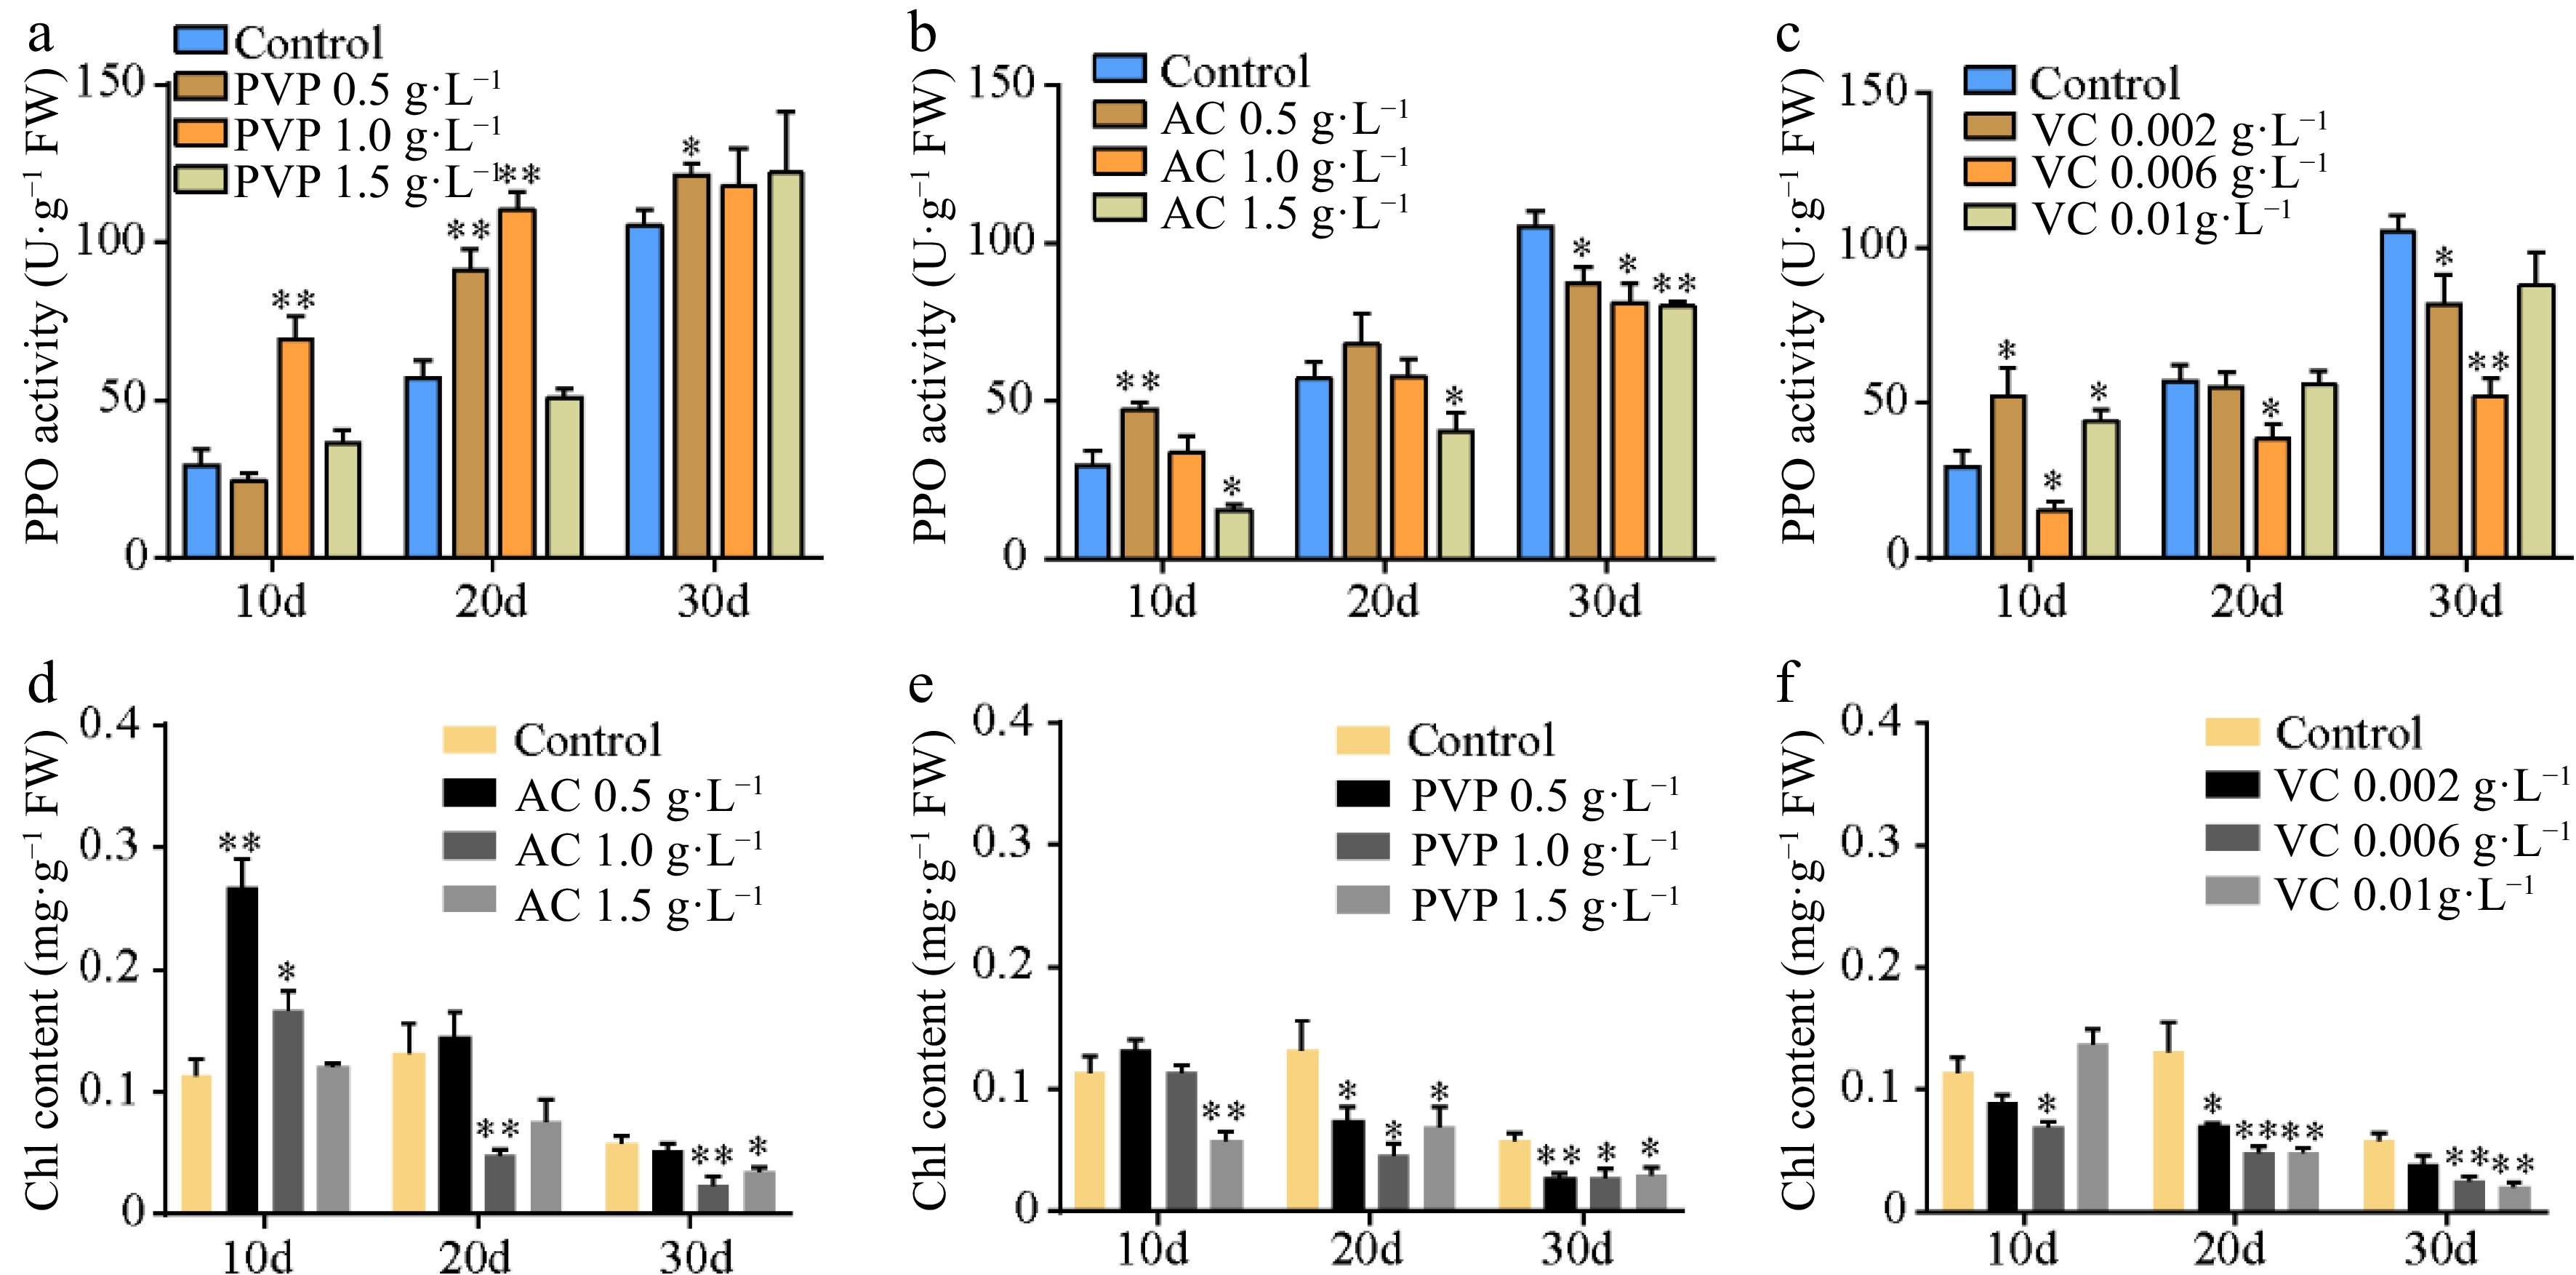
Figure 2.
Polyphenol oxidase (PPO) activity and chlorophyll contents. (a)–(c) The PPO activity and (d)–(f) chlorophyll content under different concentrations of AC, PVP, and VC treatments. Statistical significance: * p < 0.05; ** p < 0.01.
-
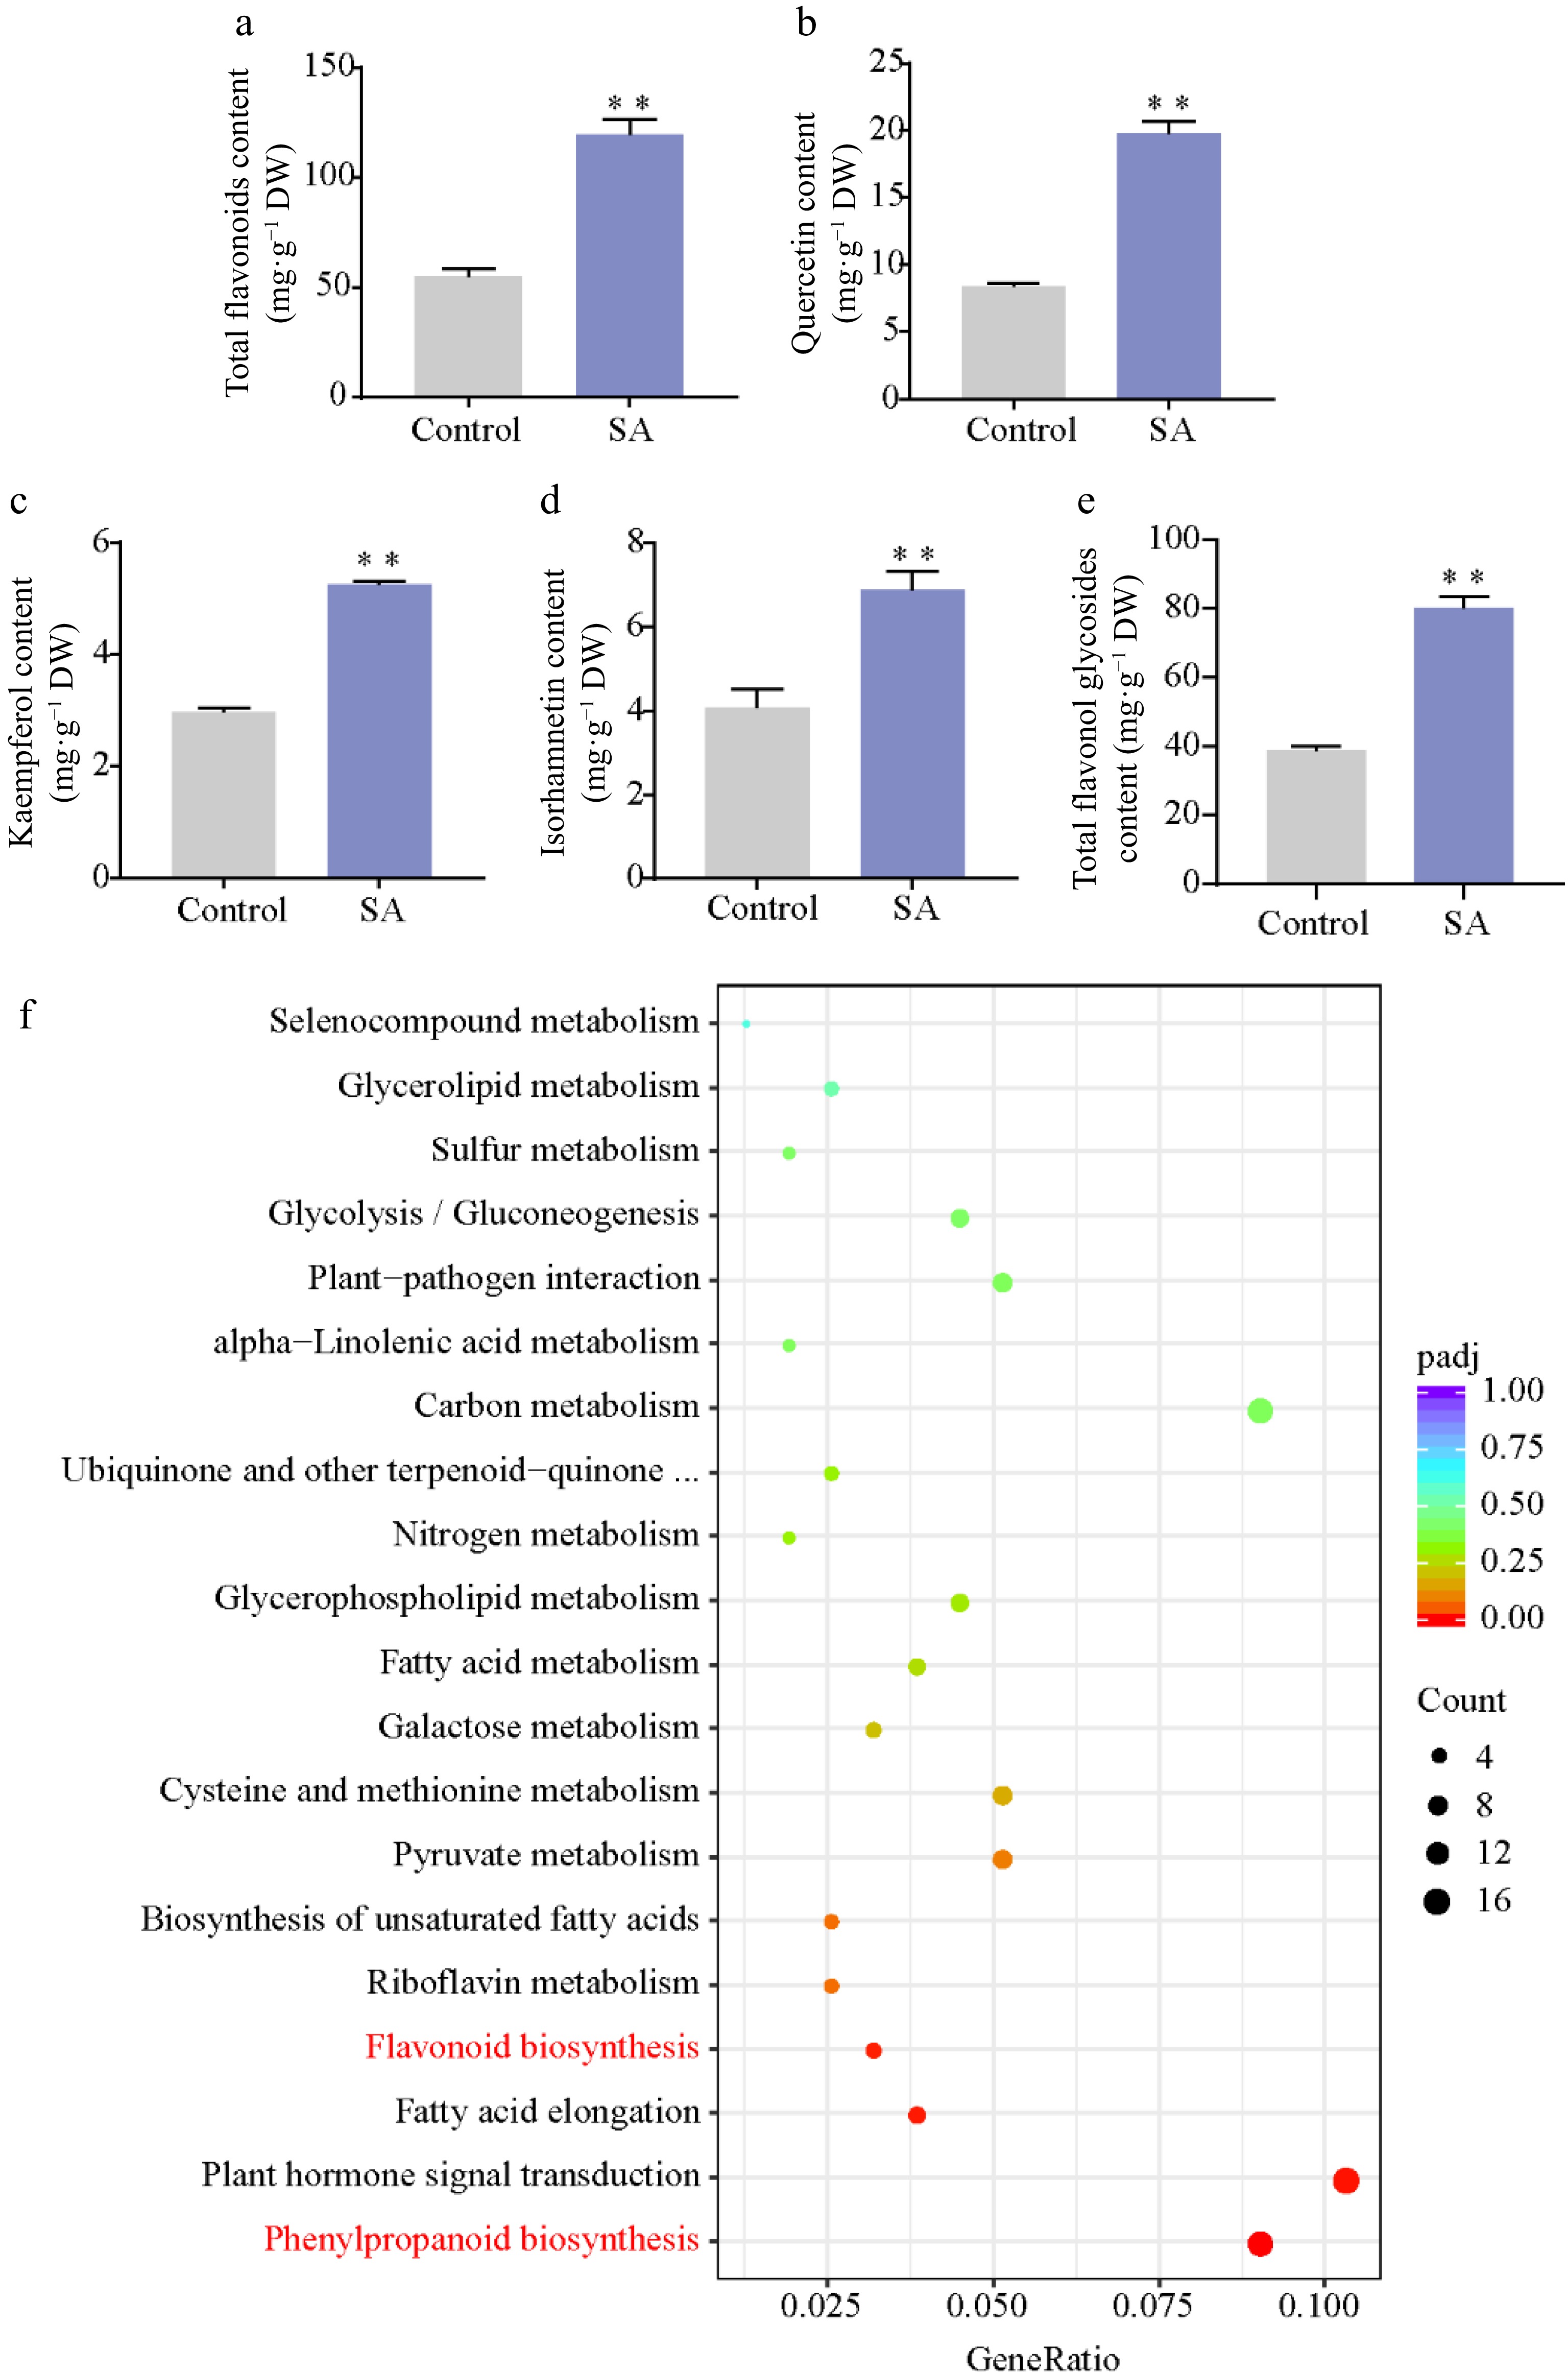
Figure 3.
Effect of SA on flavonoid content. (a) Total flavonoid content. (b)–(e) Content of flavonol in SA-treated calli and control. (f) KEGG pathway enrichment of DEGs responses to SA treatment. Statistical significance: * p < 0.05; ** p < 0.01.
-
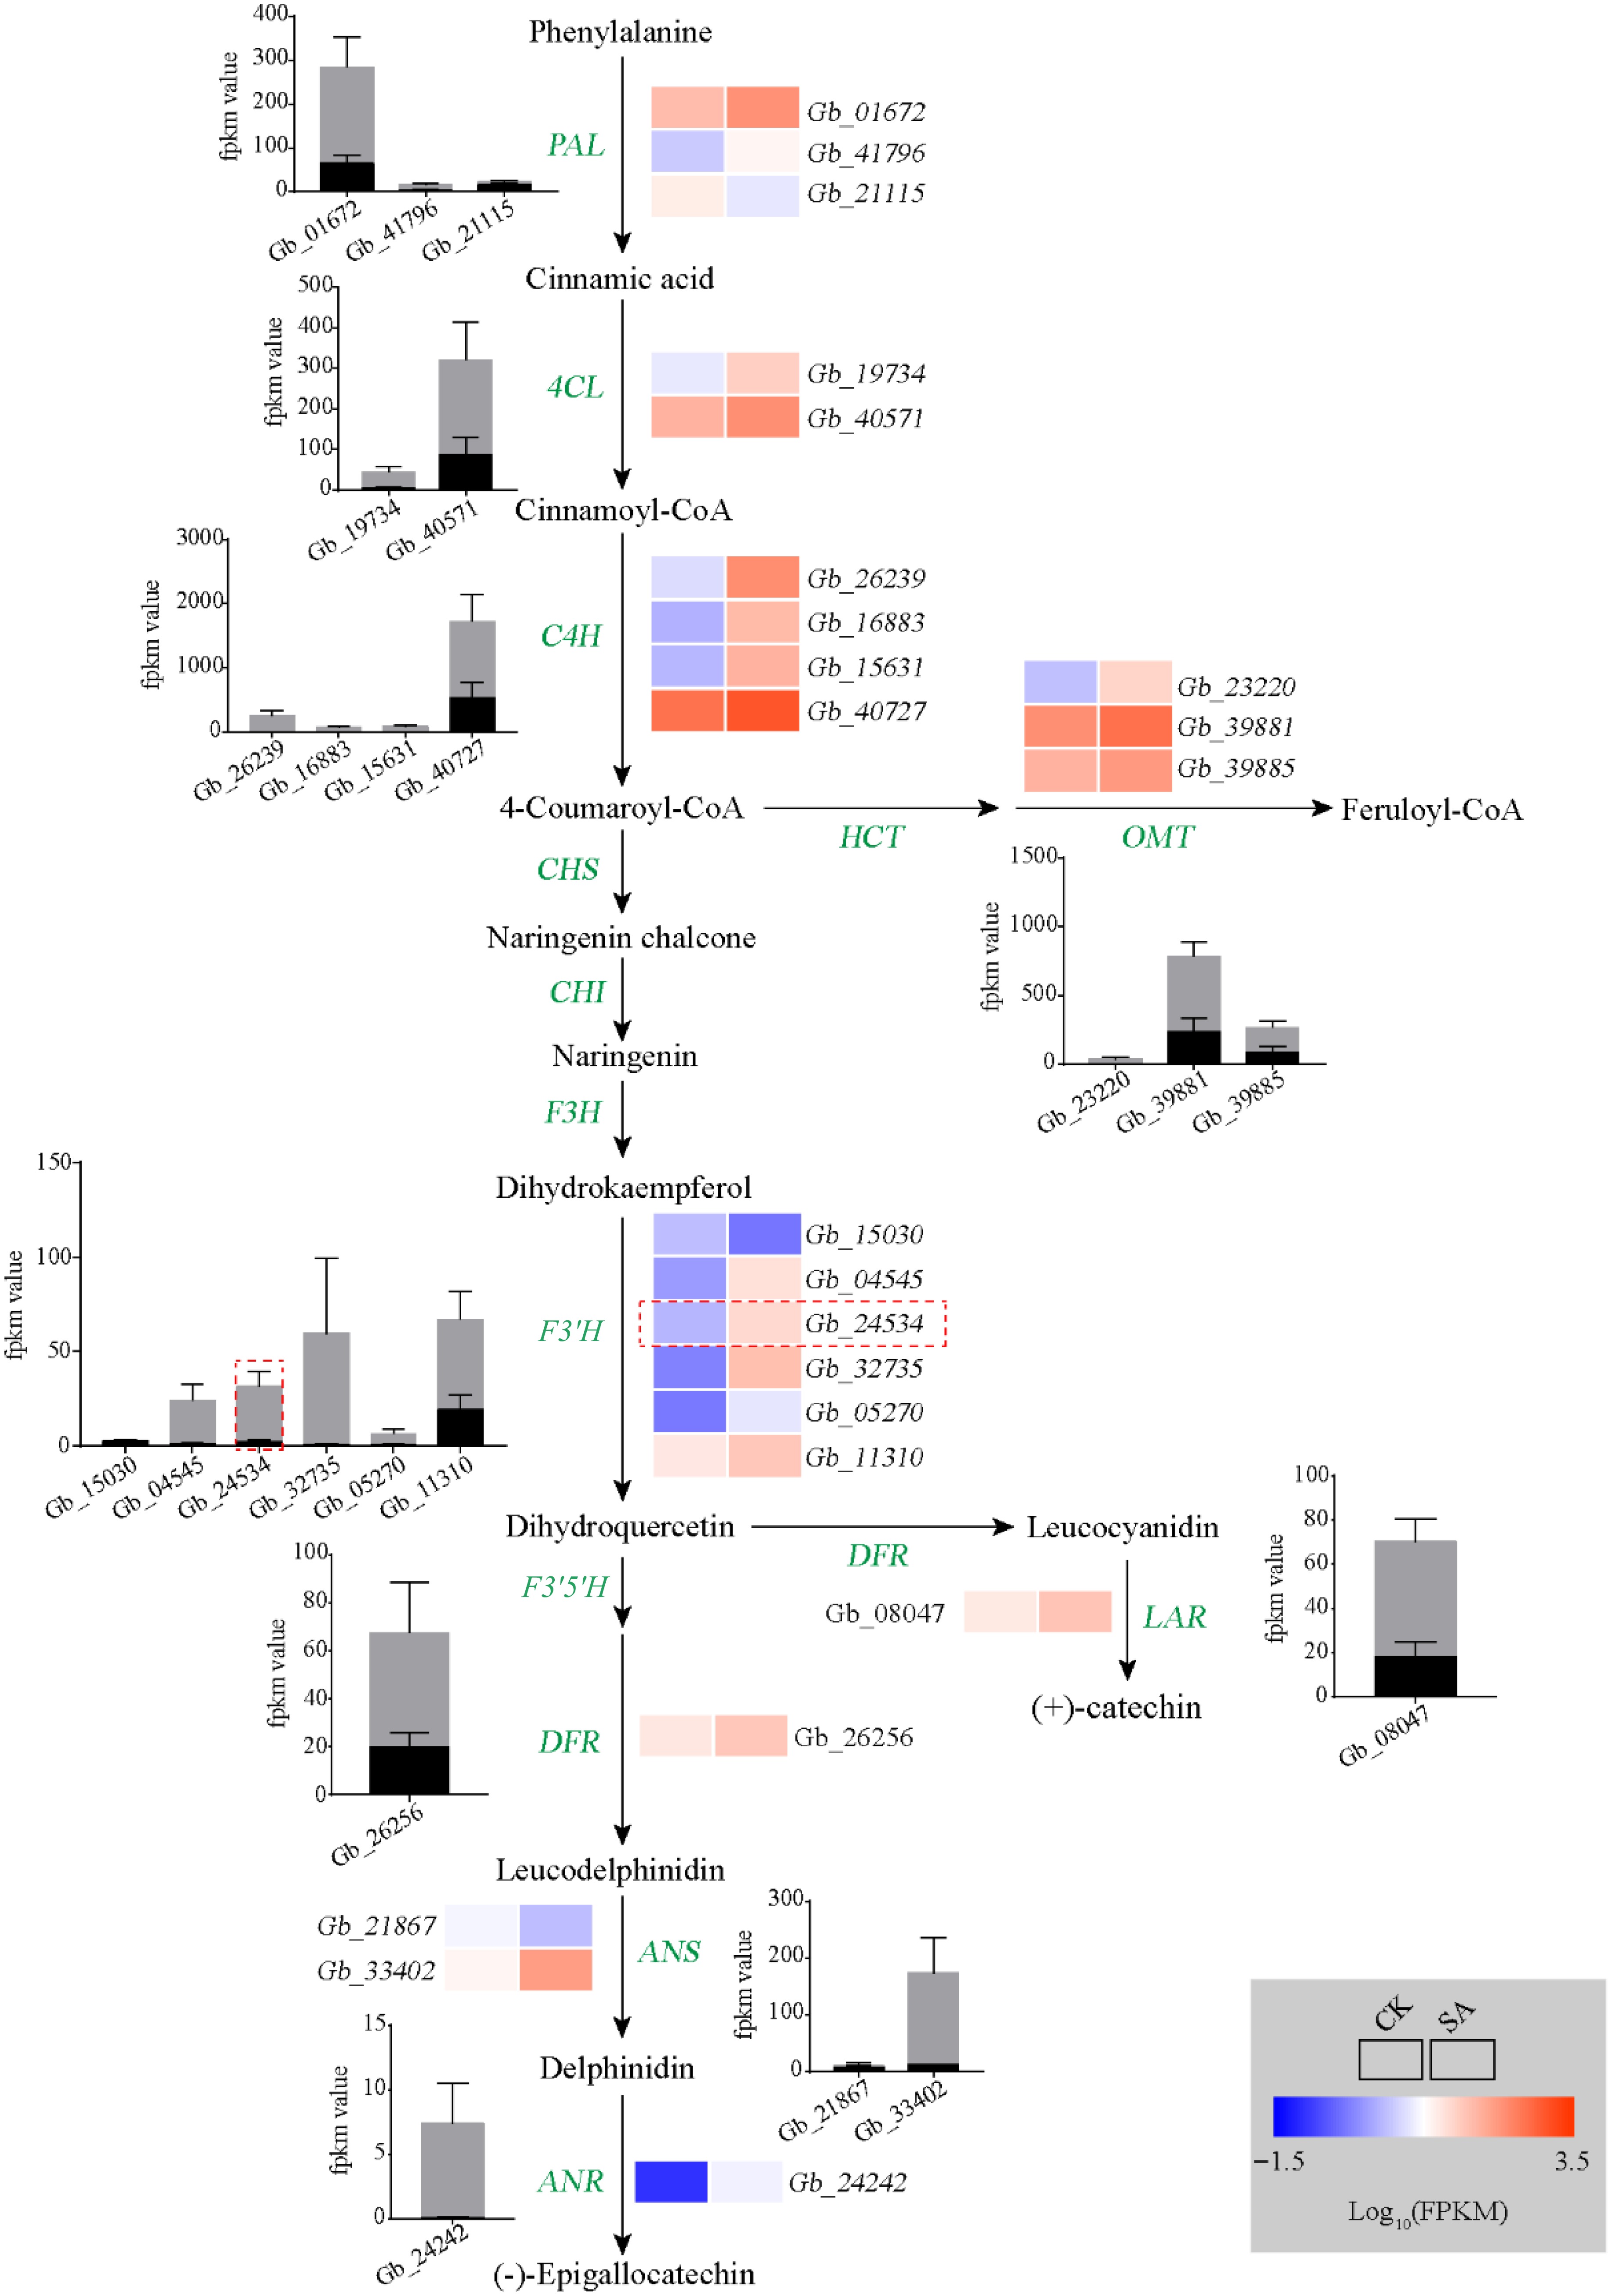
Figure 4.
Analyses of flavonoid biosynthesis pathway. Heat map showing changes in the transcripts of genes involved in flavonoid metabolism. Rectangles marked with red (upregulation) and blue (downregulation) backgrounds represent the average log10 (FPKM) value of each pathway gene according to the color scale. The black and gray columns represent average expression levels of genes in control and SA treatment samples, respectively.
-
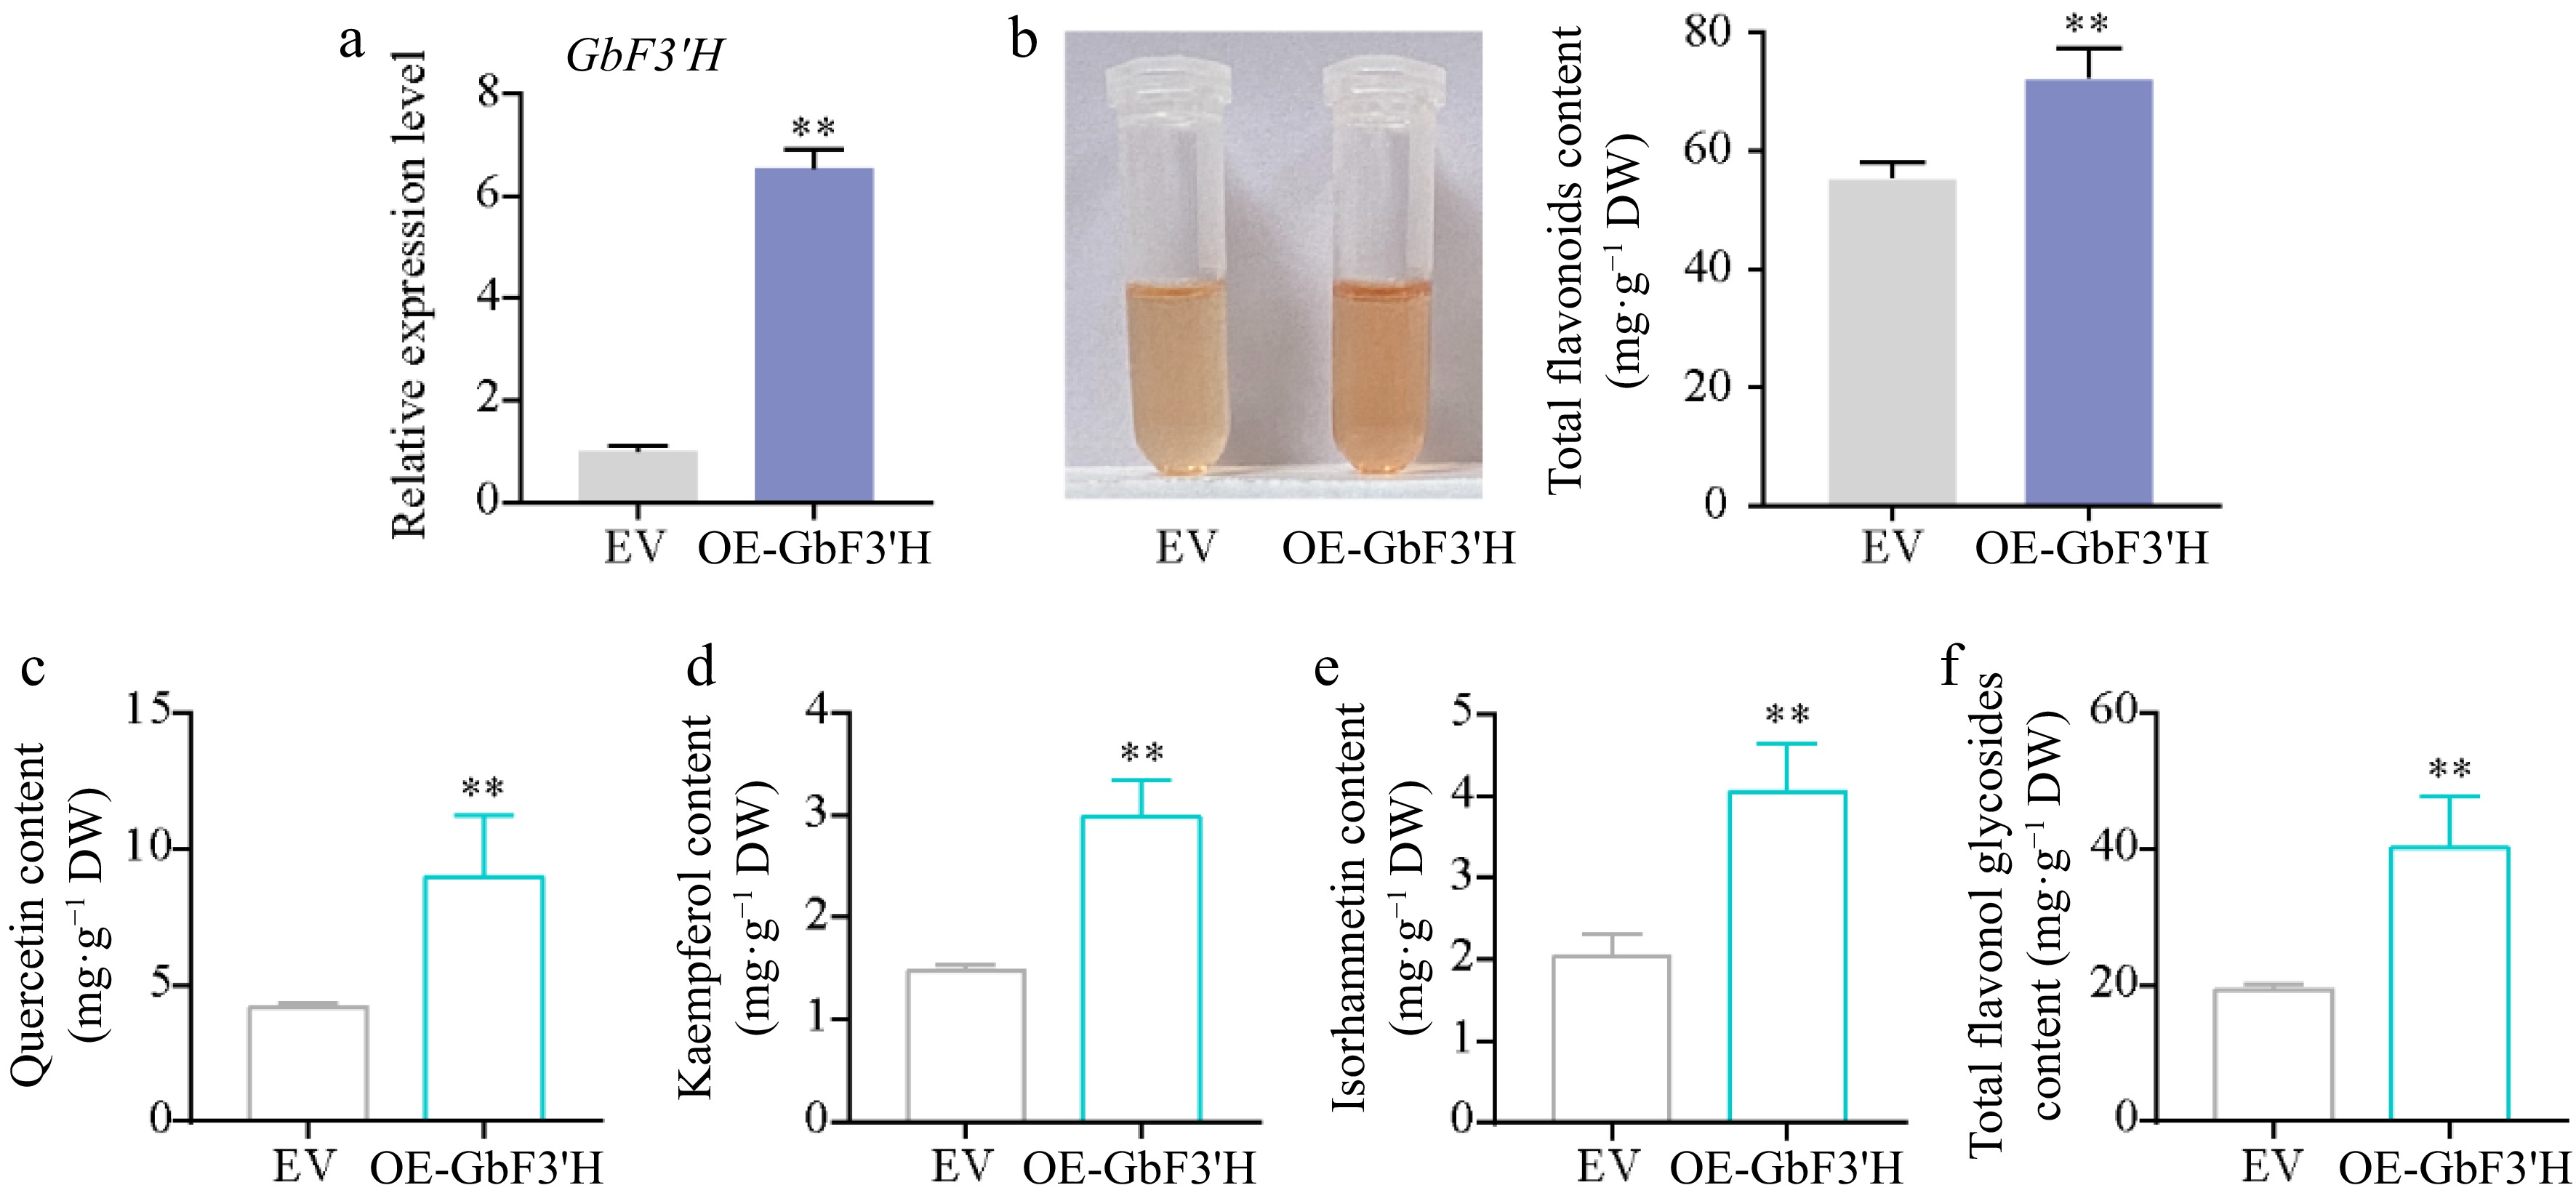
Figure 5.
Functional analysis of GbF3′H involved in flavonoid biosynthesis in ginkgo. (a) qRT-PCR confirmation of GbF3′H-overexpressing transgenic ginkgo calli. (b) Total flavonoid contents in the EV and OE-GbF3′H calli. (c)–(f) HPLC analyses of flavonol in the EV and OE-GbF3′H calli. Statistical significance: * p < 0.05; ** p < 0.01.
-
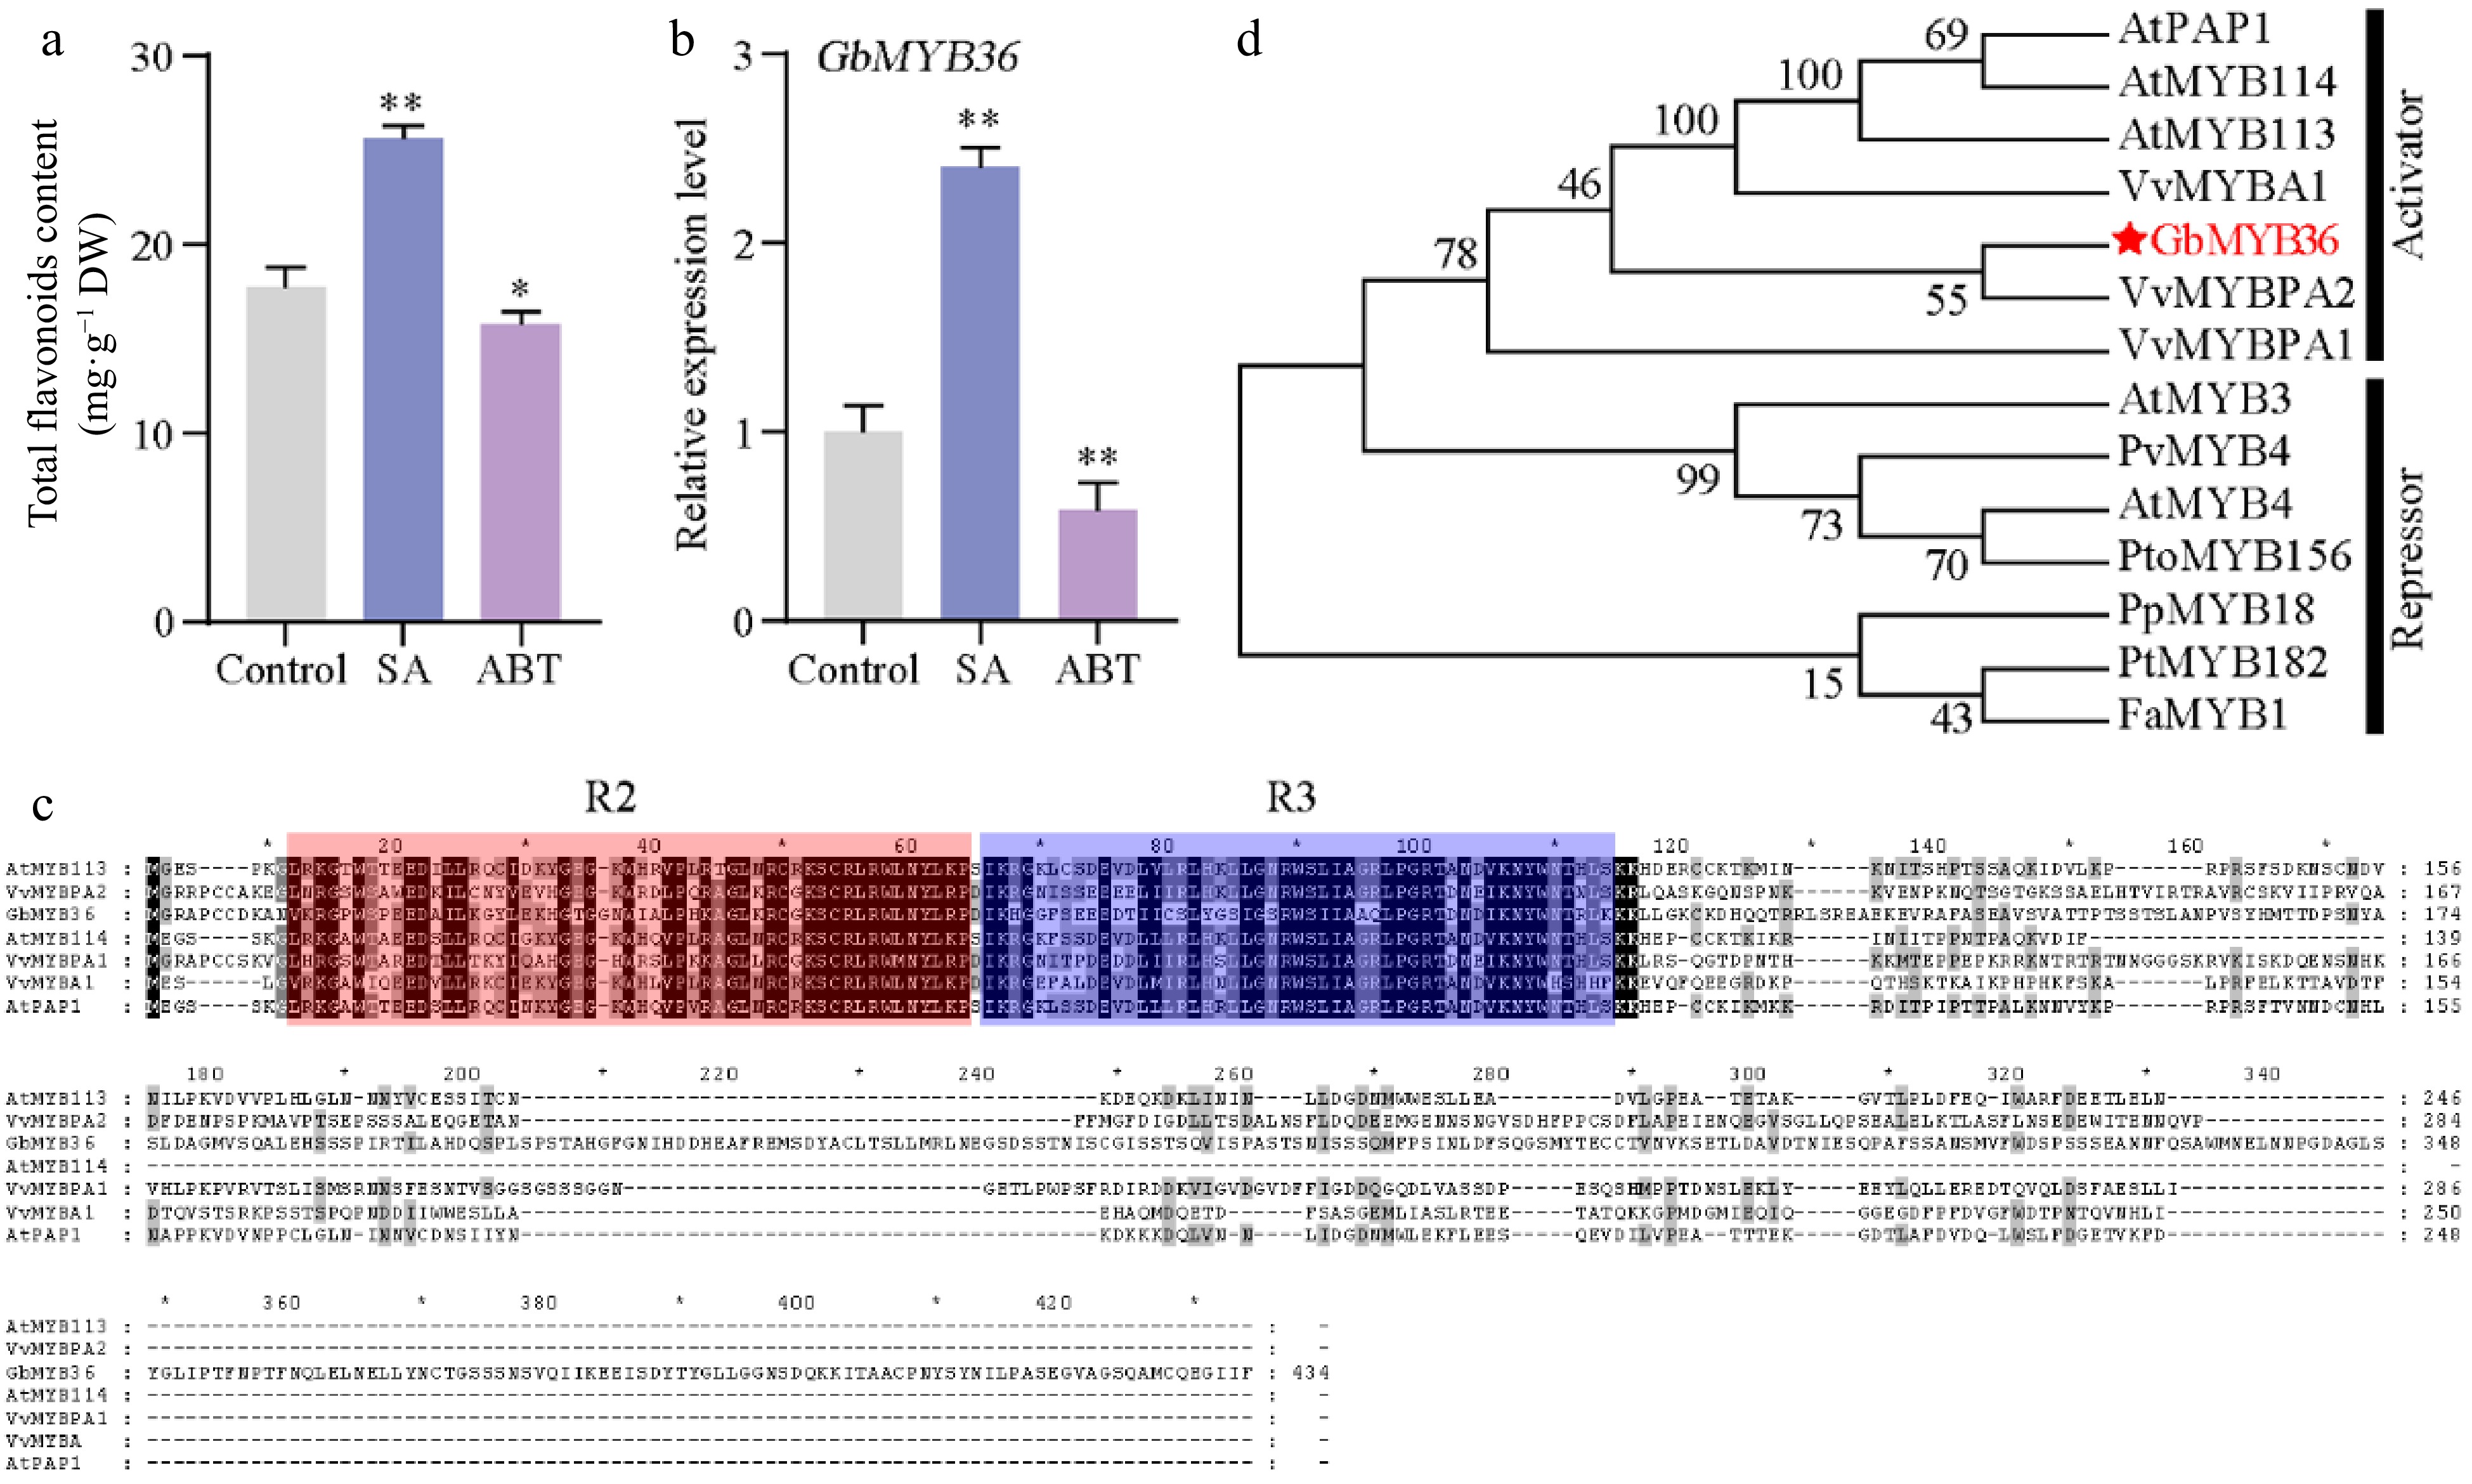
Figure 6.
The characteristics of GbMYB36 transcription factor. (a) Total flavonoid content in SA- and ABT-treated leaves. (b) GbMYB36 expression levels in SA- and ABT-treated leaves. (c) Phylogenetic analysis of the R2R3-MYBs in ginkgo and other plant species. (d) Amino acid sequence alignment of GbMYBs and other known MYB activators and repressors. The following GenBank accession numbers were used: Arabidopsis thaliana AtMYB4 (NP_195574), AtMYB3 (NP_564176), AtPAP1 (Q9FE25), AtMYB113 (Q9FNV9), AtMYB114 (Q9FNV8); Vitis vinifera VvMYBA1 (BAD18977), VvMYBPA1 (CAJ90831), VvMYBPA2 (ACK56131); Prunus persica PpMYB18 (ALO81021); Populus tremula × Populus tremuloides PtMYB182 (AJI76863); Fragaria × ananassa FaMYB1 (AAK84064); Panicum virgatum PvMYB4 (AEM17348); Populus tomentosa PtoMYB156 (AMY62793). Statistical significance: * p < 0.05; ** p < 0.01.
-
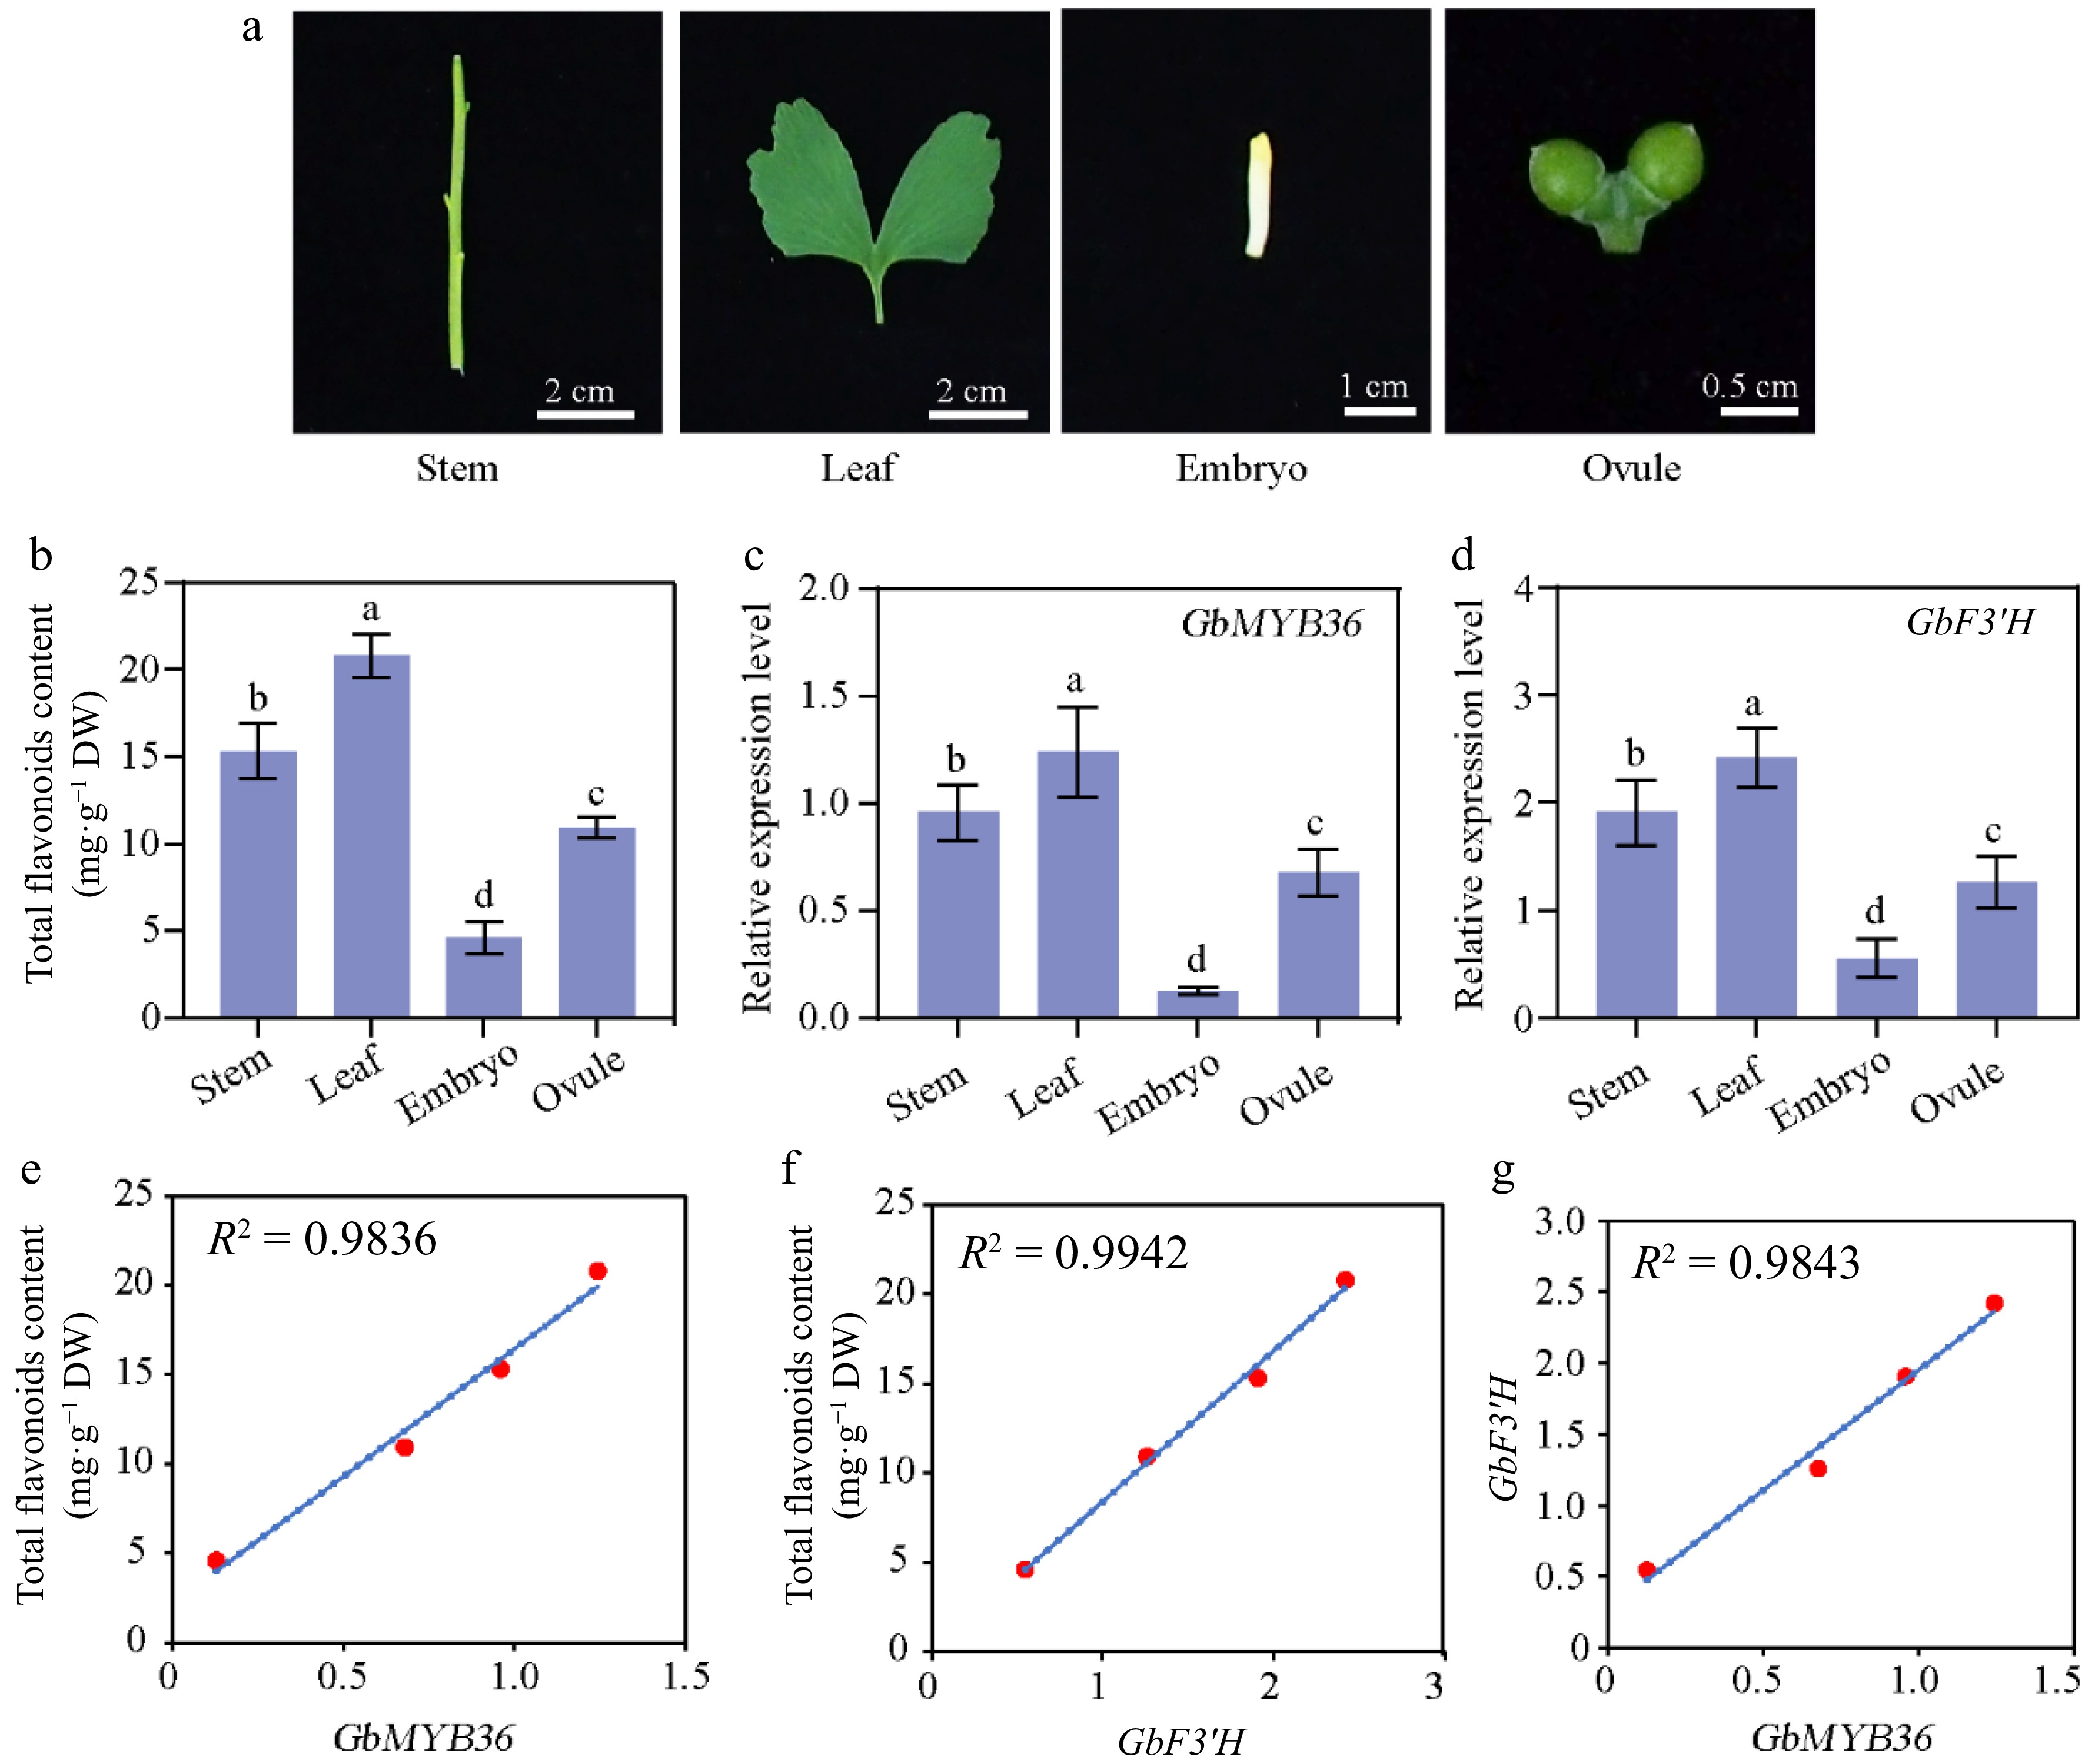
Figure 7.
Flavonoid-related gene expression and flavonoid contents in different organs of G. biloba. (a) The different organs of ginkgo include the stem, leaf, embryo, and ovule tissues. (b) Flavonoid content within different organs. The expression of (c) GbMYB36 and (d) GbF3′H genes in different organs. (e), (f) Correlation analysis of gene expression and flavonoid contents. (g) The correlation coefficient of the expression levels of GbMYB36 with GbF3′H. Different letters indicate statistically significant differences (Tukey‘s test; p < 0.05).
-
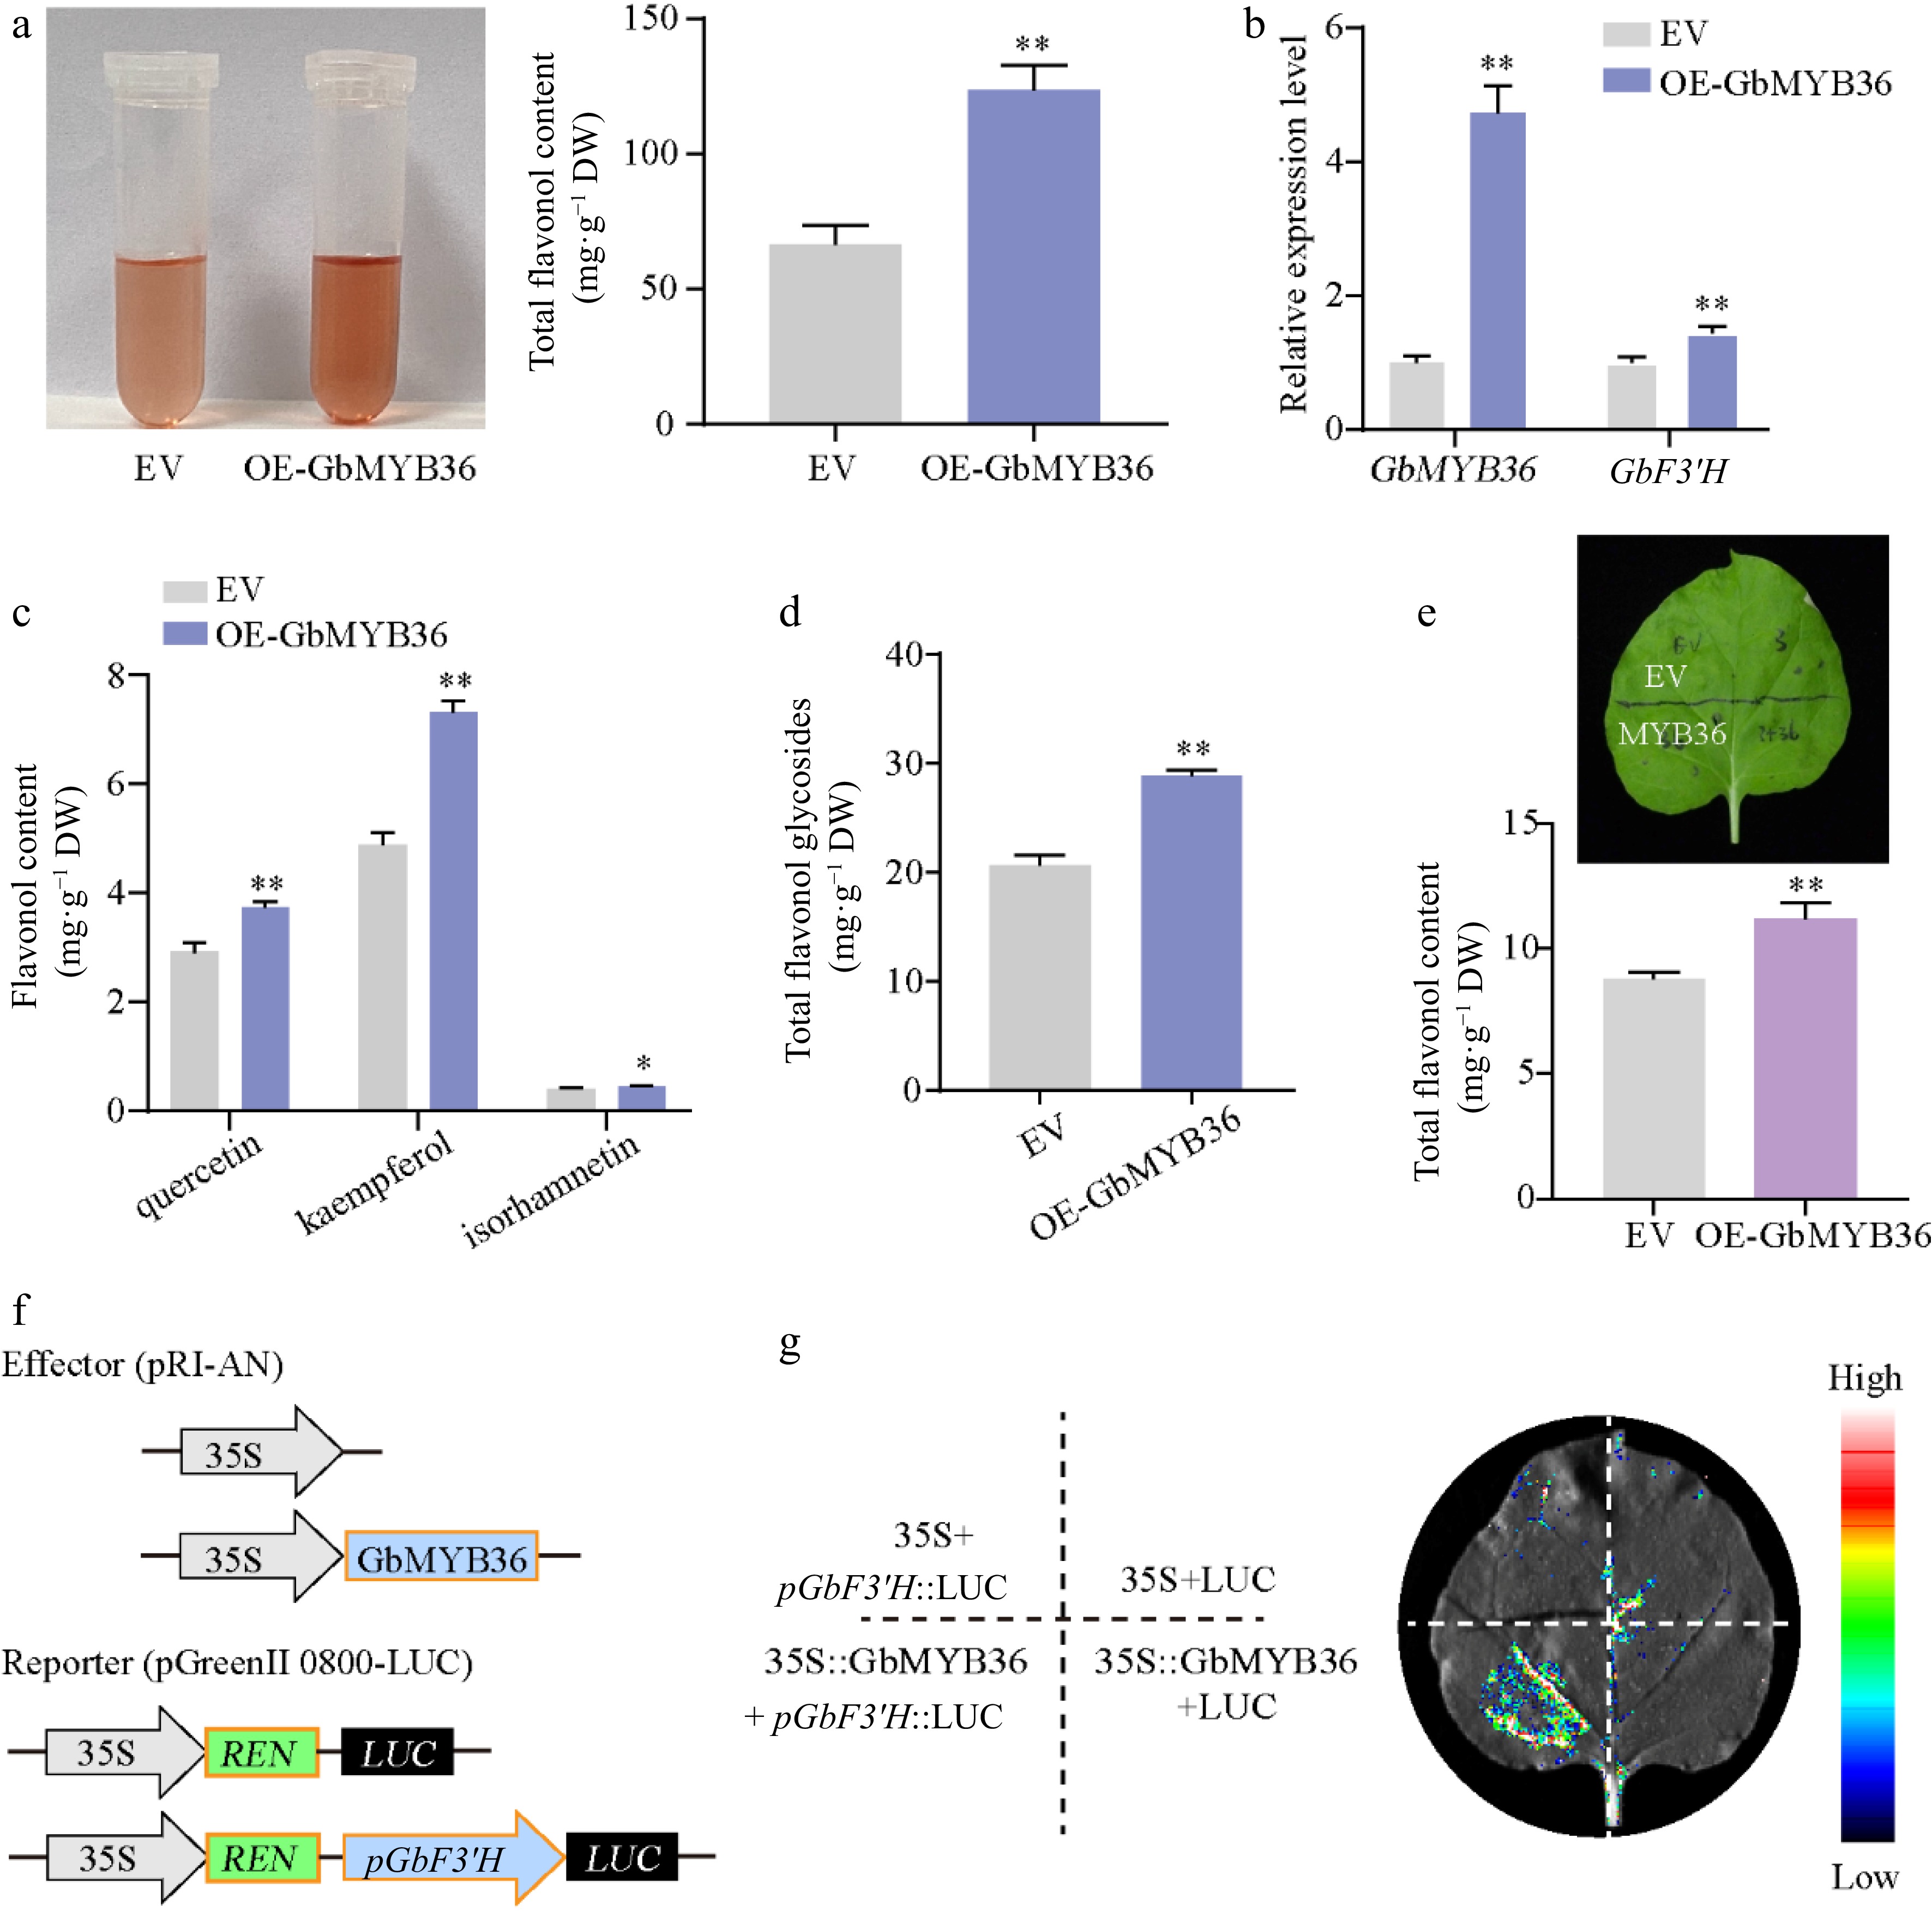
Figure 8.
Functional analysis of GbMYB36 gene. (a) Total flavonoid contents in the EV and OE-GbMYB36 calli. (b) Gene expression levels of GbMYB36 and GbF3′H in transient overexpression calli. (c), (d) HPLC analyses of flavonol in the EV and OE-GbMYB36 calli. (d) Production of flavonoids by the transient overexpression of GbMYB36 in tobacco leaves. (f) Schematic diagrams show the reporter and effector vectors used for dual luciferase reporter (DLR) assays (g) DLR assays to identify the activation of GbMYB36 on GbF3′H. Statistical significance: * p < 0.05; ** p < 0.01.
Figures
(8)
Tables
(0)