-
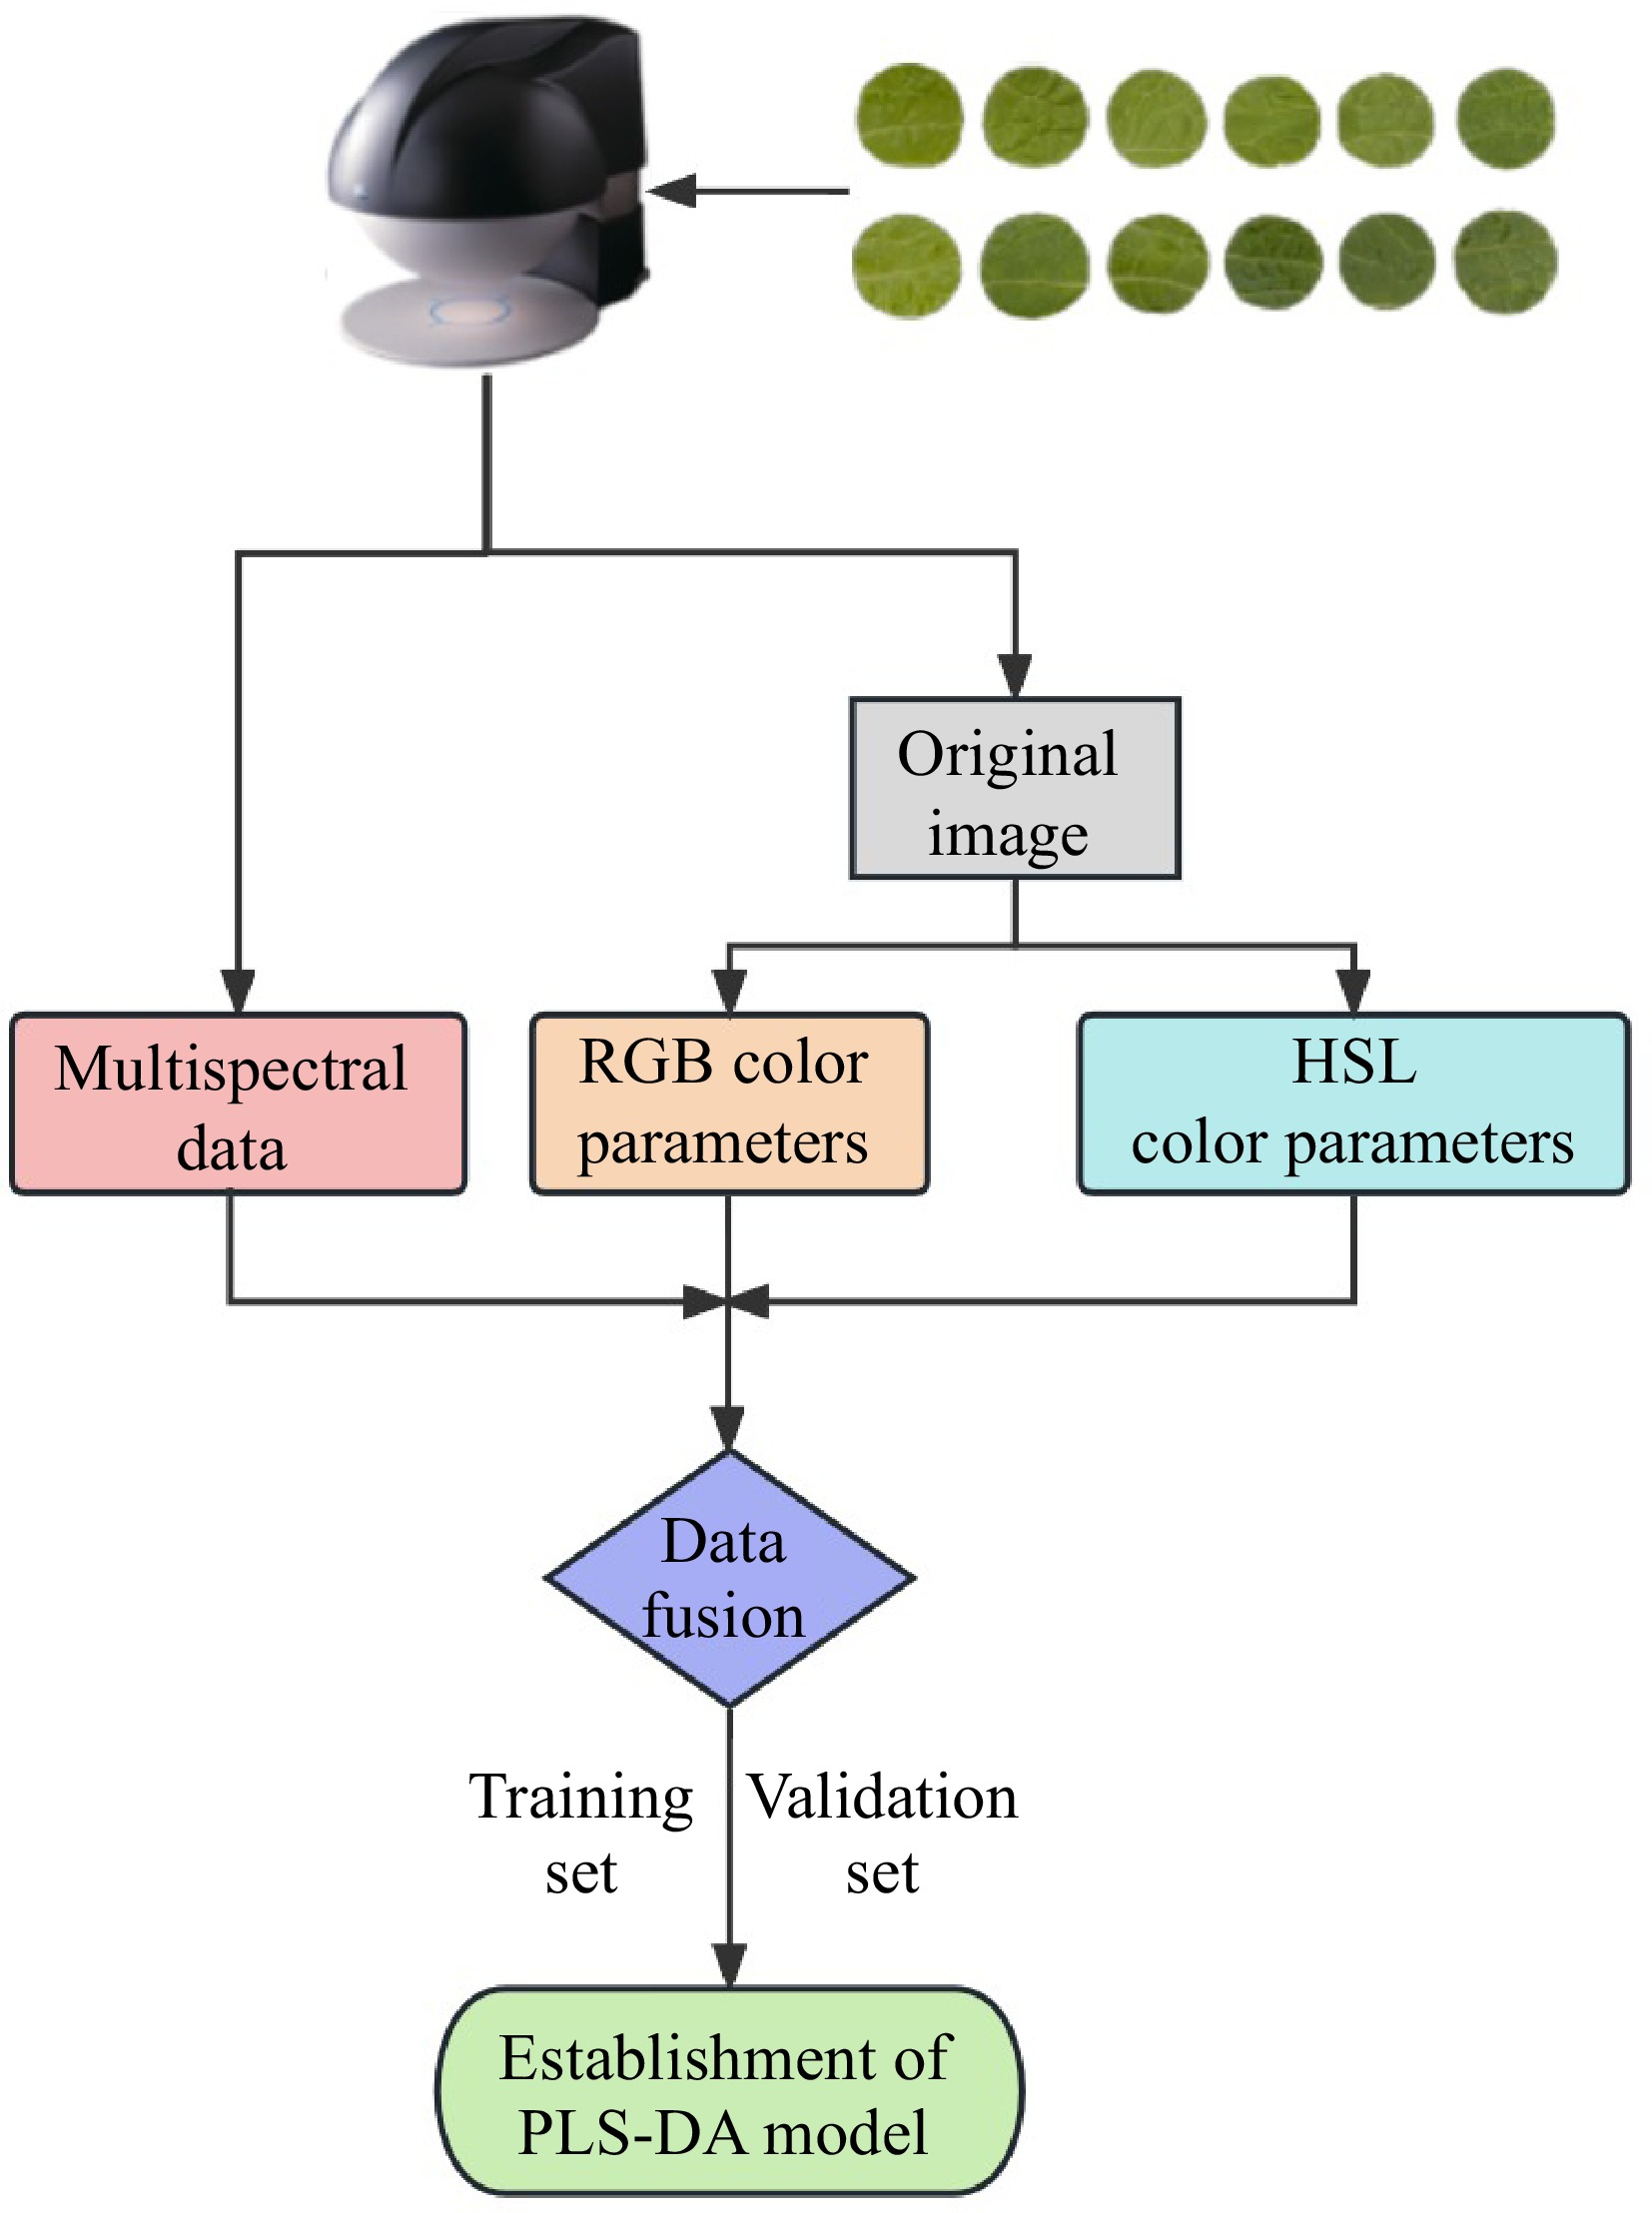
Figure 1.
Establishment of PLS-DA model for accurate identification of Chinese cabbage leaf color based on multispectral imaging.
-
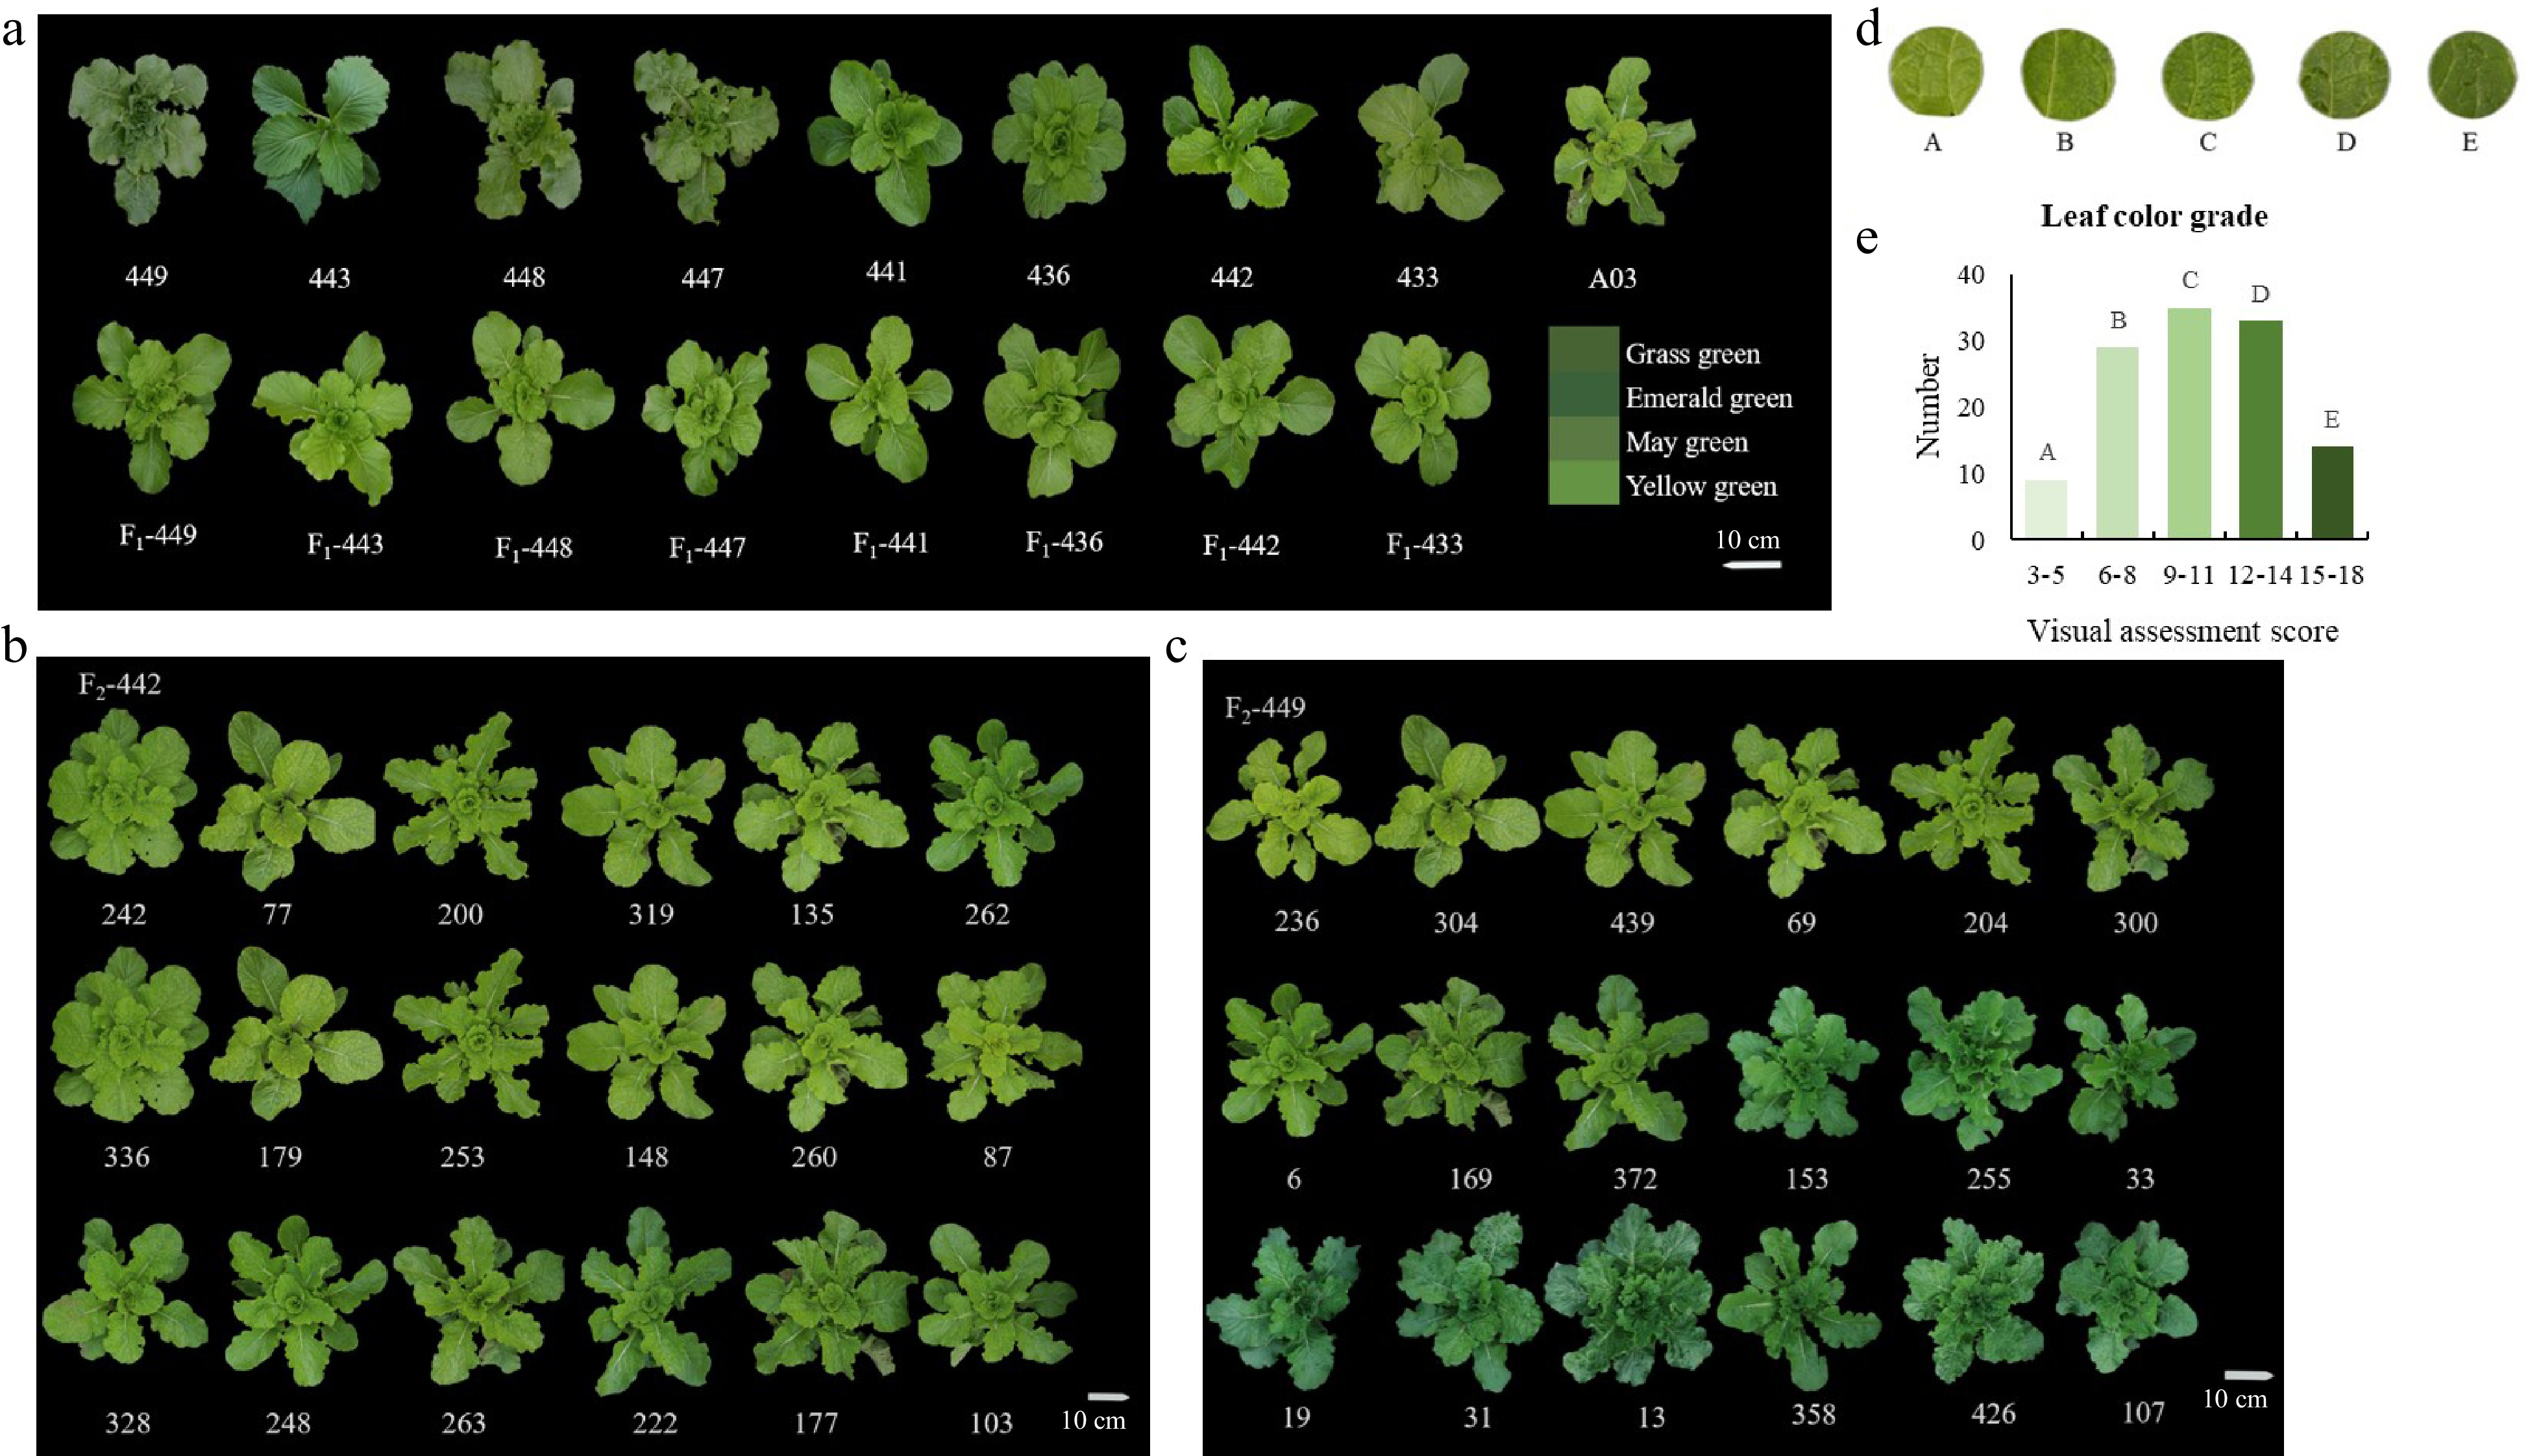
Figure 2.
Visual assessment of leaf color phenotype. (a) The leaf color phenotypes of nine homozygous high-generation inbred lines and their F1 generation. The figure references the Grass green, Emerald green, May green, and Yellow green in 'The Royal Horticultural Society's Color Chart' as color comparisons. Representative materials of (b) 'F2-442' and (c) 'F2-449' in F2 population of Chinese cabbage. (d) Visual inspection on the difference of leaf color of population. (e) Color difference classification of samples. Scale bars = 10 cm.
-
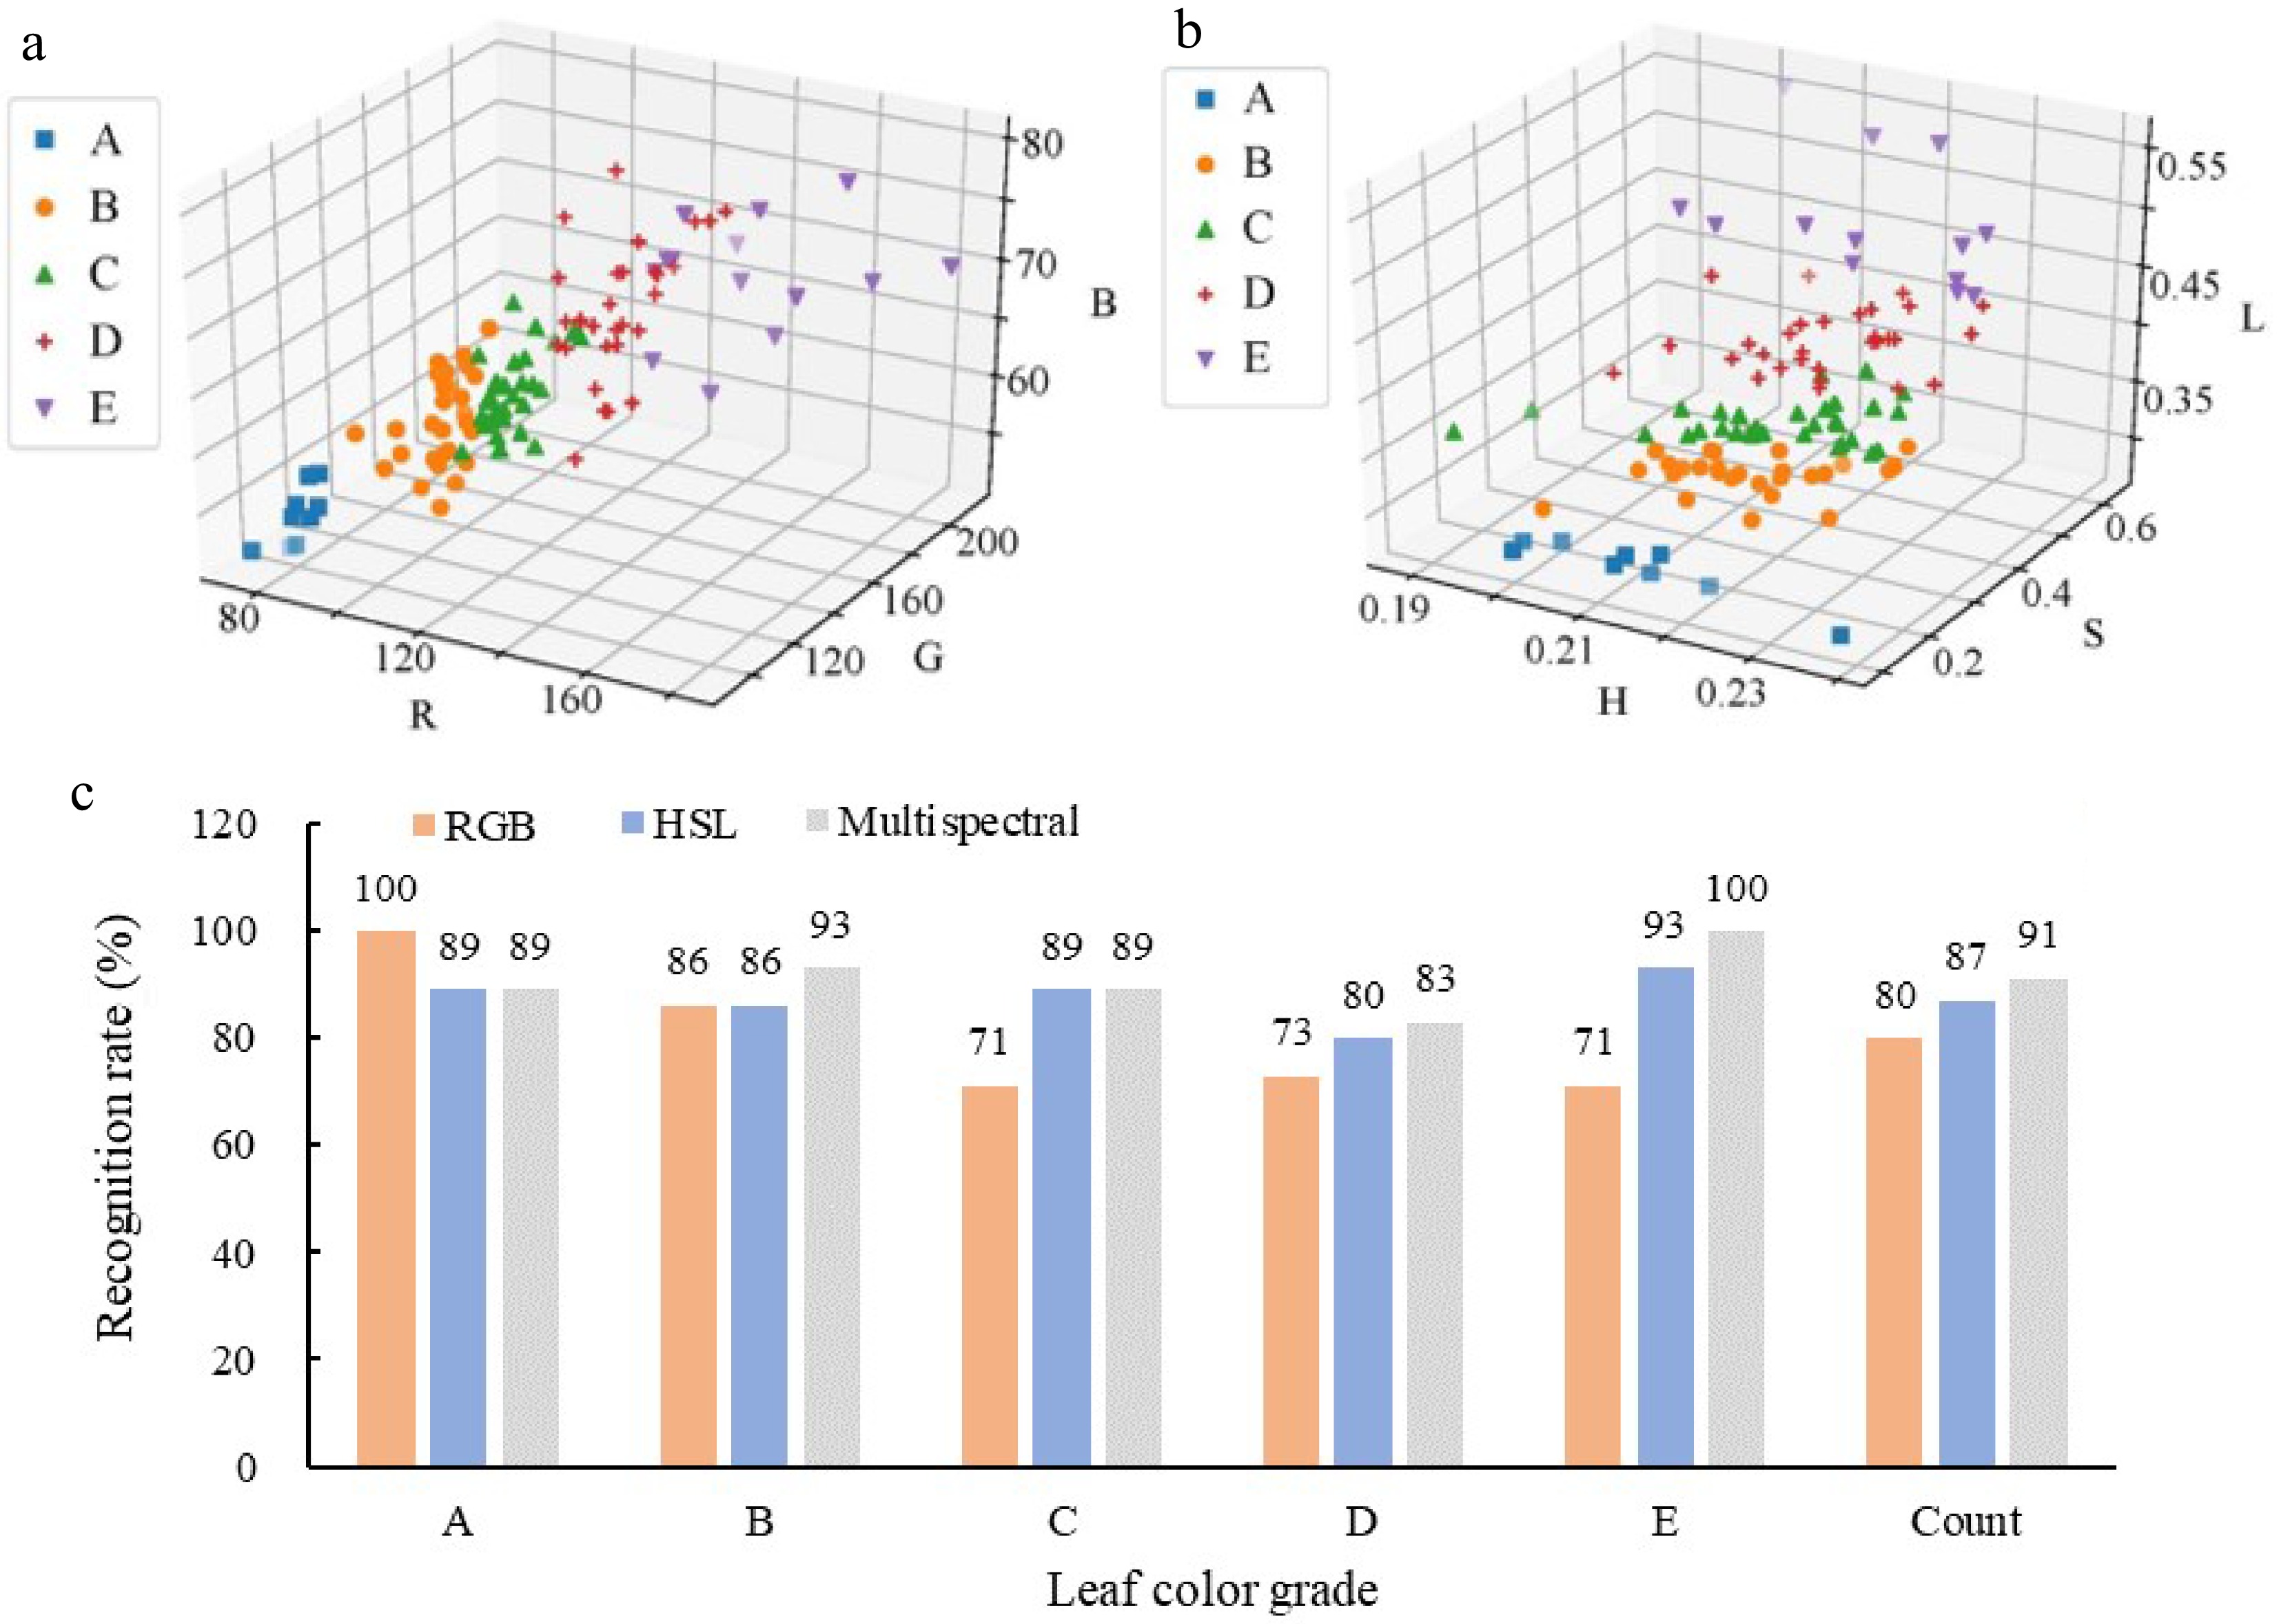
Figure 3.
Comparison of leaf color identification accuracy of Chinese cabbage based on K-means. Spatial distribution of (a) RGB parameters and (b) HSL parameter identification results. (c) K-means clustering recognition rate of RGB parameters, HSL parameters and multispectral data.
-
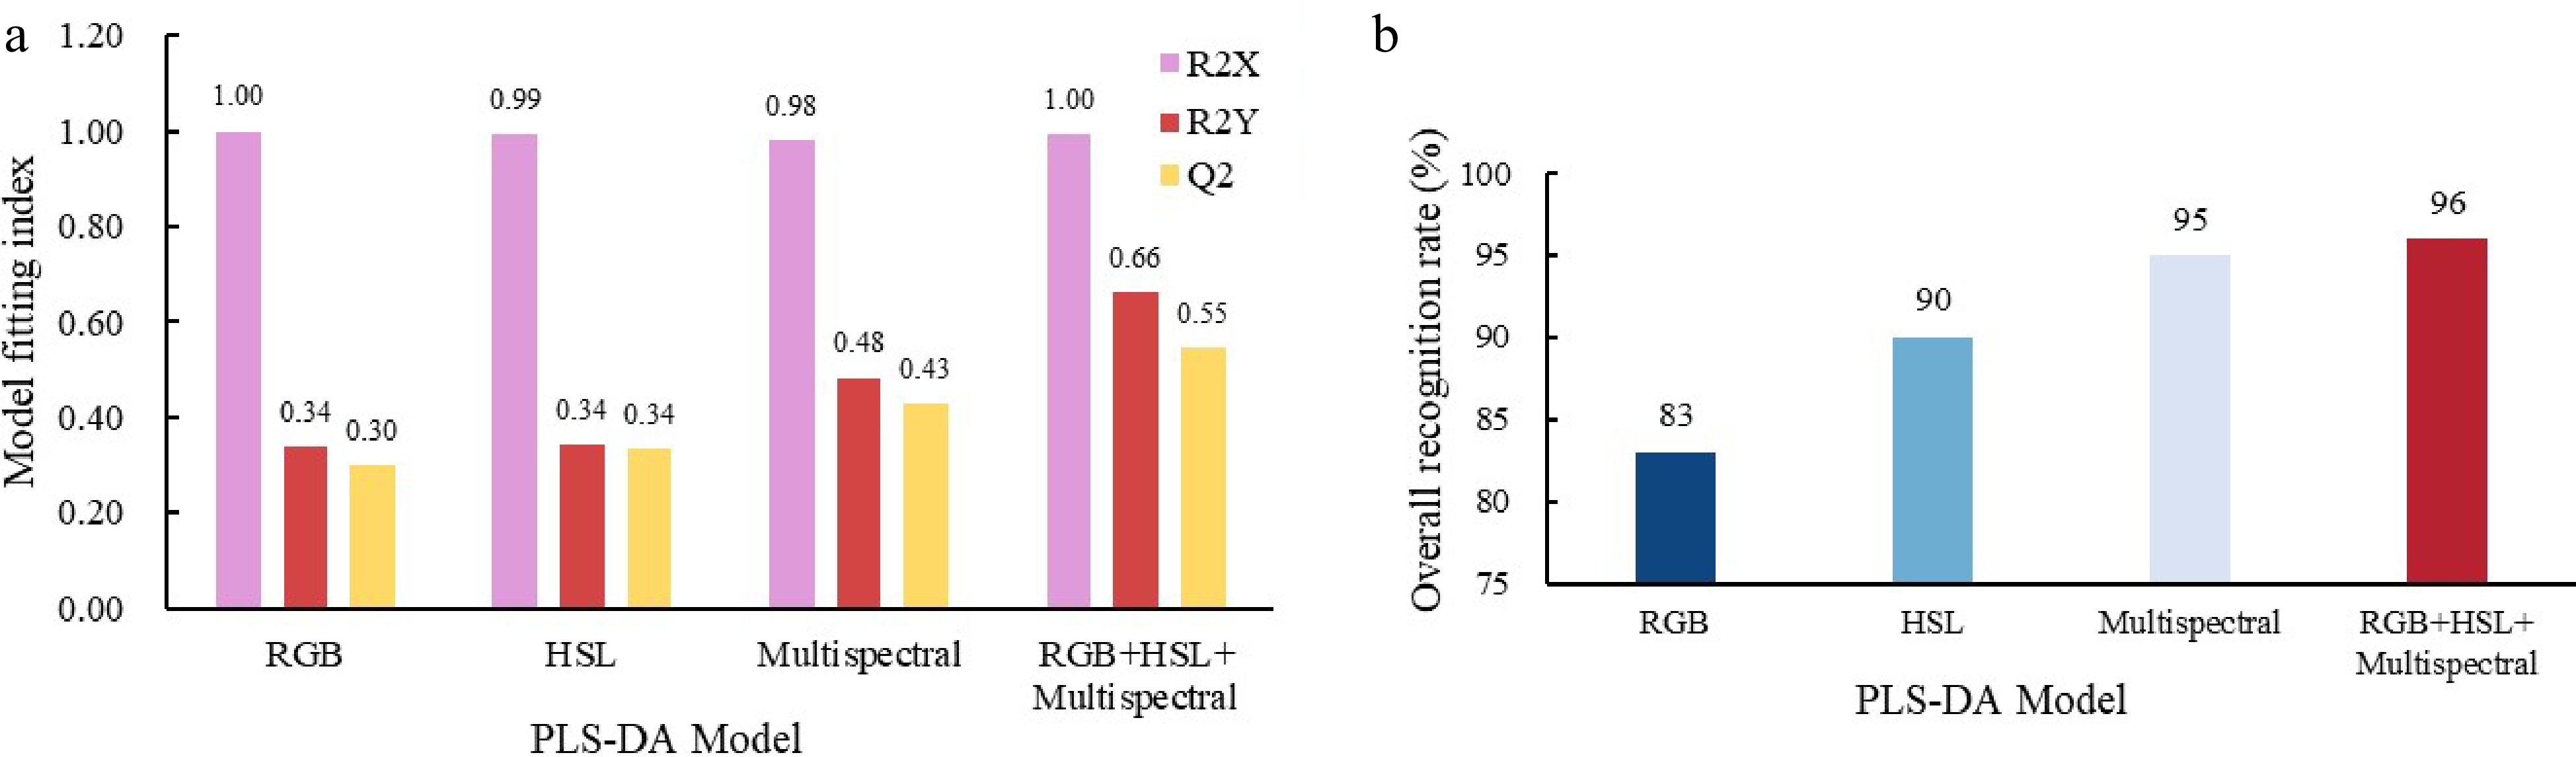
Figure 4.
PLS-DA model parameters. (a) Model fitting index for each sample type on image RGB, HSL color parameters, multispectral data and data fusion. (b) Overall recognition rate of RGB parameters, HSL parameters, multispectral data and data fusion.
-
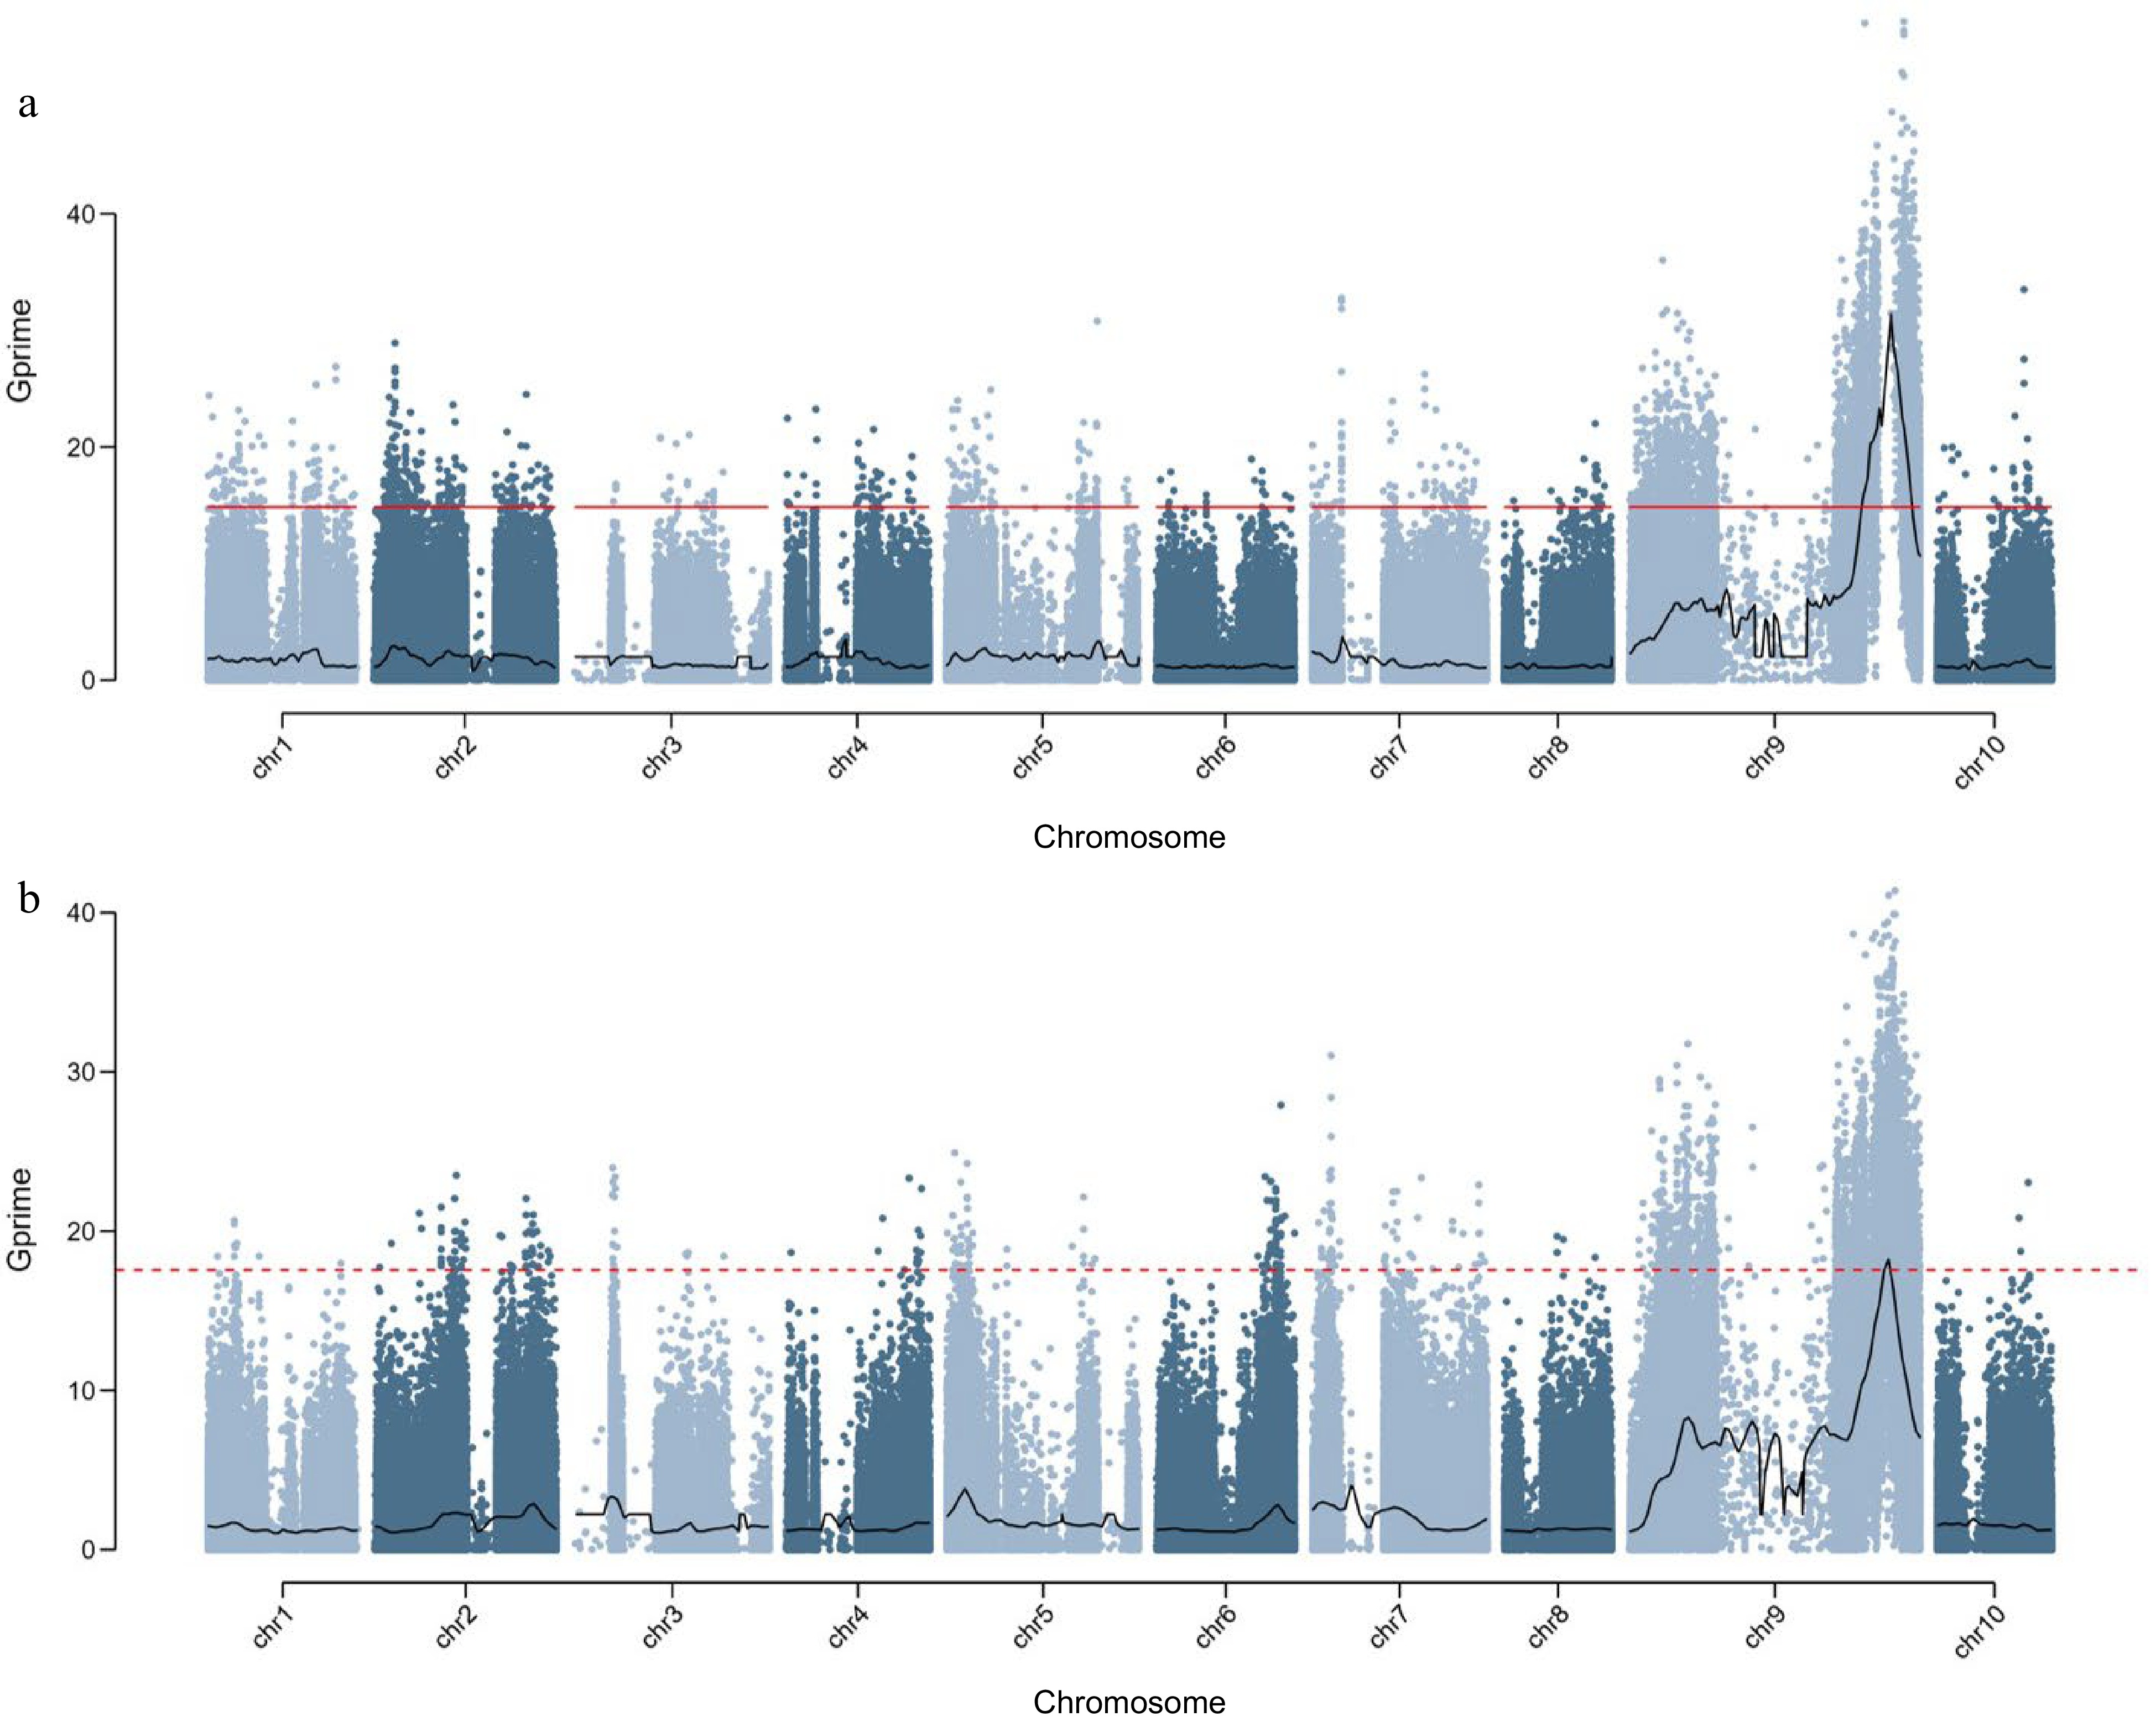
Figure 5.
Display the distribution map of SNP index on chromosomes using Gprime's computational model. The Gprime analysis results of BSA sequencing for identifying 'F2-449' population leaf color classification results based on (a) visual inspection and (b) PLS-DA fusion model (b).
-
Principal
divisorRGB HSL Multispectral RGB + HSL+ Multispectral 1 2 3 Count 1 2 Count 1 2 3 4 Count 1 2 3 4 5 6 7 Count R2X 0.897 0.094 0.008 1 0.751 0.242 0.993 0.659 0.234 0.08 0.009 0.982 0.691 0.191 0.065 0.035 0.005 0.004 0.004 0.995 R2Y 0.236 0.028 0.074 0.339 0.236 0.108 0.344 0.236 0.196 0.024 0.027 0.483 0.238 0.198 0.042 0.025 0.537 0.079 0.047 0.663 Q2 0.231 0.005 0.083 0.299 0.233 0.133 0.335 0.231 0.248 0.009 0.003 0.429 0.233 0.252 0.042 0.023 0.05 0.062 0.087 0.546 Root-mean-
square error
(RMSE)A 0.216 0.212 0.21 0.213 0.241 0.191 0.216 0.233 0.203 0.199 0.202 0.209 0.228 0.199 0.199 0.2 0.216 0.215 0.2 0.208 B 0.376 0.379 0.353 0.369 0.391 0.335 0.363 0.386 0.307 0.312 0.31 0.329 0.385 0.305 0.307 0.304 0.31 0.318 0.323 0.322 C 0.408 0.414 0.41 0.411 0.405 0.398 0.402 0.403 0.352 0.359 0.361 0.369 0.405 0.354 0.36 0.361 0.376 0.384 0.381 0.374 D 0.333 0.329 0.276 0.313 0.298 0.272 0.285 0.32 0.286 0.27 0.26 0.284 0.195 0.224 0.245 0.236 0.245 0.277 0.32 0.249 E 0.39 0.381 0.385 0.385 0.389 0.39 0.39 0.387 0.351 0.248 0.347 0.333 0.388 0.355 0.343 0.334 0.348 0.333 0.307 0.344 Table 1.
Accuracy of PLS-DA model based on image RGB color parameters, HSL color parameters, multispectral data, and data fusion.
-
Leaf color recognition method Chromosome Position SNV number Manual visual inspection Chr 9 49732120-60494964 3450 Data fusion-based PLS-DA leaf color identification Chr 9 53002792-53999899 1539 Table 2.
Candidate region statistics.
Figures
(5)
Tables
(2)