-
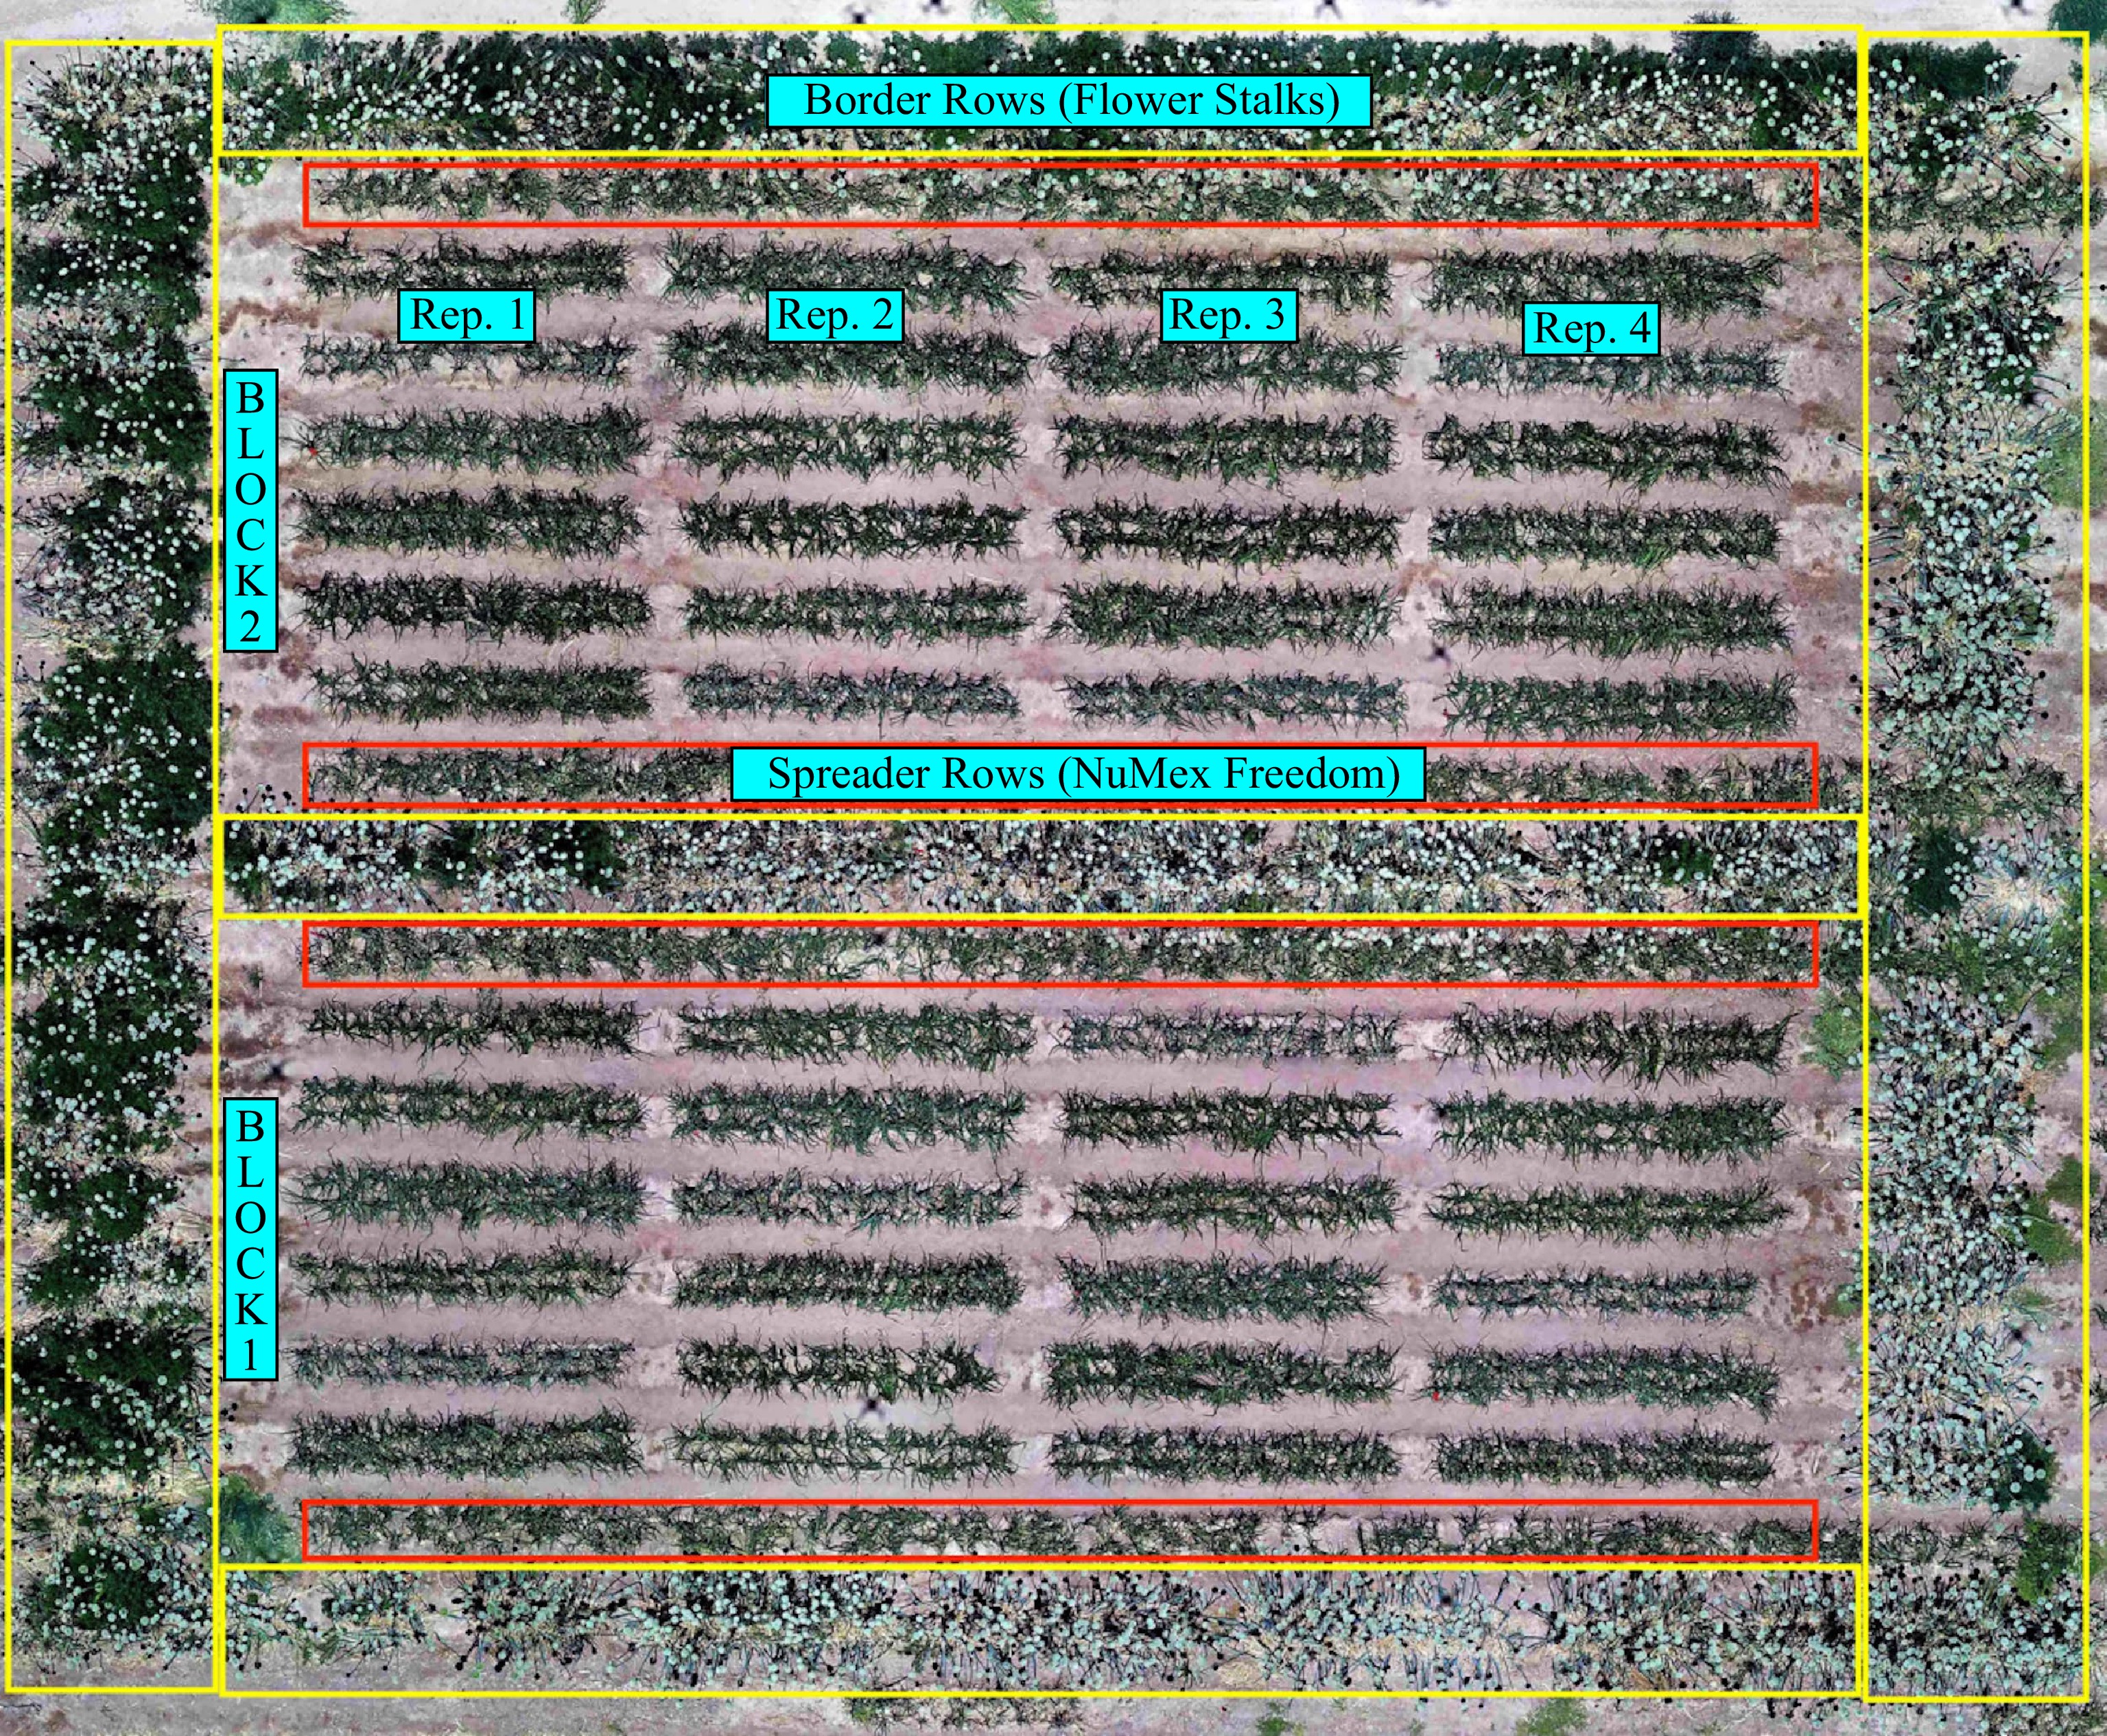
Figure 1.
Field layout to ensure an effective spread of thrips and to induce sufficient IYS disease pressure. Yellow borders represent the border rows planted with the onion bulbs infected with viruliferous thrips saved from the previous year and red borders refer to the spreader rows next to the border rows. Each block contains four replications of the test entries.
-
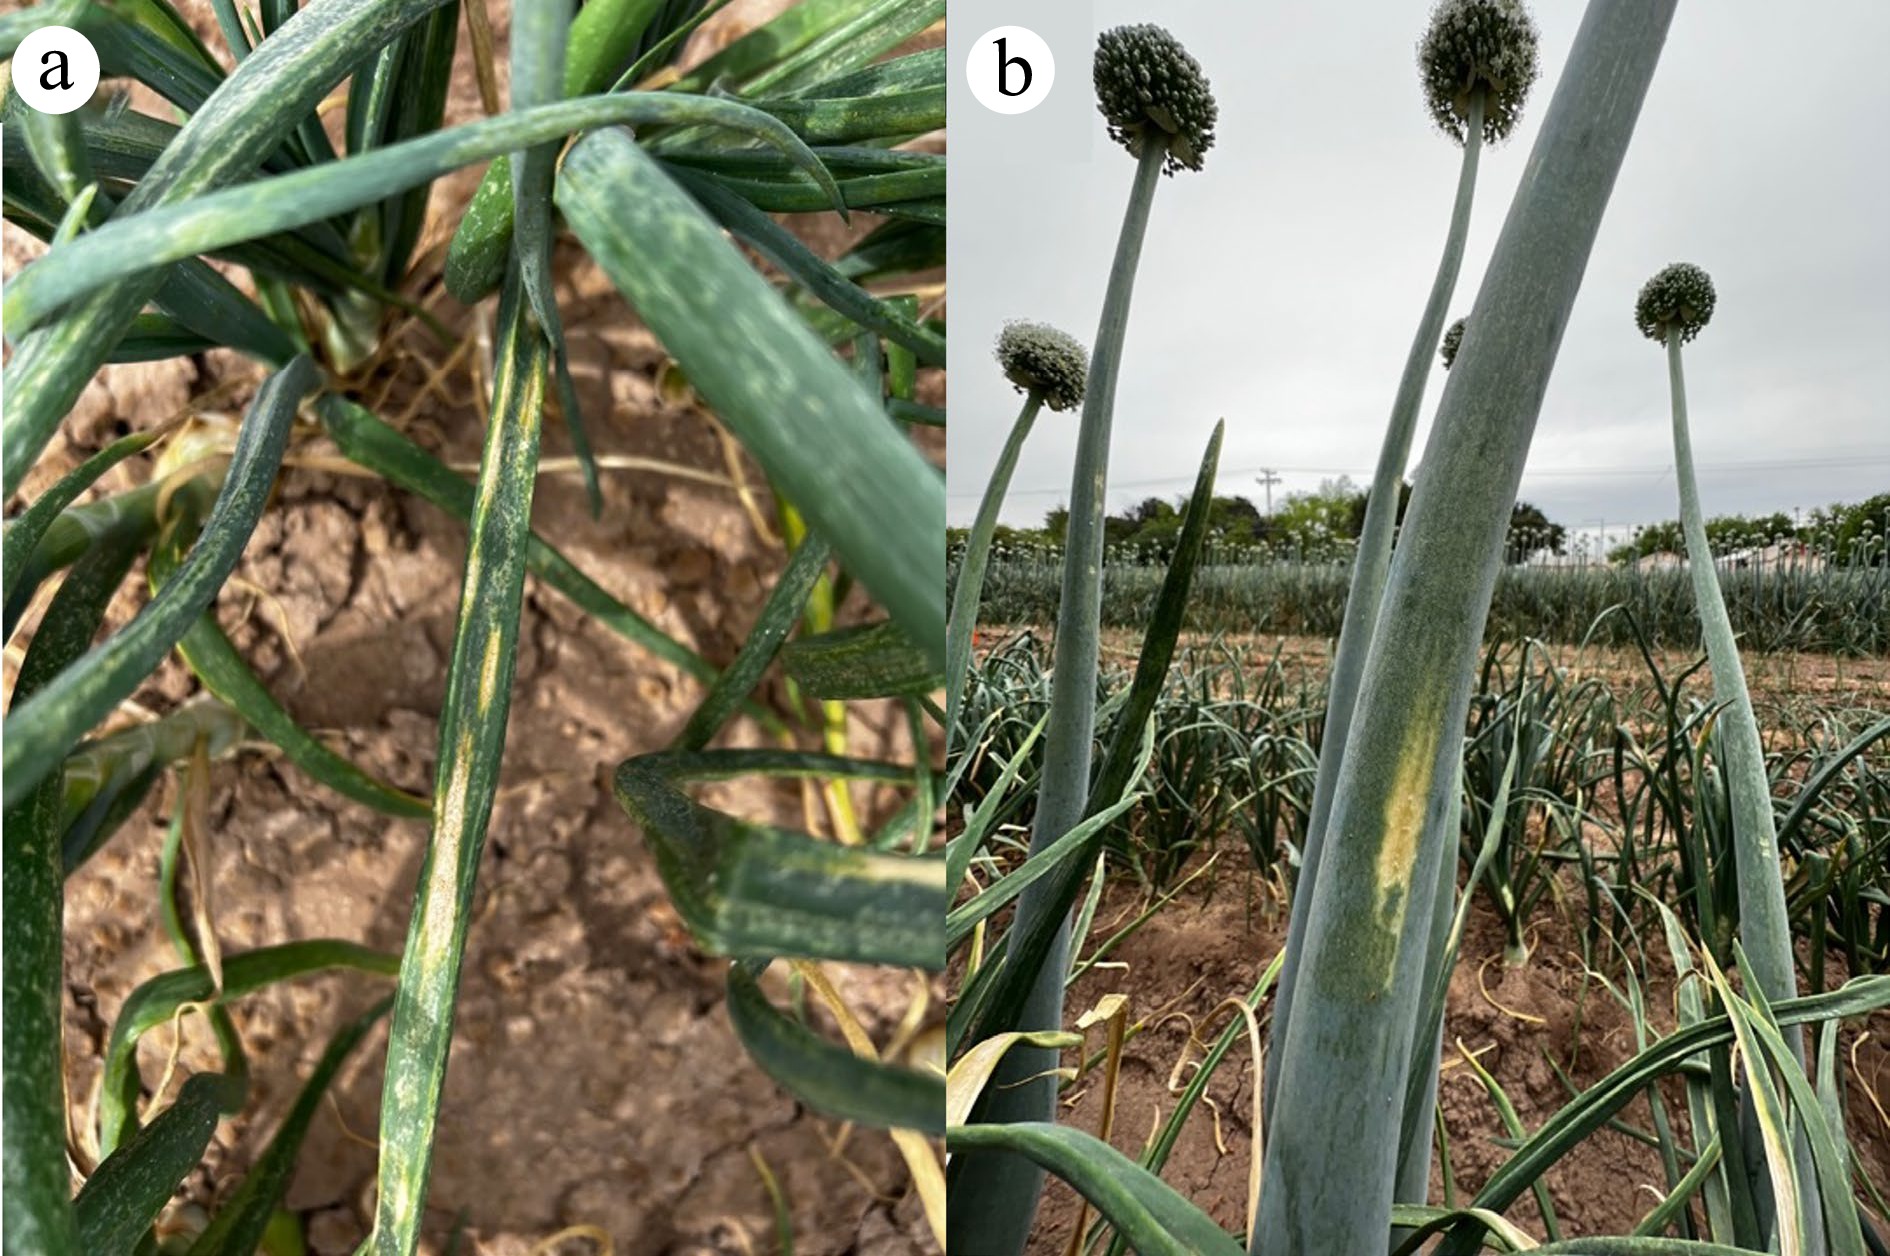
Figure 2.
Iris yellow spot (IYS) symptoms, (a) on leaves of plants in the spreader rows, and (b) on flower stalks in the border rows.
-
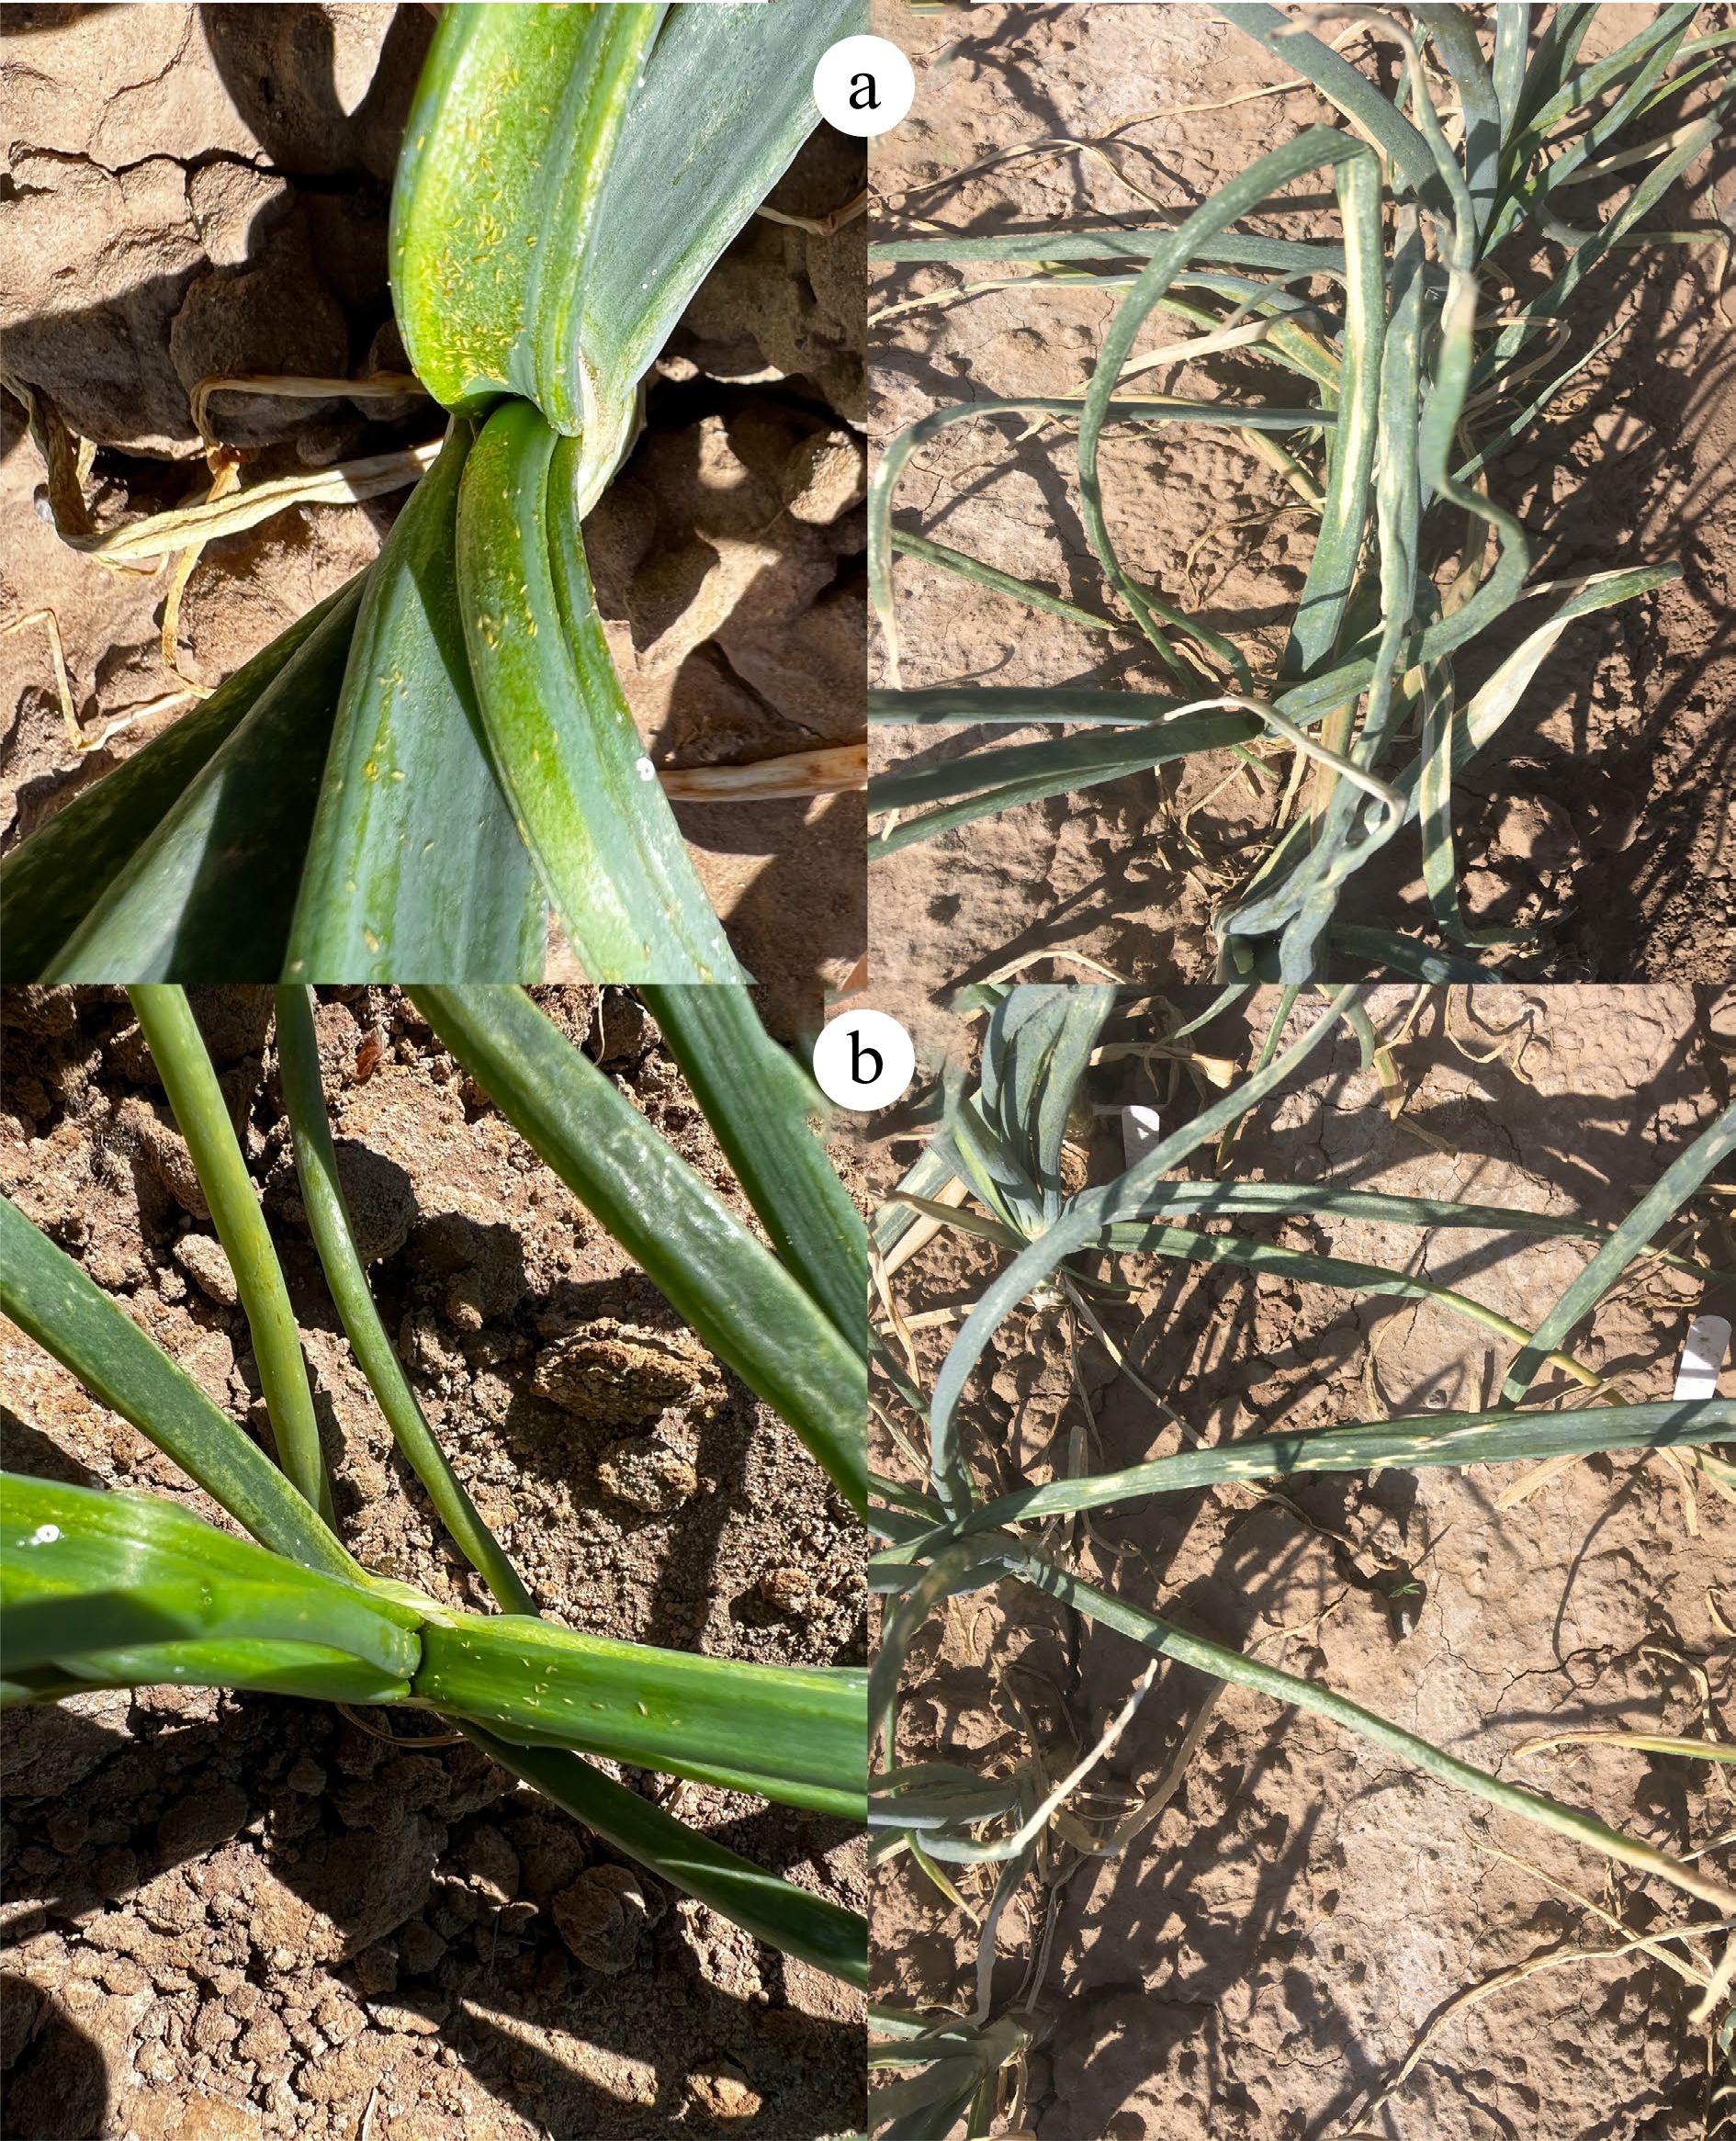
Figure 3.
Thrips in the leaf axils of plant (left) and IYS symptoms at 14 weeks after transplanting (WAT) (right) on (a) the thrips-attractive cultivar ‘Stockton Early Yellow’, and (b) an NMSU breeding line.
-
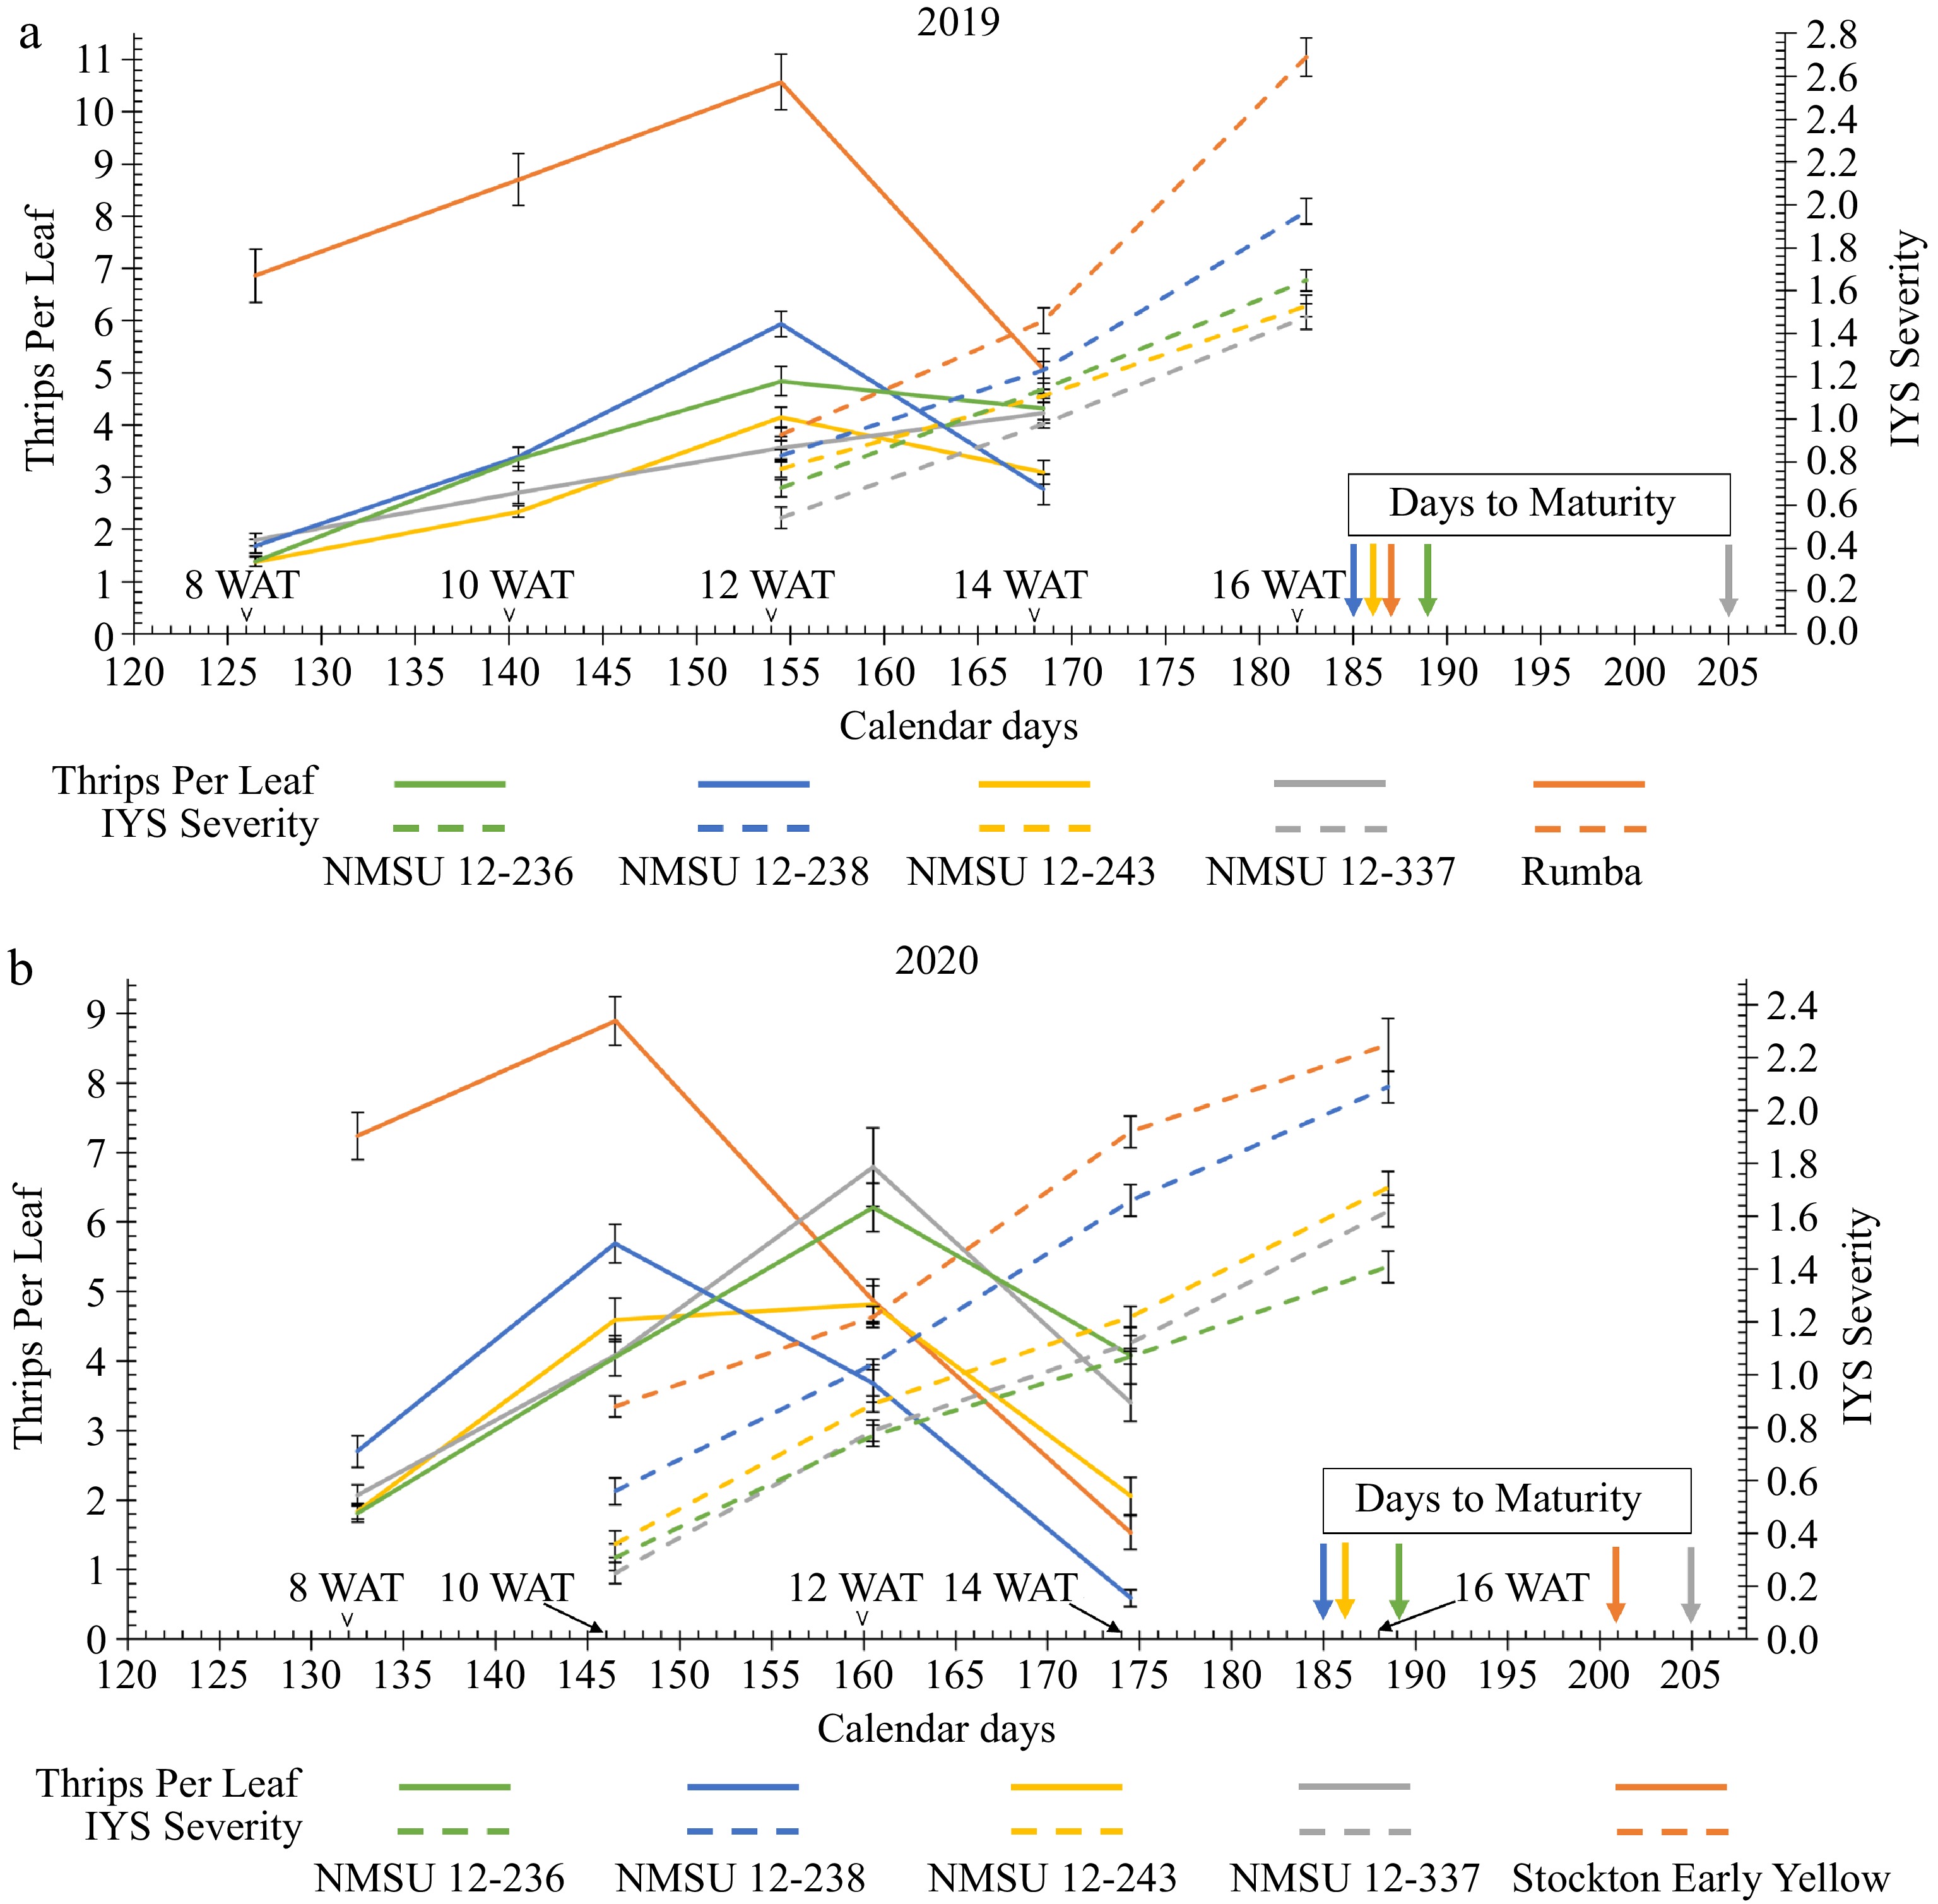
Figure 4.
Trend of number of thrips per leaf and Iris yellow spot (IYS) severity of the NMSU breeding lines and the thrips-attractive check cultivars, (a) 'Rumba' in 2019 and, (b) 'Stockton Early Yellow' in 2020 at various calendar days [8, 10, 12, 14, and 16 WAT (weeks after transplanting)] in the growing season.
-
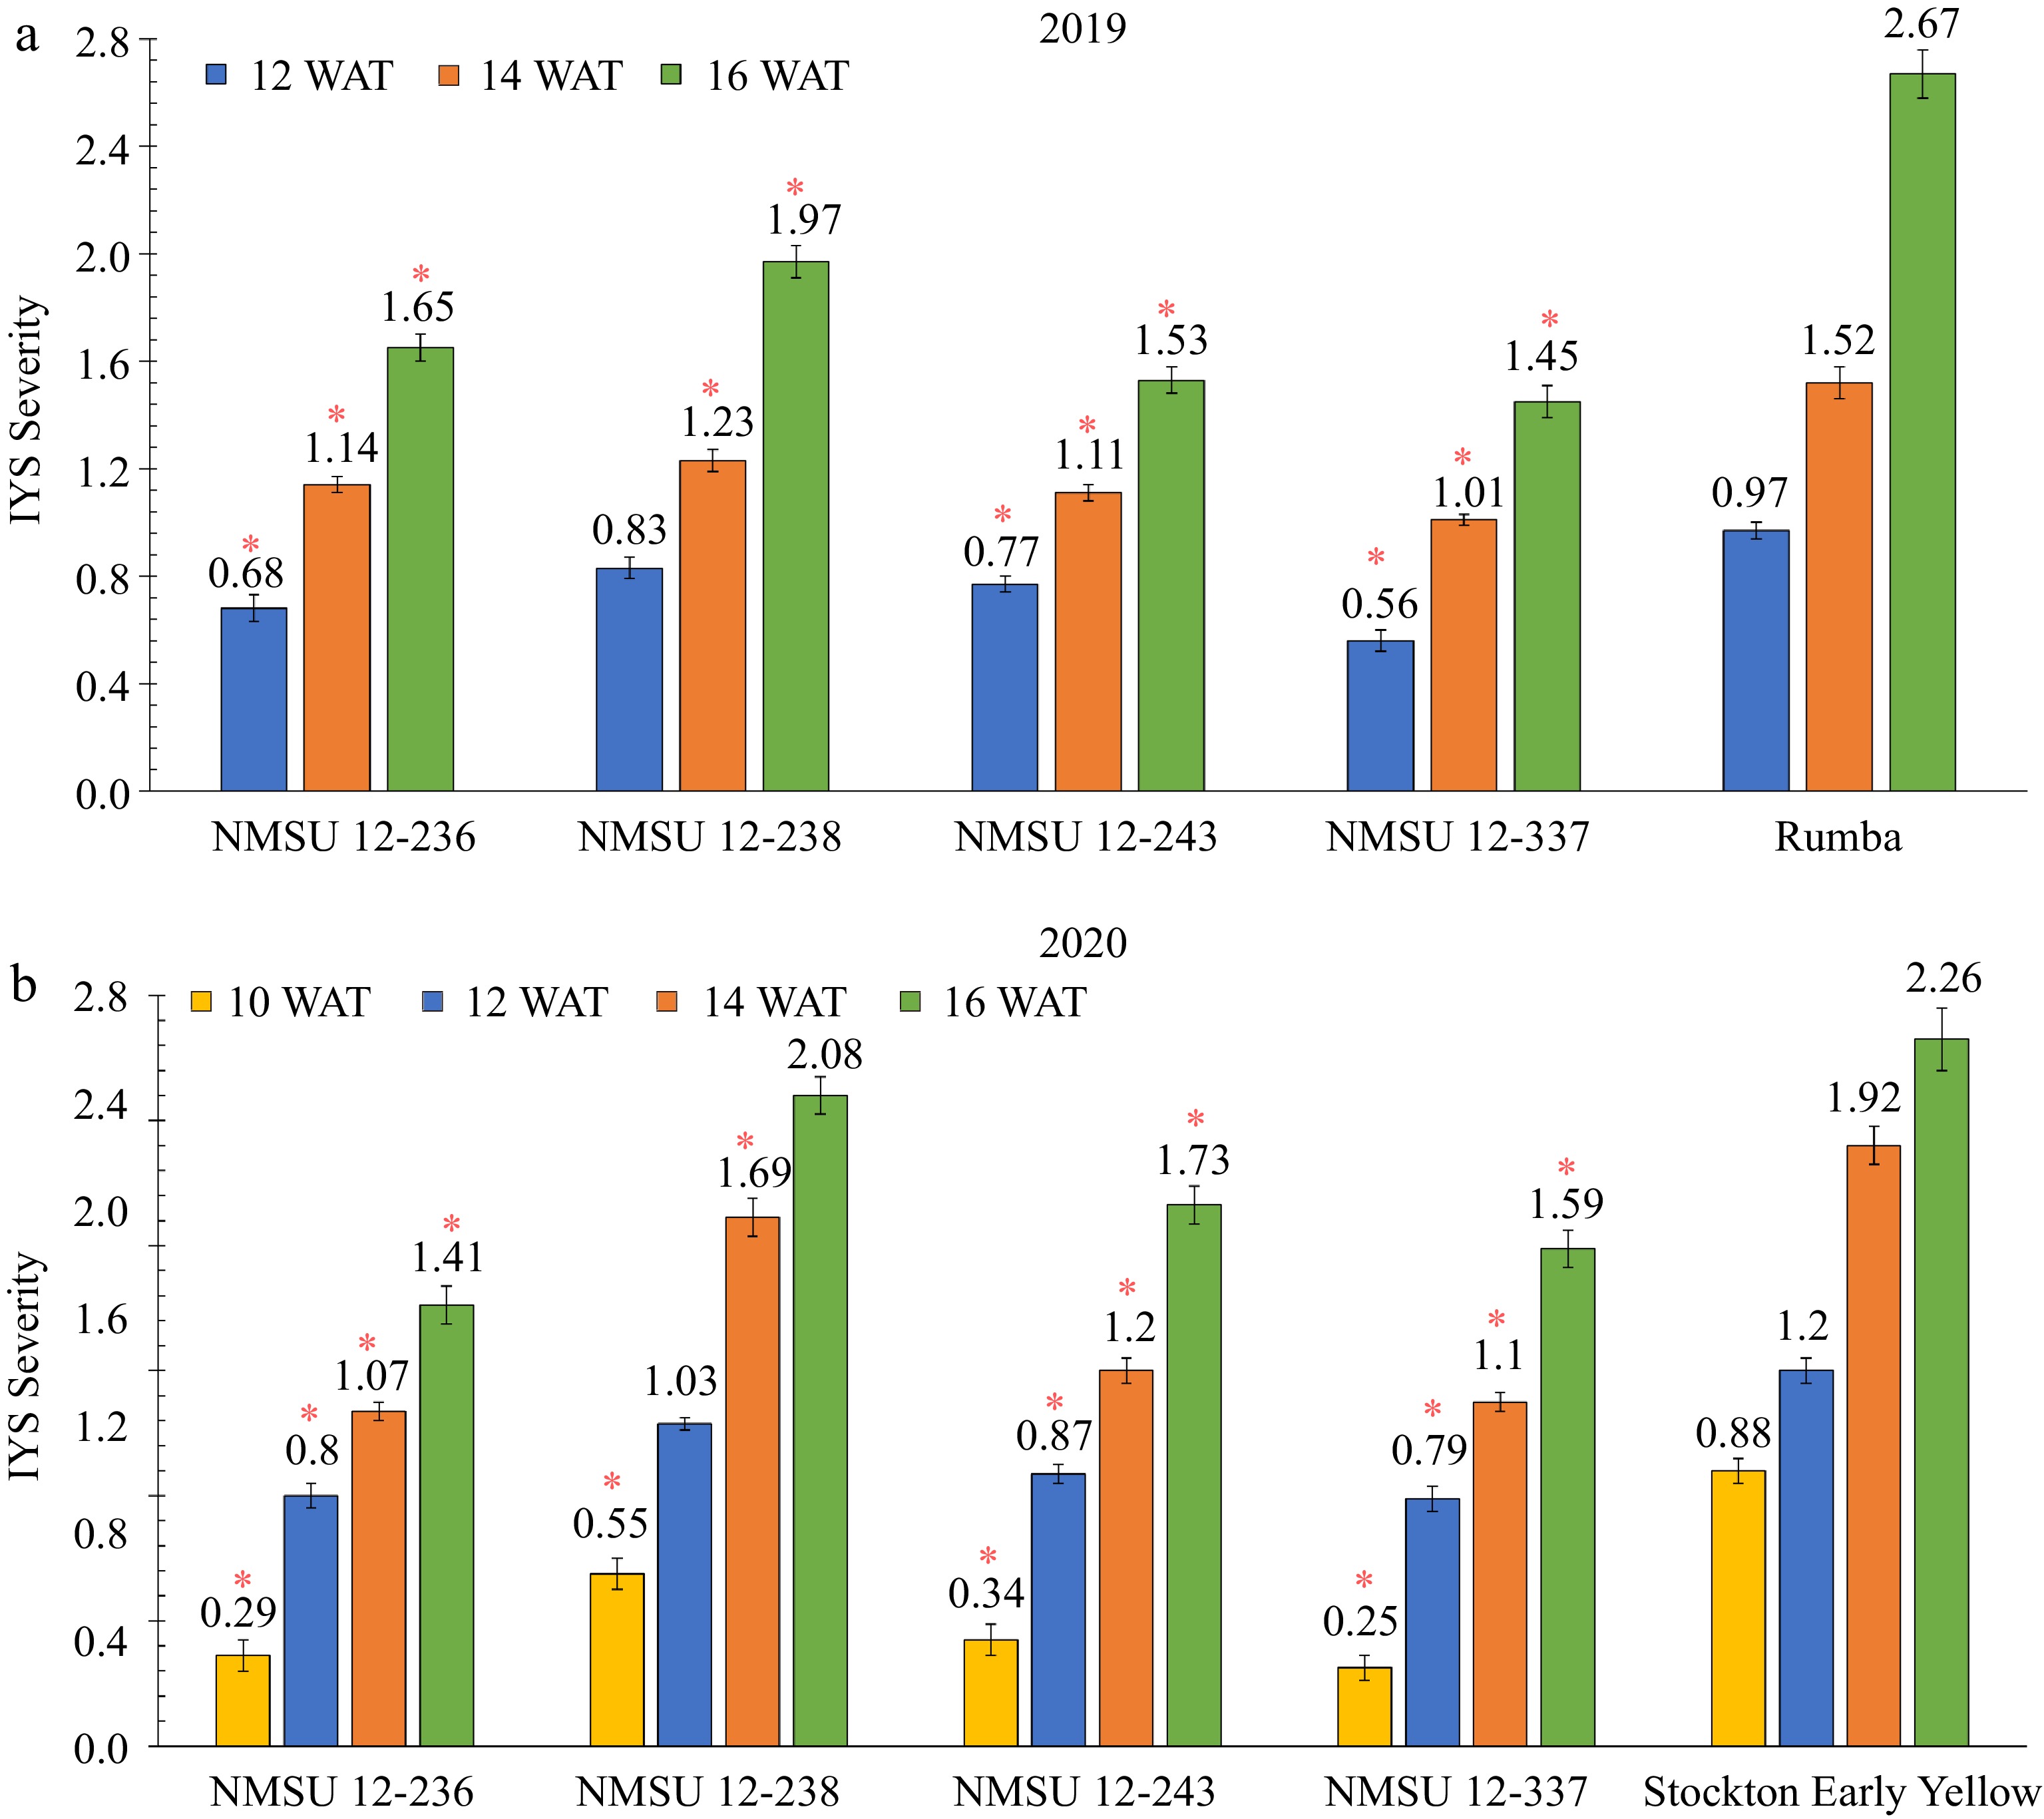
Figure 5.
Comparison of Iris yellow spot (IYS) severity of four NMSU onion breeding lines, NMSU 12-236, NMSU 12-238, NMSU 12-243, NMSU 12-337, with the thrips-attractive check cultivars, (a) 'Rumba' in 2019, and (b) 'Stockton Early Yellow' in 2020. Entries were arranged in a randomized complete block design with three blocks, each with four replications. Bars with '*' indicates that selected breeding lines are different from the thrips-attractive entries at p ≤ 0.05. Ten randomly selected plants per plot or replication were rated for IYS severity on a scale of 0 to 4, where 0 = no symptoms, 1 = 1 to 2 small lesions per leaf, 2 ≥ 2 mediumsized lesions per leaf, 3 = lesions coalescing on more than 25% of the leaf, and 4 ≥ 50 % leaf death[30]. The observation dates were 10, 12, 14, and 16 weeks after transplanting (WAT).
-
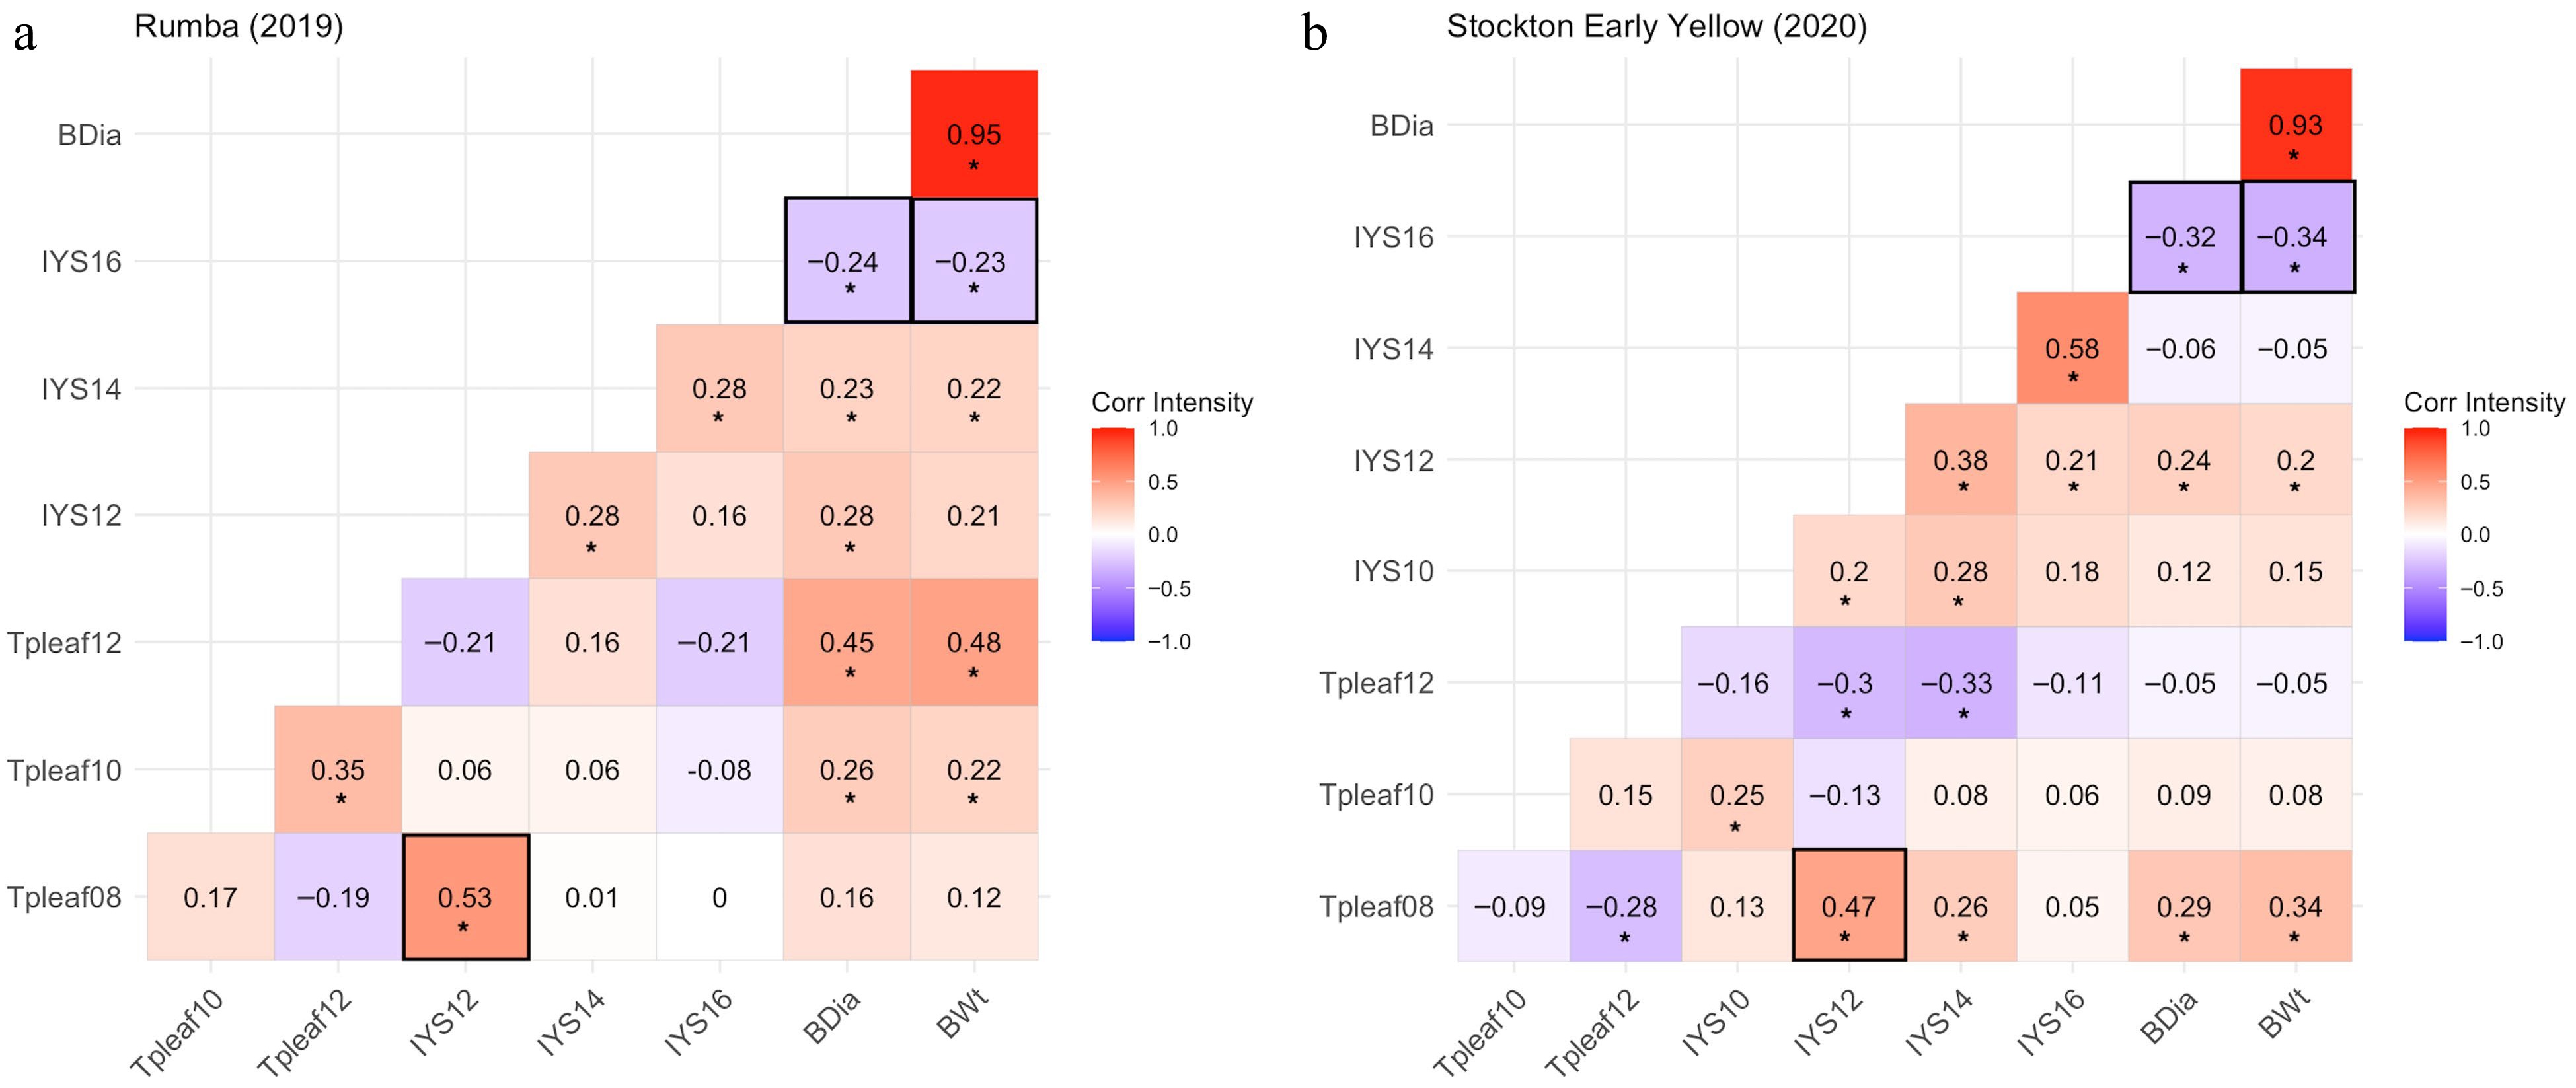
Figure 6.
Correlation heatmaps for thrips-attractive check cultivars, (a) 'Rumba' (2019) and (b) 'Stockton Early Yellow' (2020), demonstrating correlation coefficients among thrips per leaf (Tpleaf), Iris yellow spot (IYS) severity, and bulb yield parameters (BDia = bulb diameter and BWt = bulb weight) at various observation dates. '*' Indicates that correlation coefficients are significant at p ≤ 0.05. Data were collected for thrips per leaf at 8 (Tpleaf08), 10 (Tpleaf10), and 12 (Tpleaf12) weeks after transplanting (WAT), and IYS severity ratings at 10 (IYS10), 12 (IYS12), 14 (IYS14), and 16 (IYS16) WAT.
-
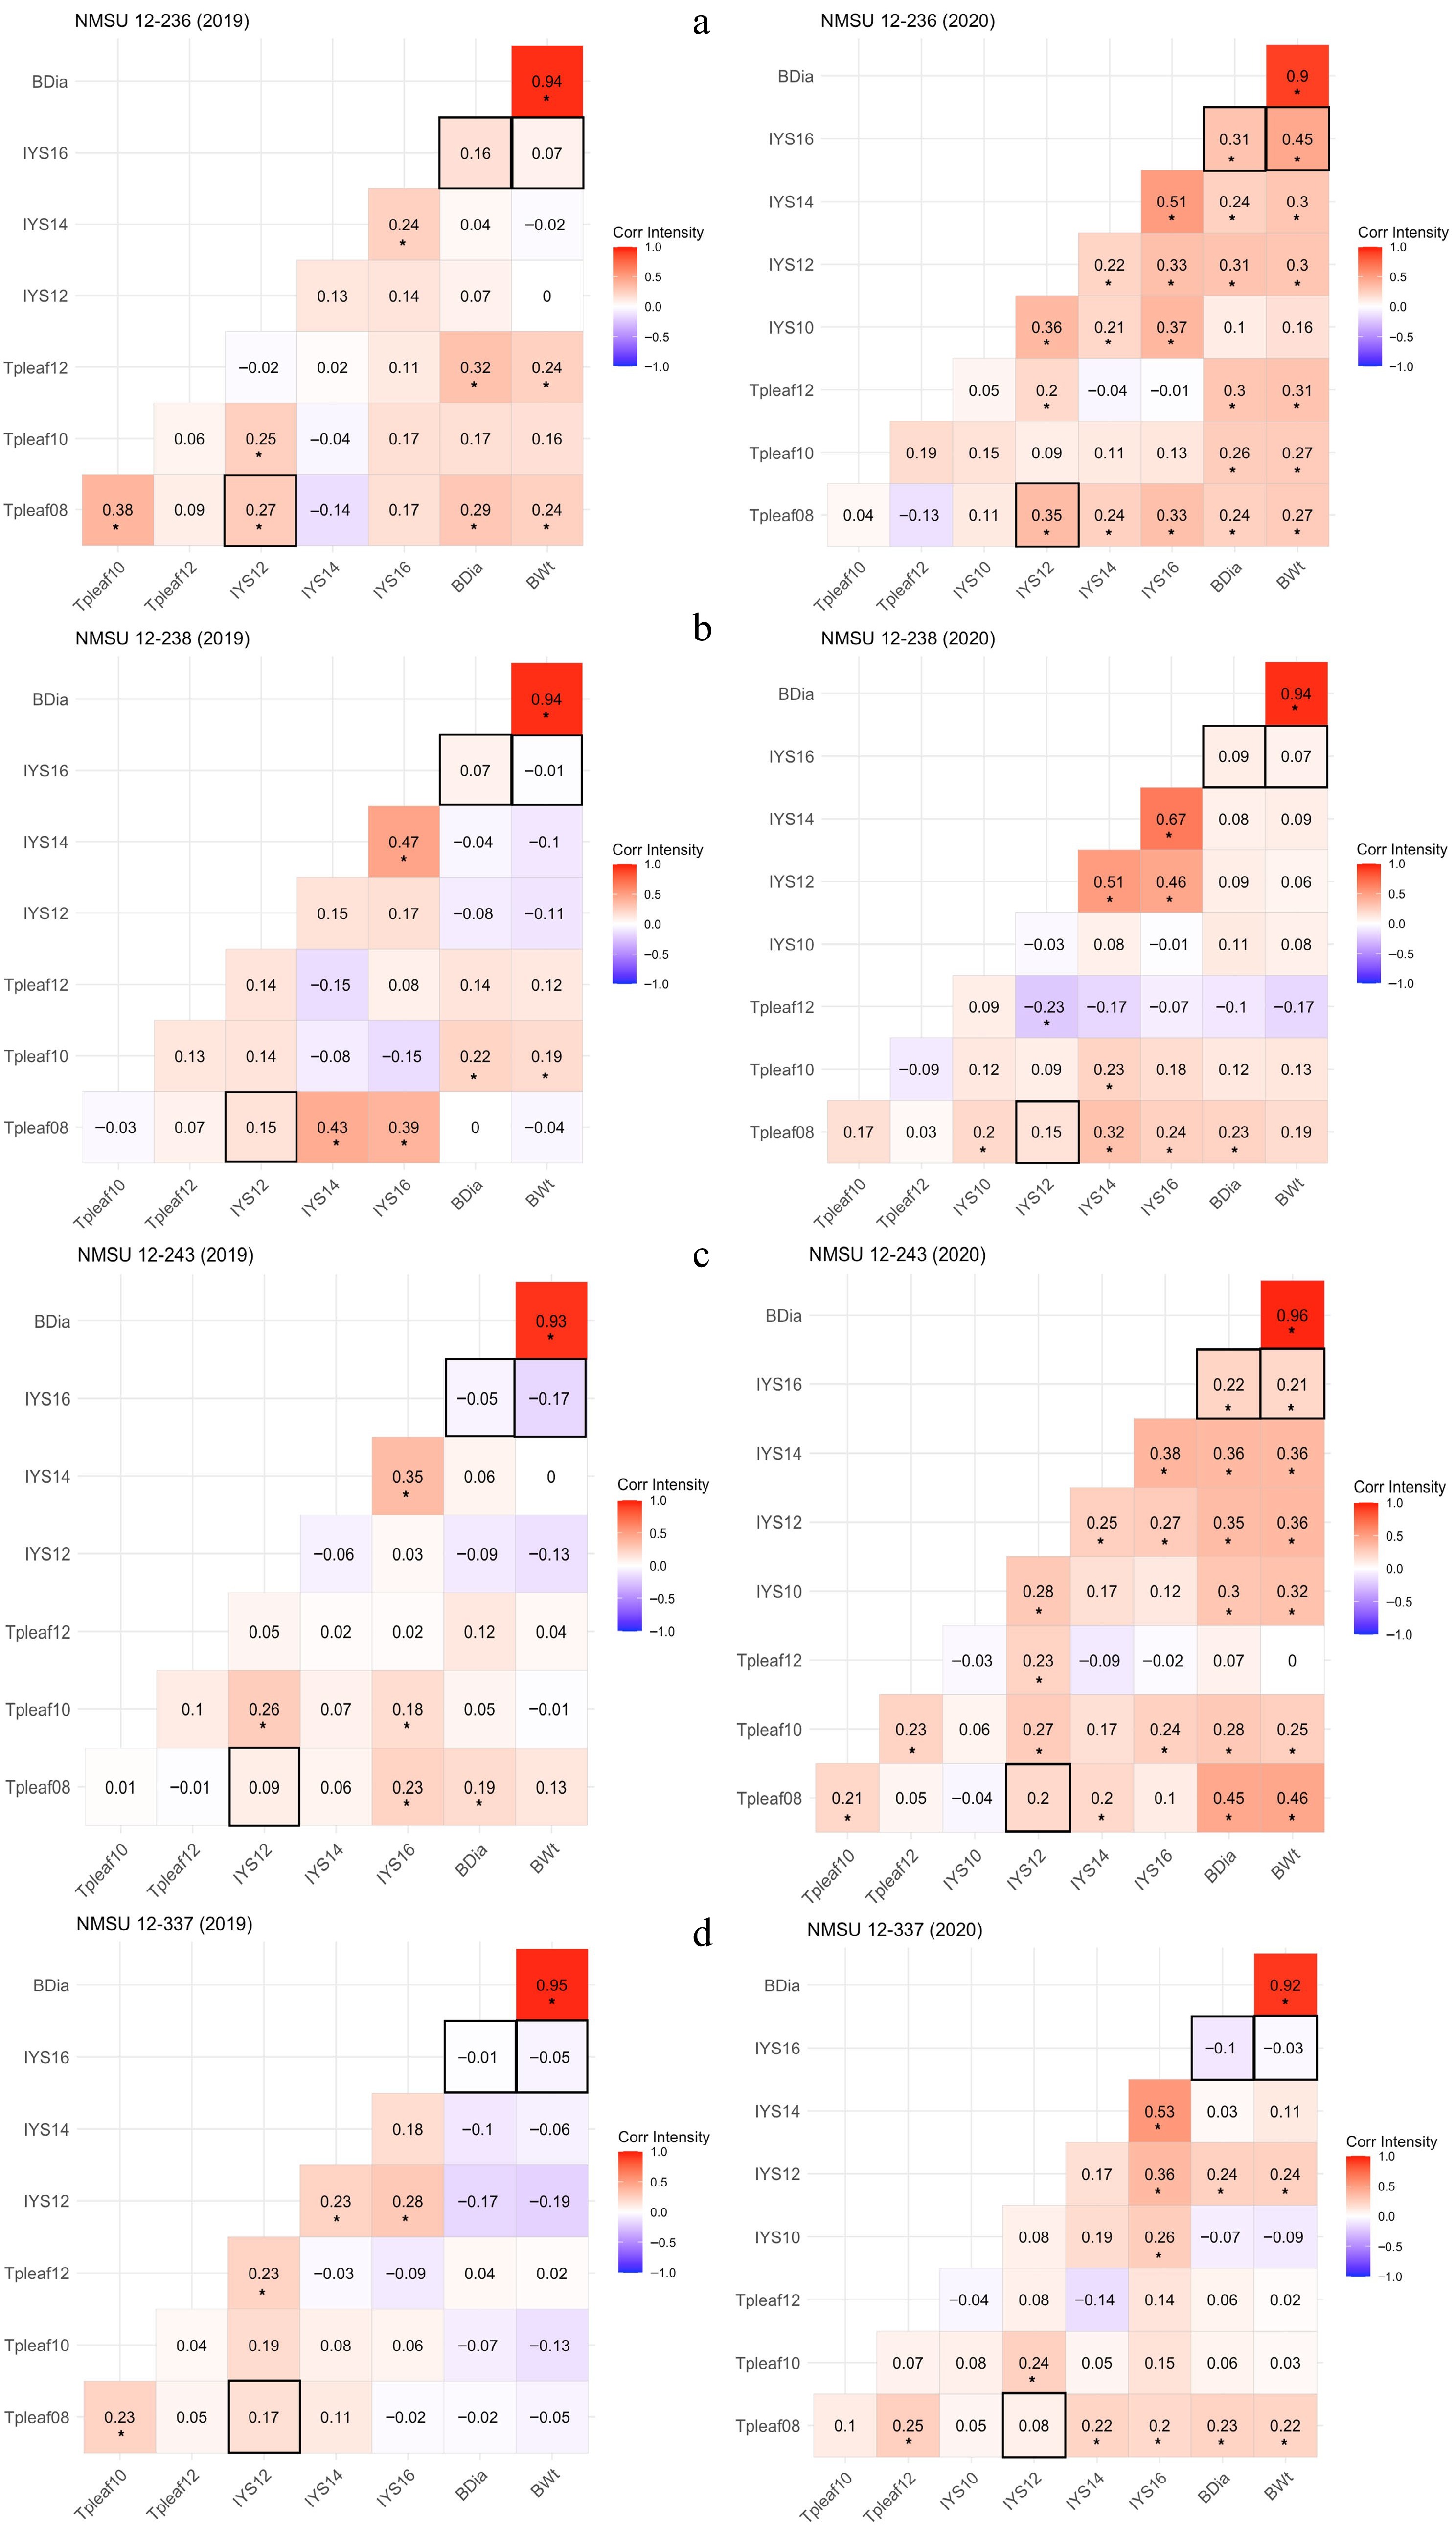
Figure 7.
Correlation heatmaps for NMSU onion breeding lines, (a) NMSU 12-236, (b) NMSU 12-238, (c) NMSU 12-243, and (d) NMSU 12-337, demonstrating correlation coefficients among thrips per leaf (Tpleaf), Iris yellow spot (IYS) severity, and bulb yield parameters (BDia = bulb diameter and BWt = bulb weight) at various observation dates in 2019 and 2020. '*' Indicates that correlation coefficients are significant at p ≤ 0.05. Data were collected for thrips per leaf at 8 (Tpleaf08), 10 (Tpleaf10), and 12 (Tpleaf12) weeks after transplanting (WAT), and IYS severity ratings at 10 (IYS10), 12 (IYS12), 14 (IYS14), and 16 (IYS16) WAT.
Figures
(7)
Tables
(0)