-
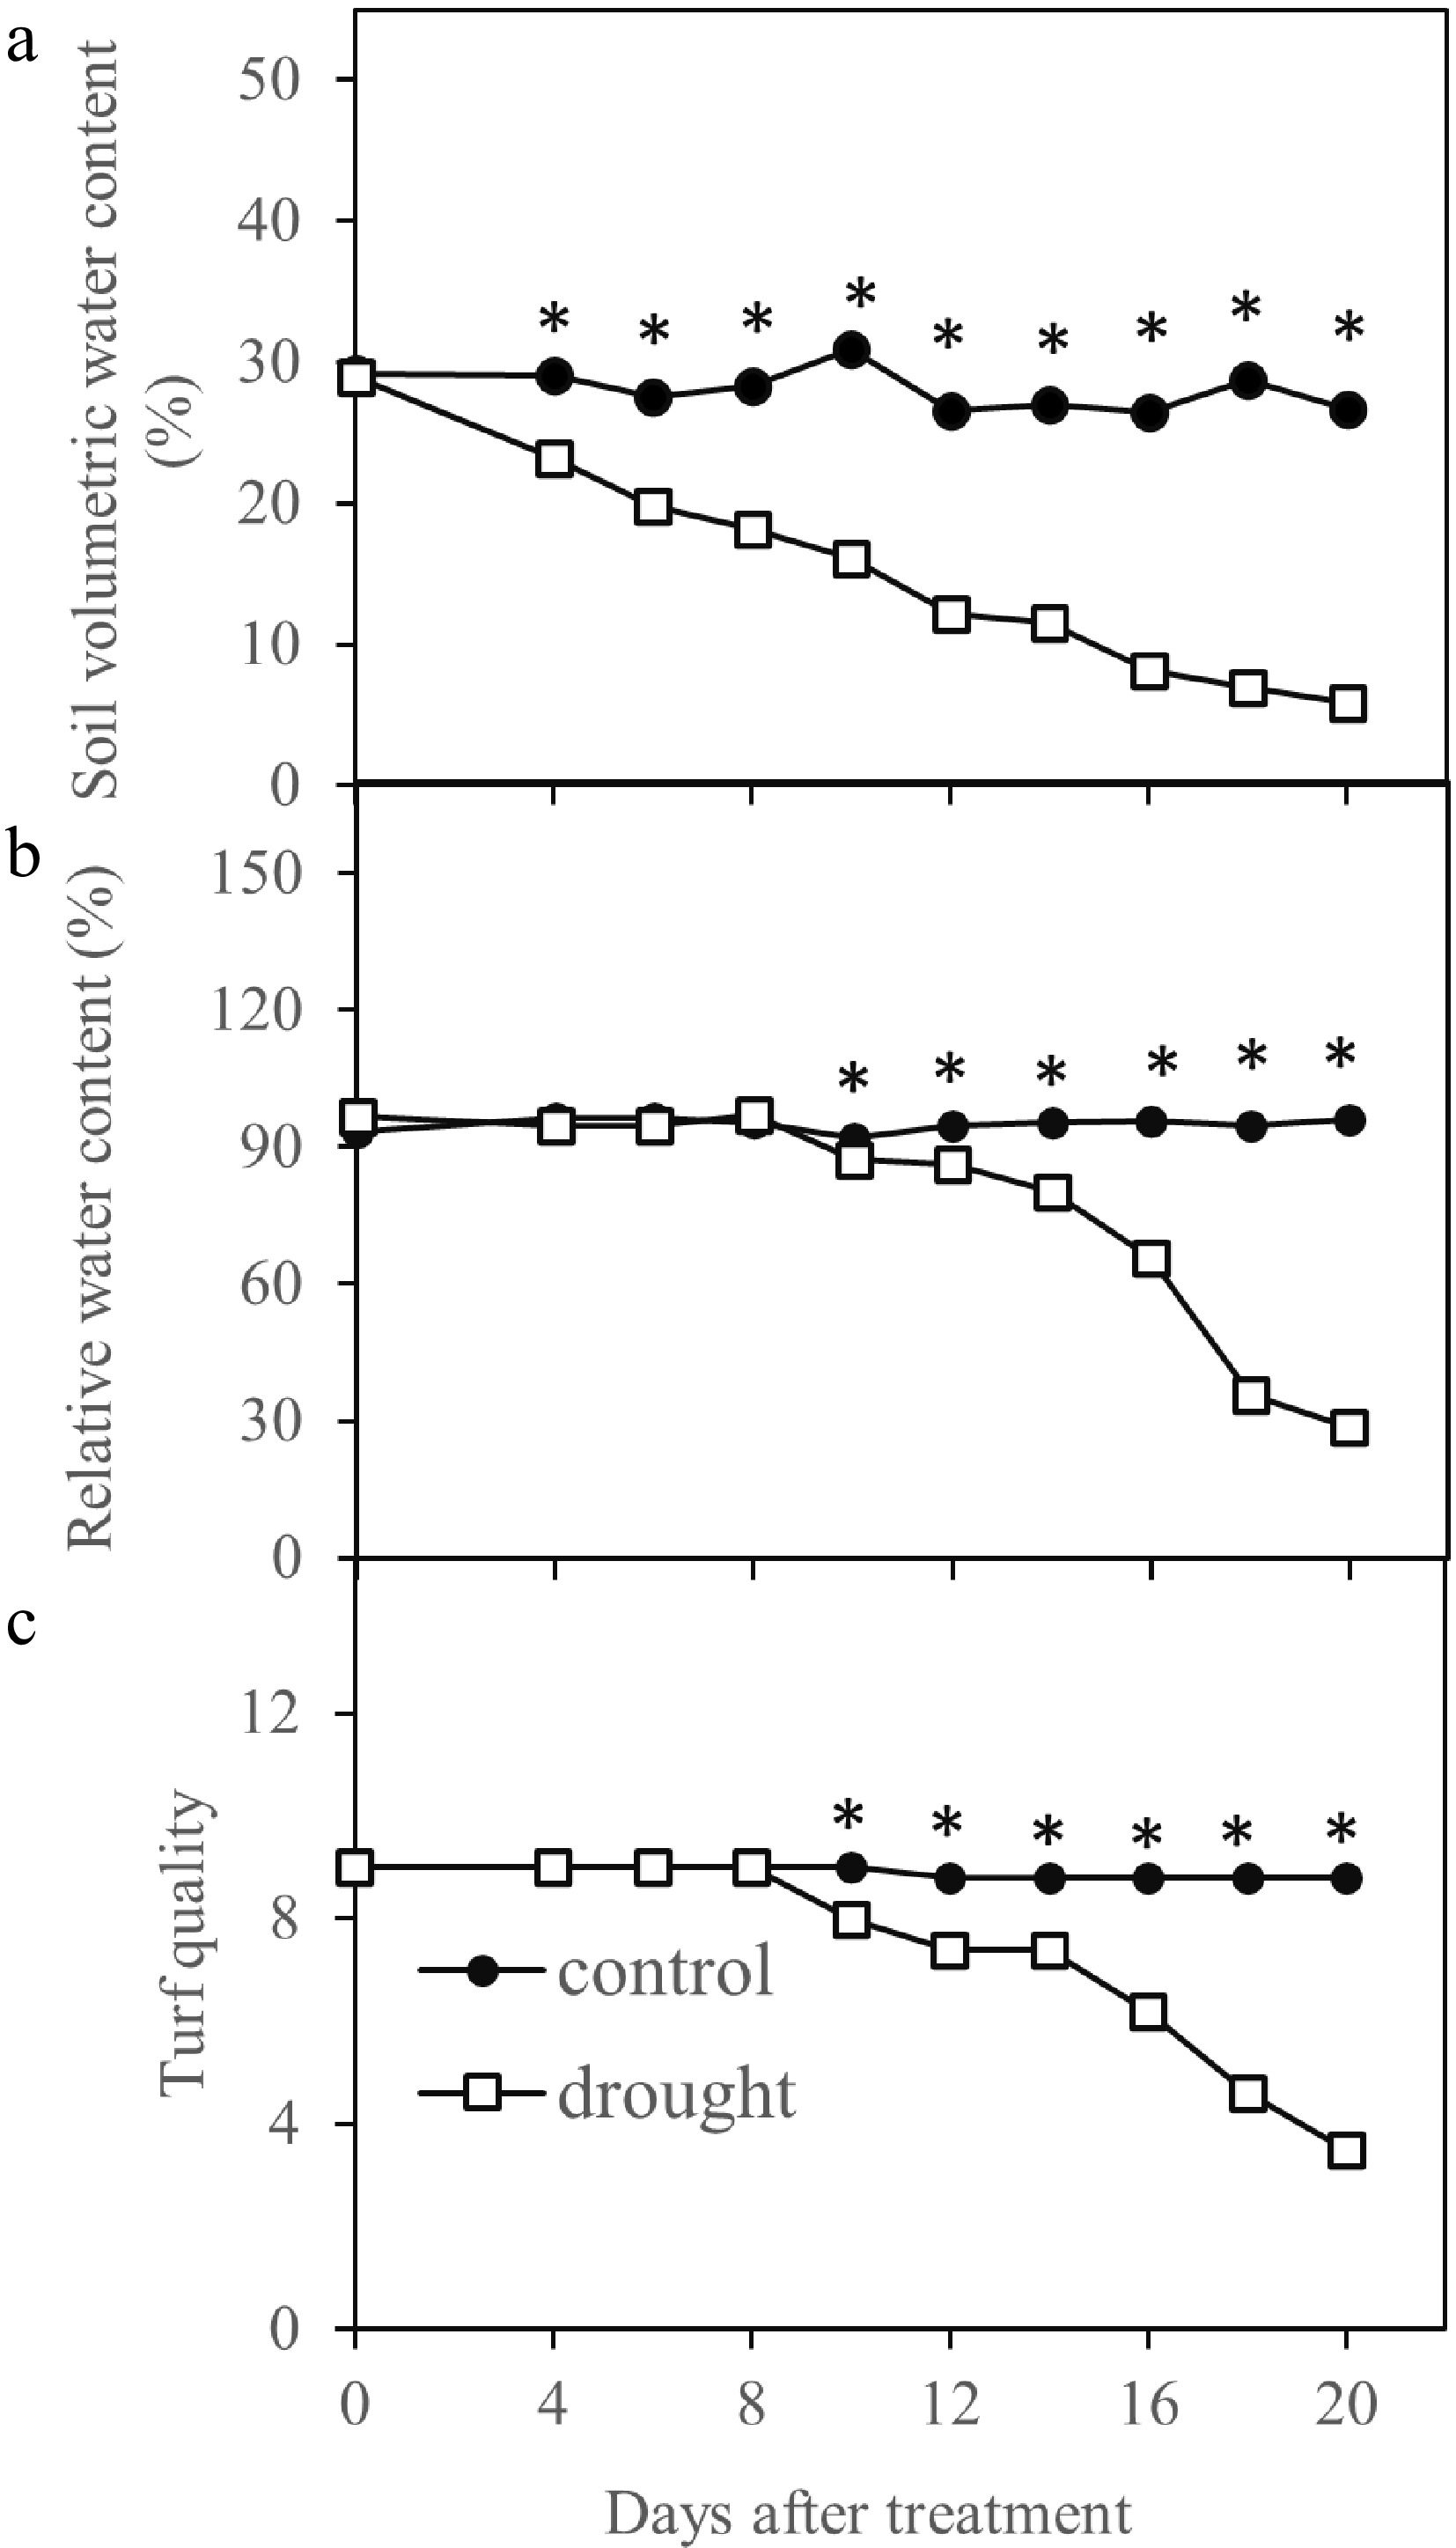
Figure 1.
Drought stress affected turf quality, leaf relative water content and soil volumetric water content during 20 d of stress period in Kentucky bluegrass. * indicates significant difference between control and drought stress treatments (p ≤ 0.05) at each day of measurement. Presented values represent average of five data points.
-
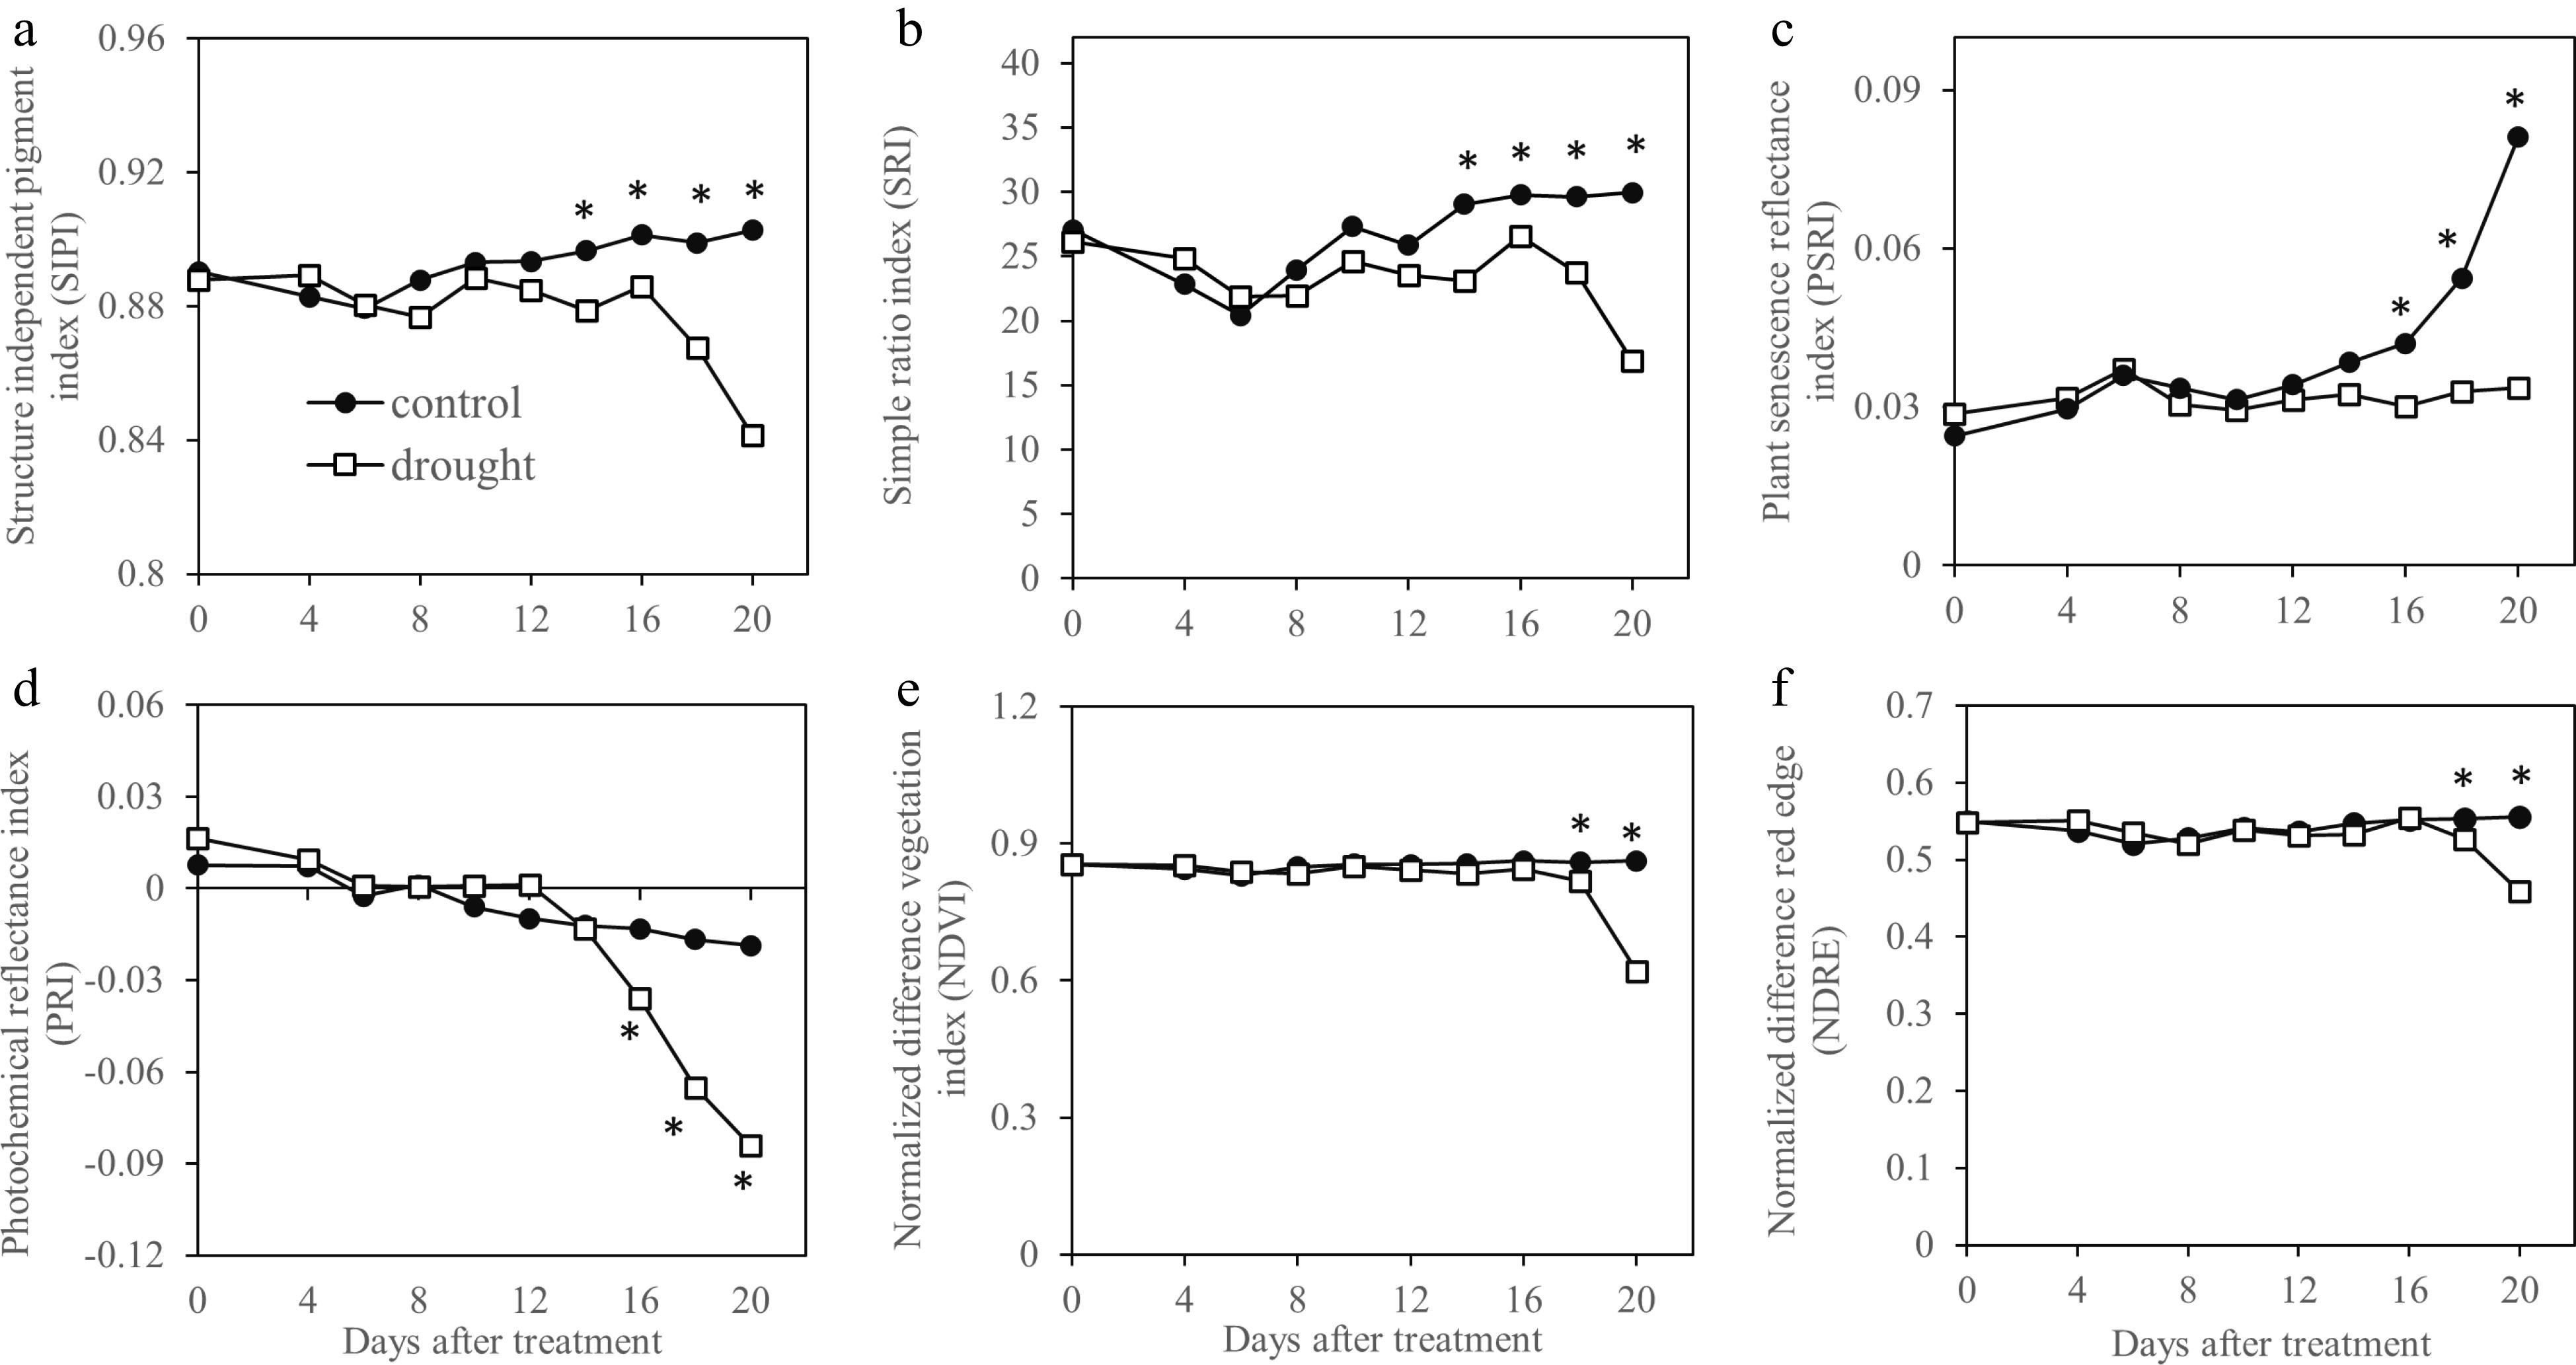
Figure 2.
Vegetation indices generated by hyperspectral sensing and sensitivity of these indices in monitoring drought in Kentucky bluegrass exposed to 20 d of drought stress. * indicates significant difference between control and drought stress treatments (p ≤ 0.05) at each day of measurement. Presented values represent average of five data points.
-
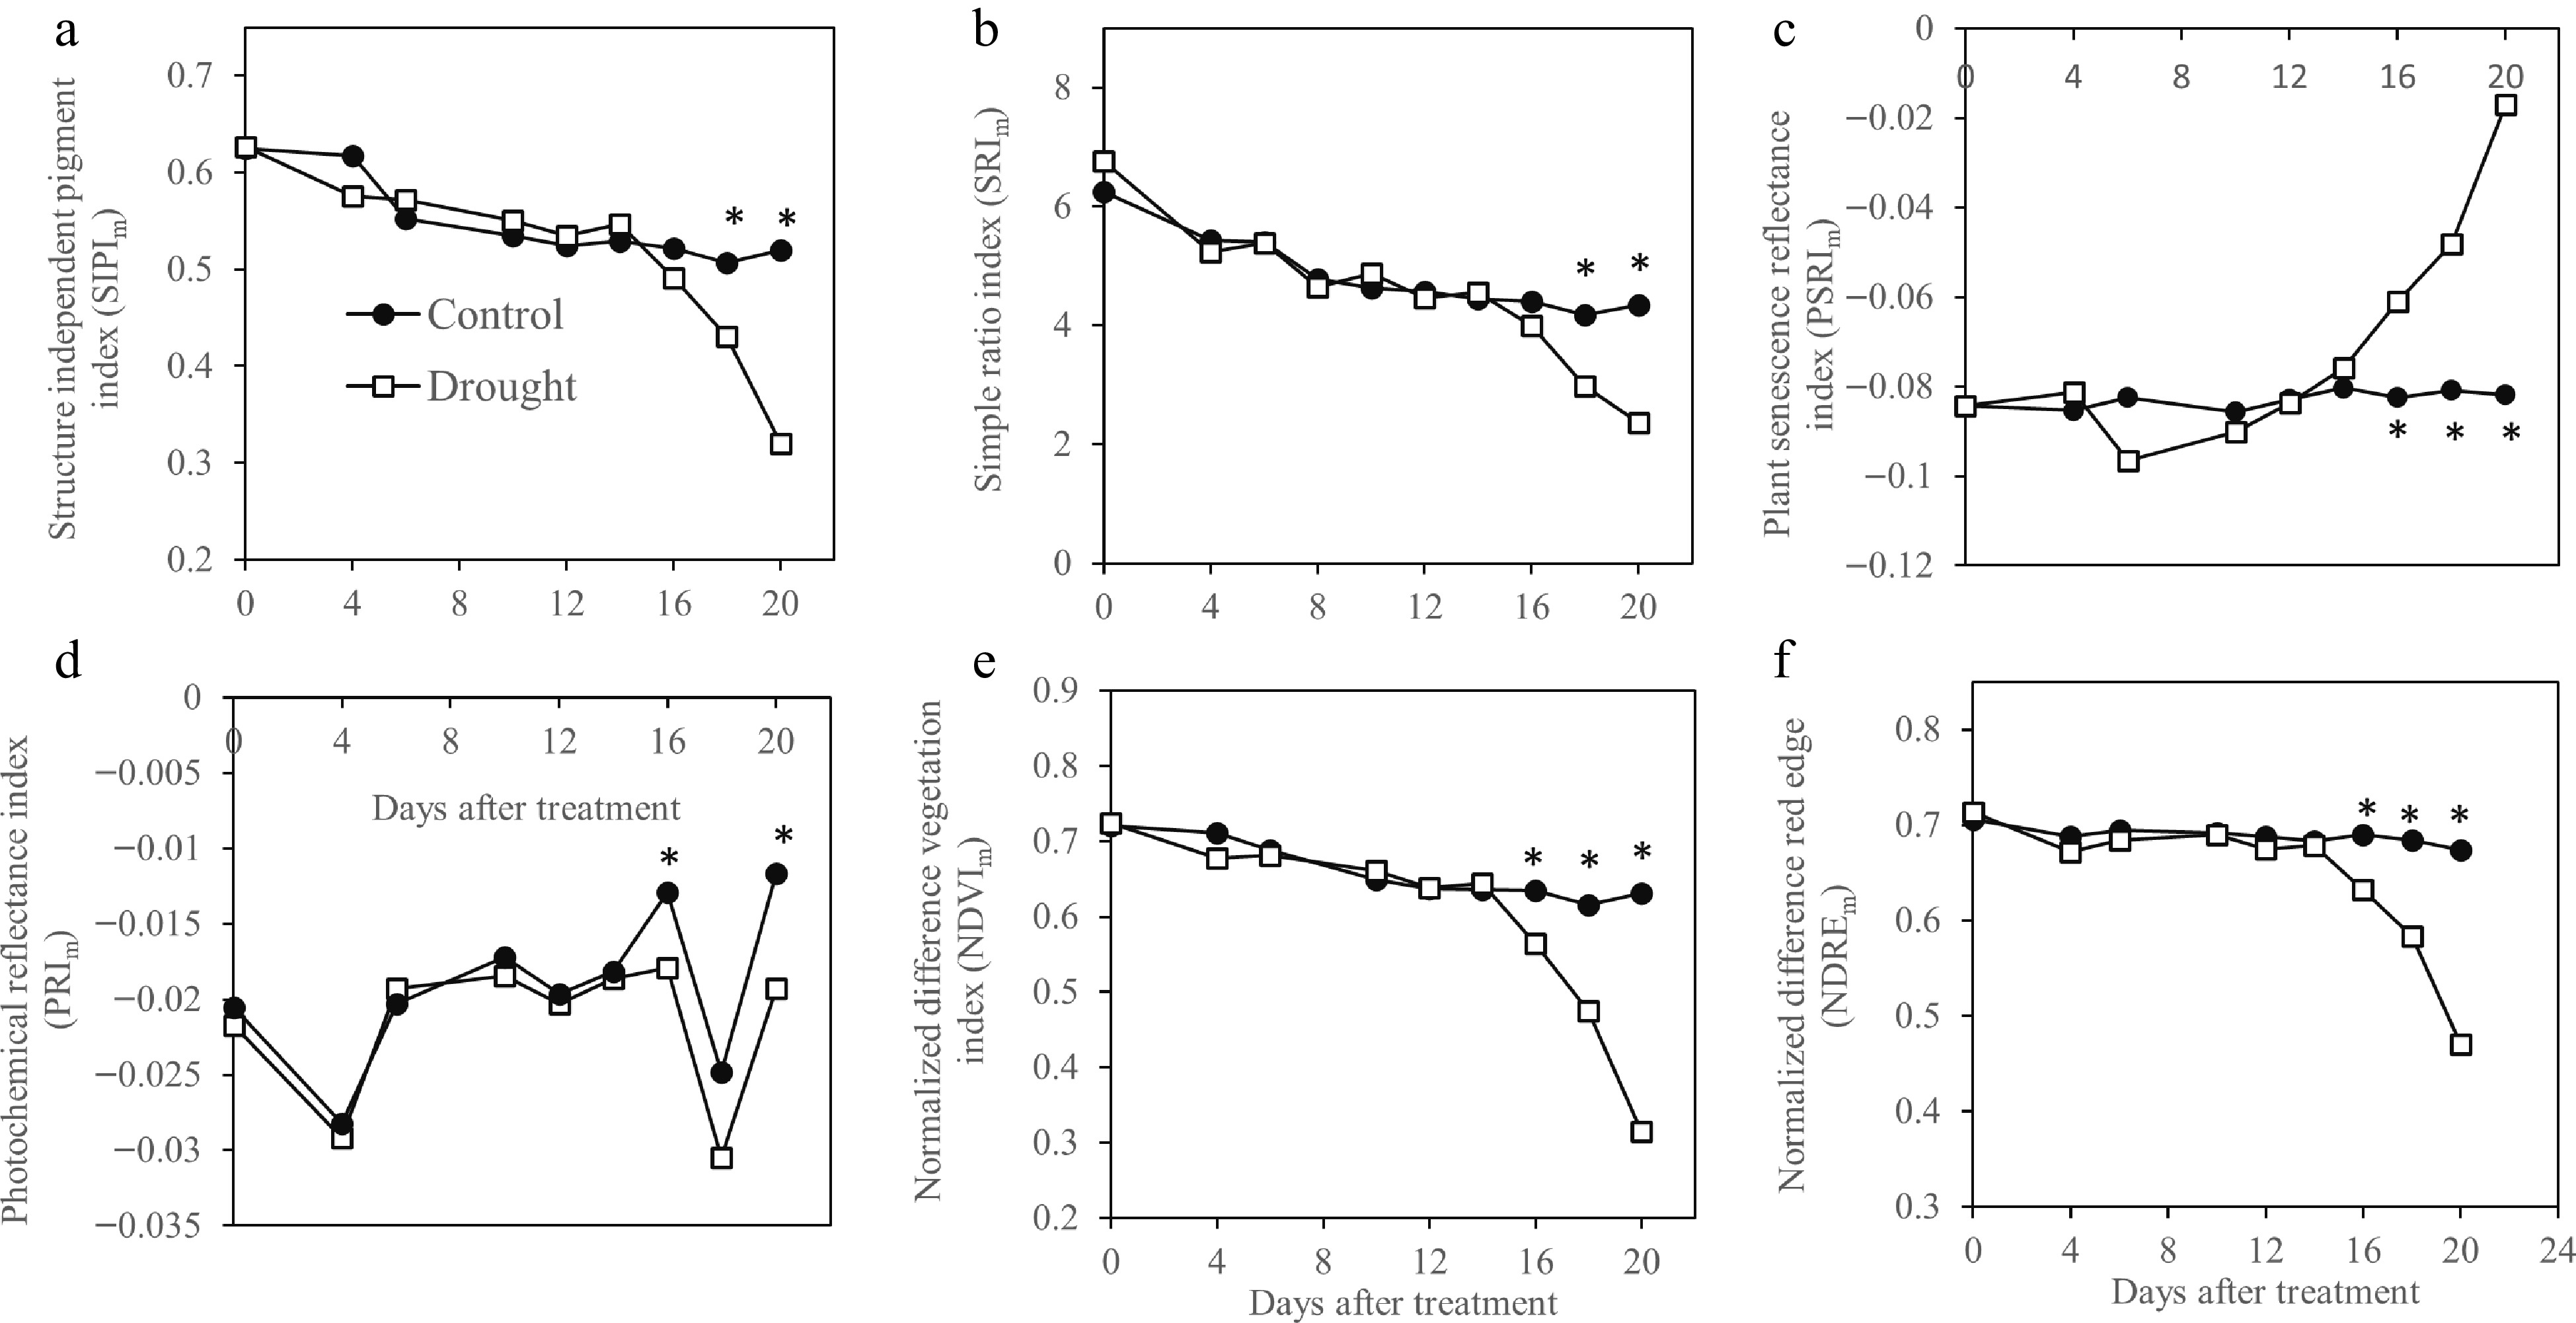
Figure 3.
Vegetation indices generated by multispectral image analysis and sensitivity of these indices in monitoring drought in Kentucky bluegrass exposed to 20 d of drought tress. * indicates significant difference between control and drought stress treatments (p ≤ 0.05) at each day of measurement. Presented values represent average of five data points.
-
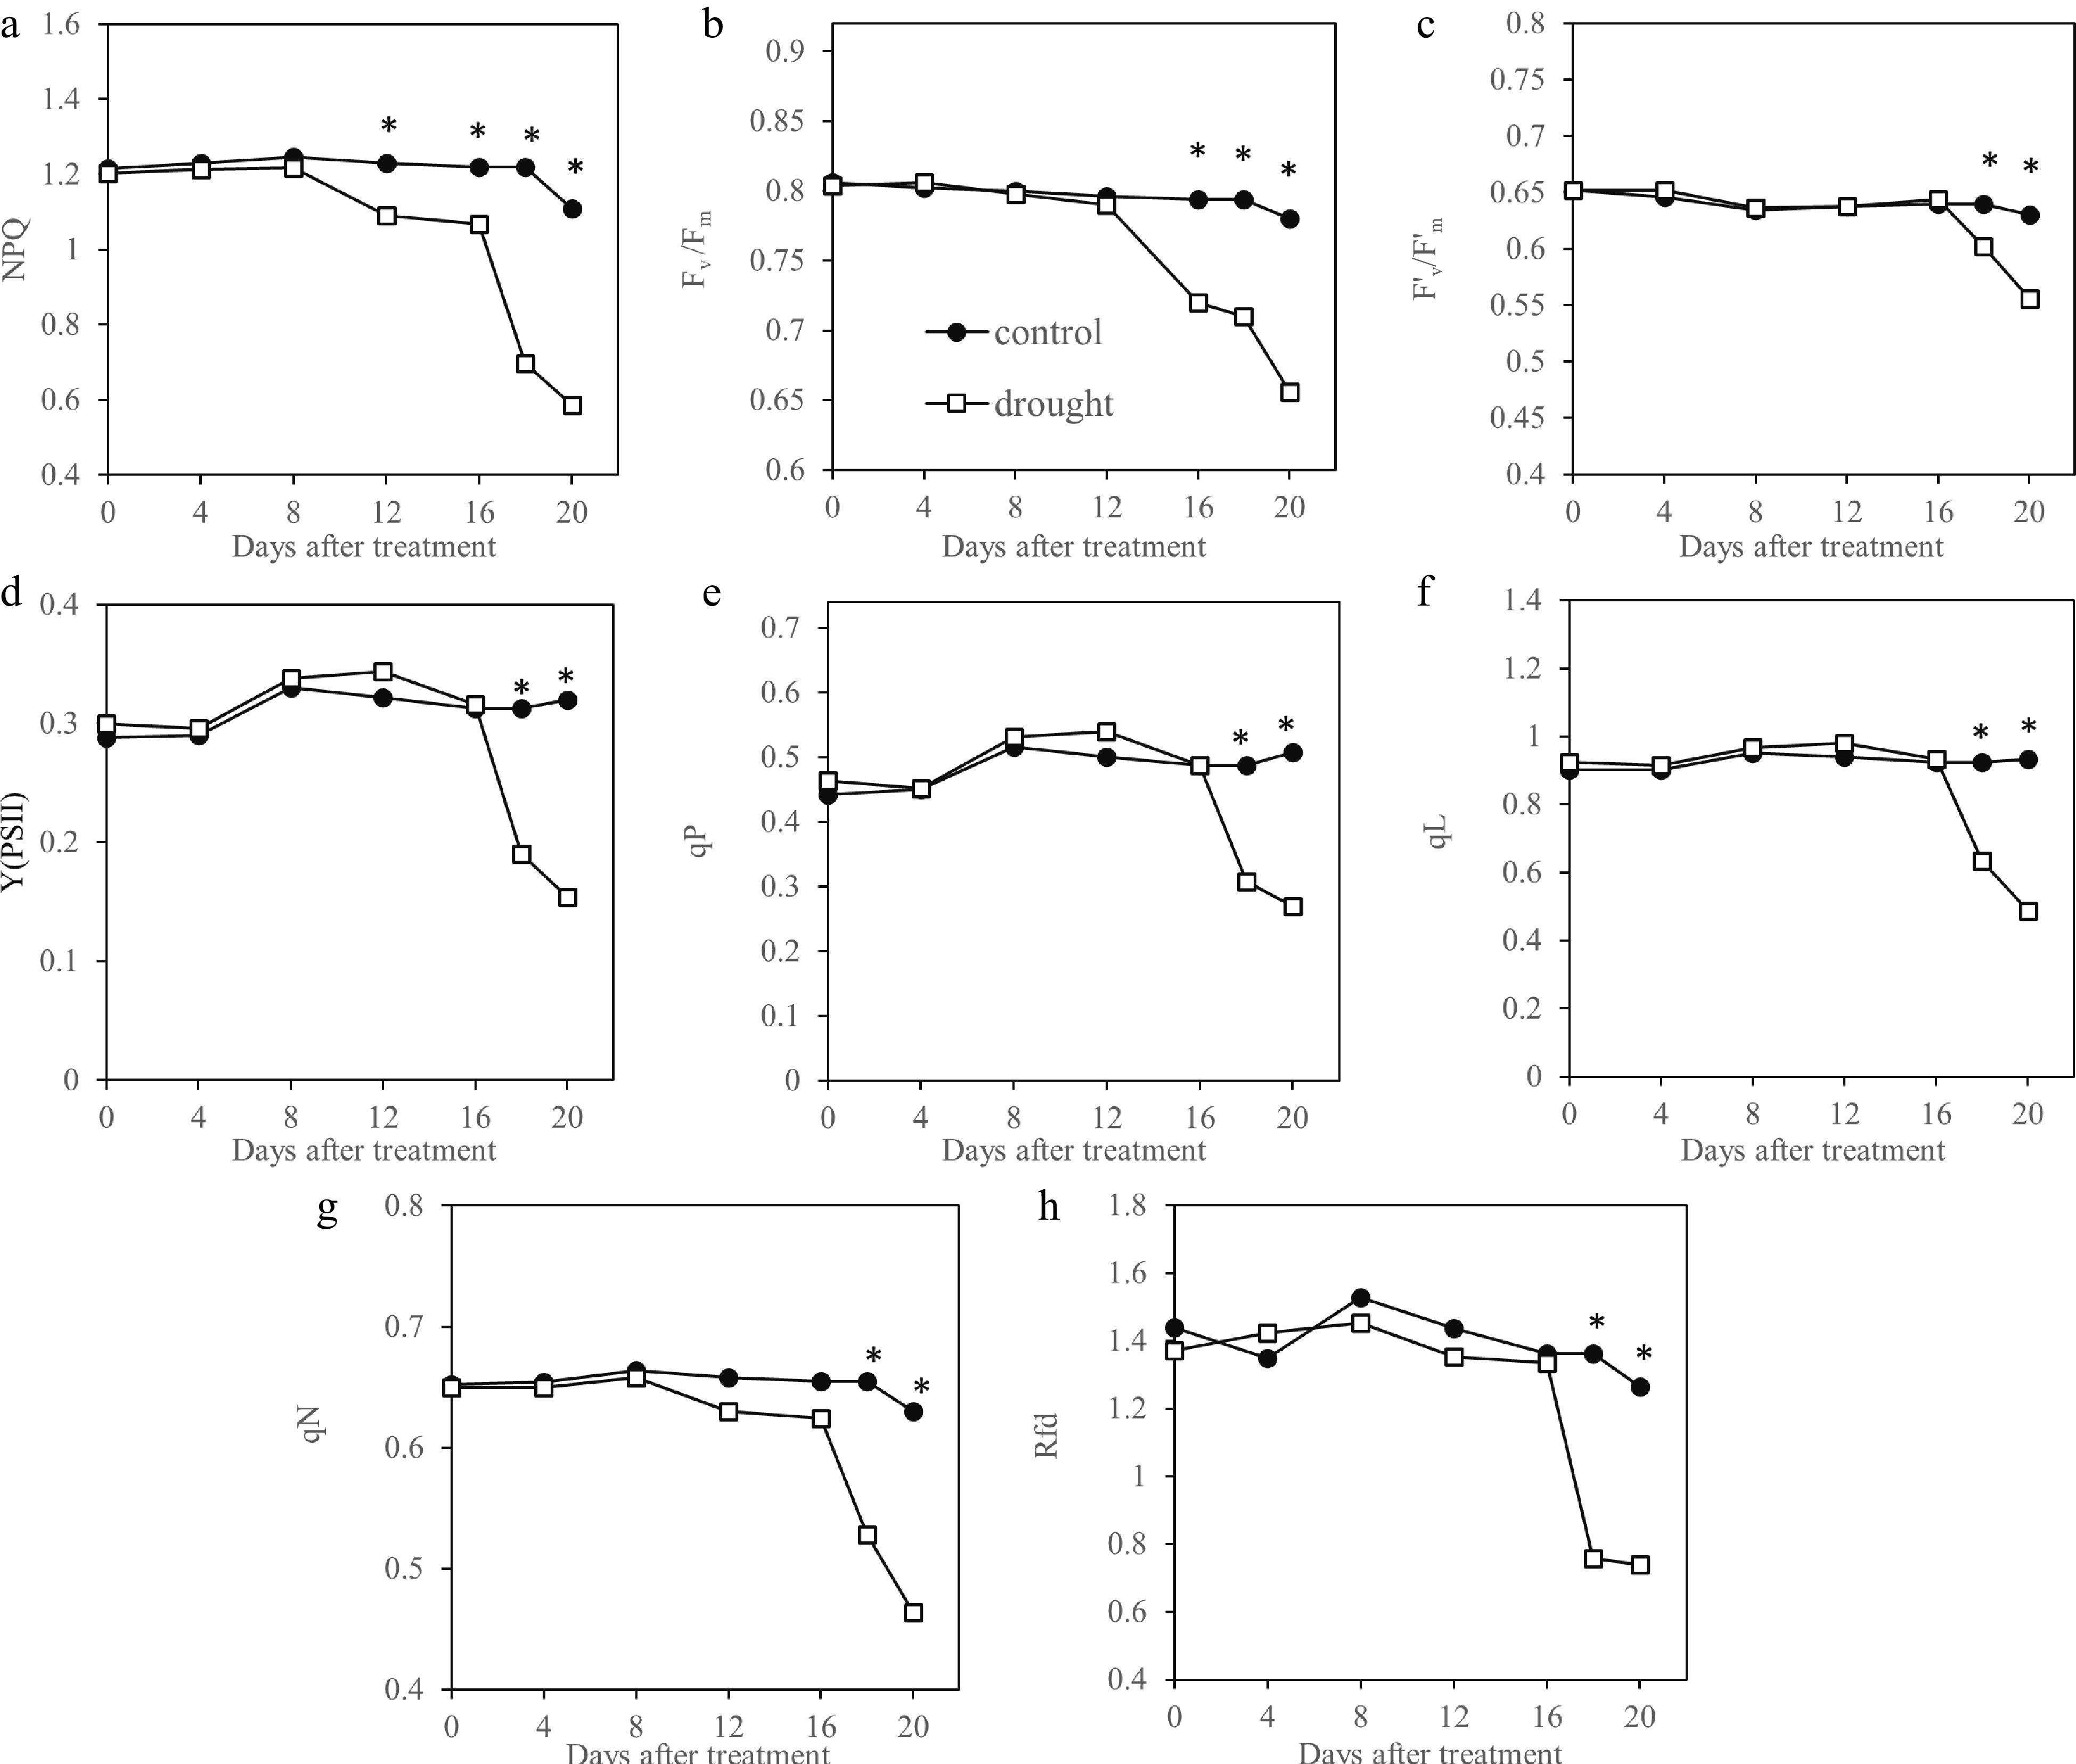
Figure 4.
Chlorophyll fluorescence parameters measured by pulse amplitude modulated fluorescence imaging system and detection of drought by these parameters in Kentucky bluegrass exposed to 20 d of drought stress. * indicates significant difference between control and drought stress treatments (p ≤ 0.05) at each day of measurement. Presented values represent average of five data points. NPQ, Non-photochemical quenching; Fv /Fm, Maximum photochemical efficiency of PSII; F'v/F'm, Photochemical efficiency of open PSII centers; Y(PSII), Actual photochemical quantum yield of PSII centers; qP, Photochemical quenching coefficient (Puddle model); qL, Photochemical quenching coefficient (Lake model); qN, Non-photochemical quenching coefficient; Rfd, Chlorophyll fluorescence decrease ratio.
-
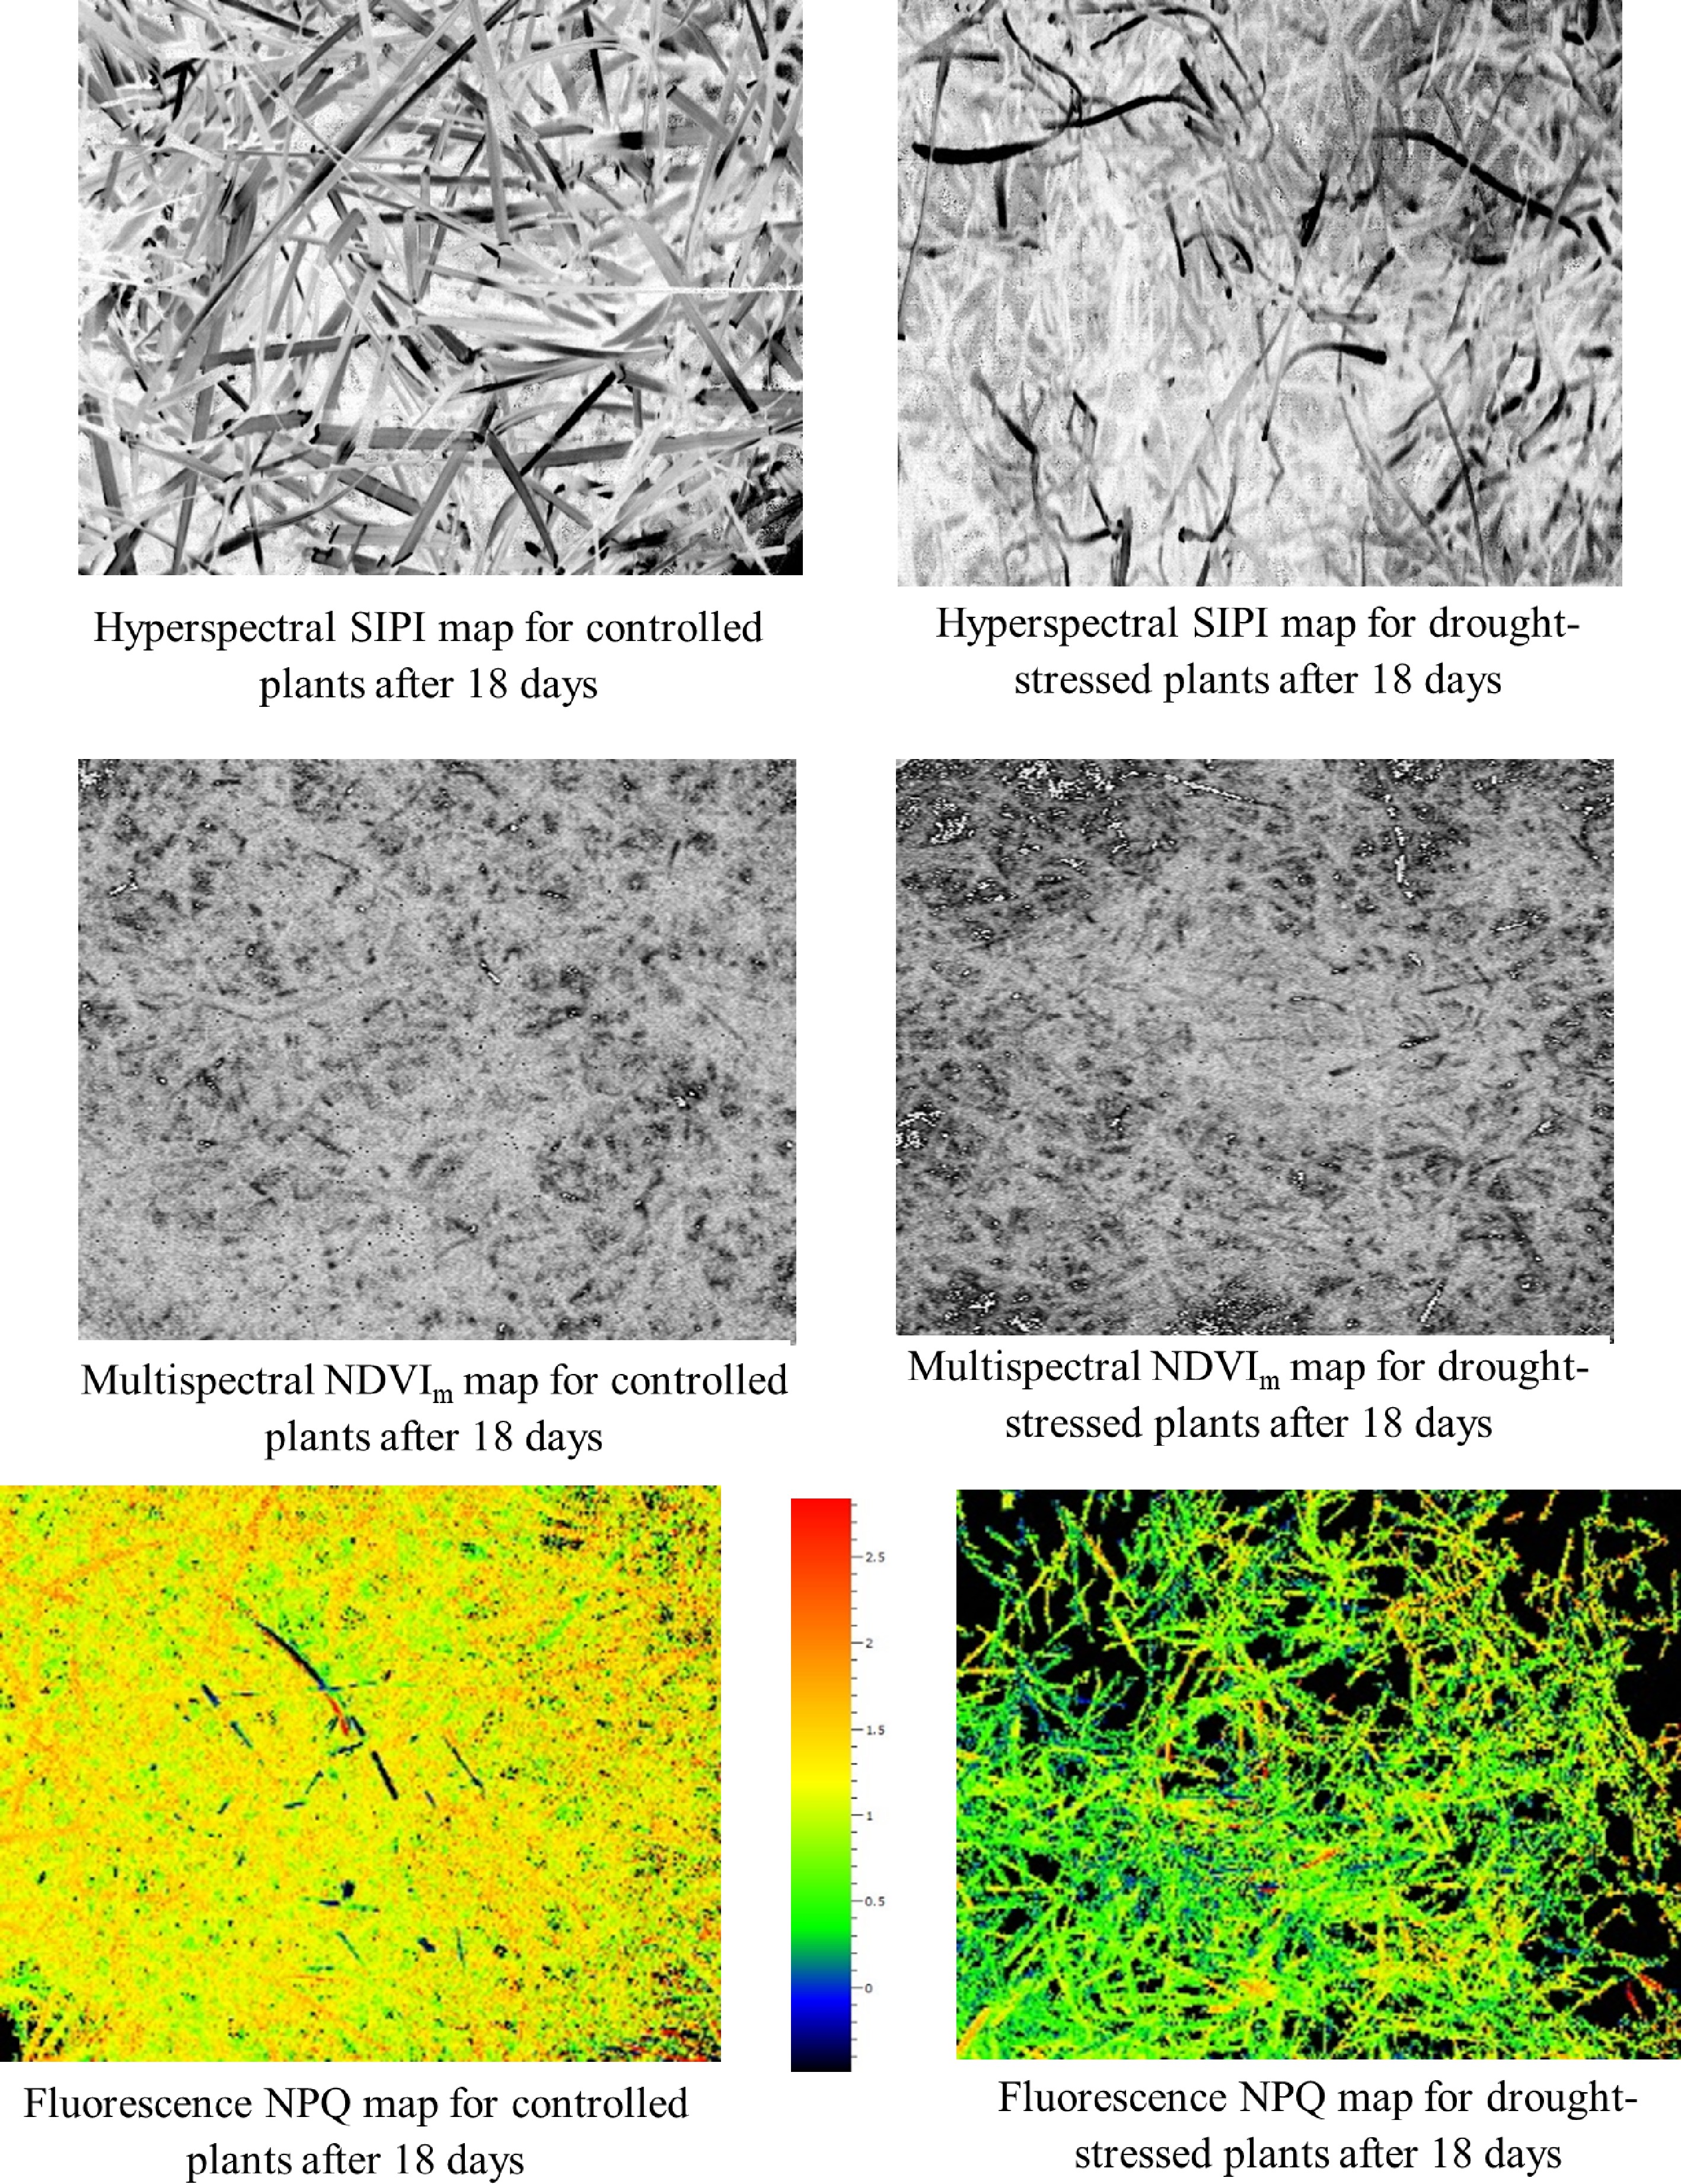
Figure 5.
Maps generated by the three most drought sensitive indices and parameters [hyperspectral structure independent pigment index (SIPI), multispectral normalized difference vegetation index (NDVIm) and chlorophyll fluorescence NPQ]. These maps clearly separated control and drought stress after 18 d of treatment when majorities of indices and parameters detected drought stress.
-
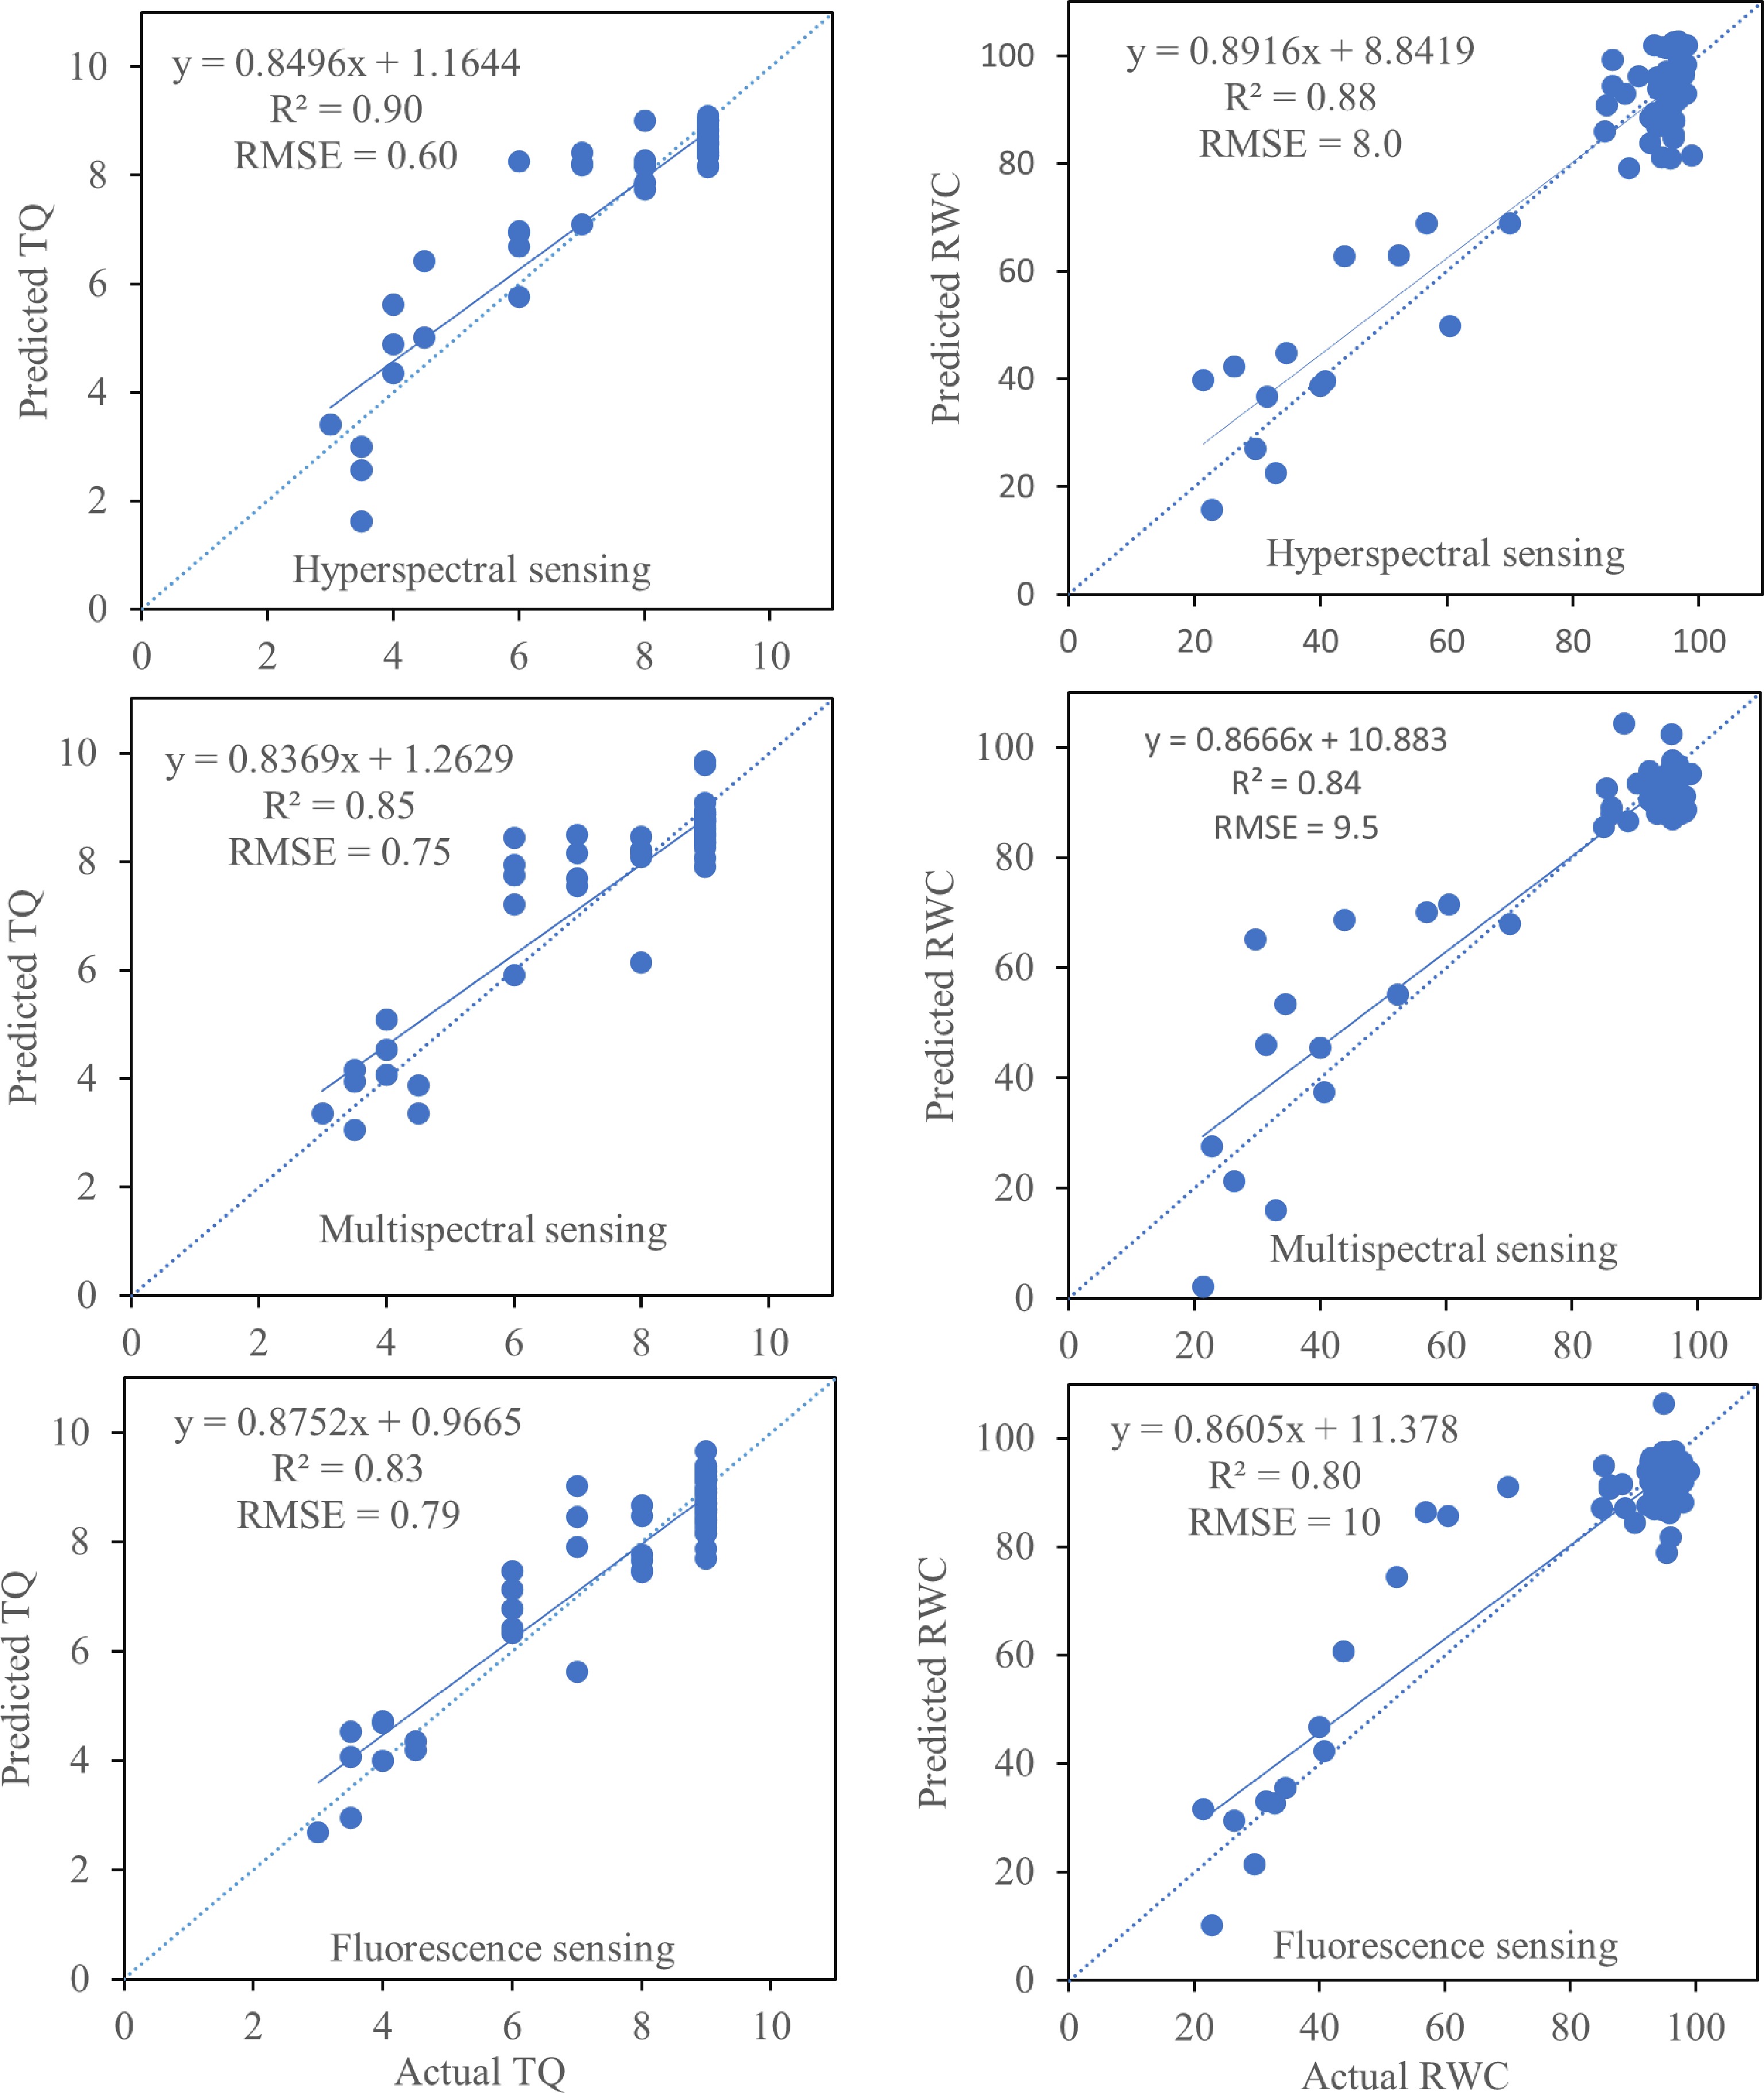
Figure 6.
Comparison of predicted turfgrass quality (TQ) and leaf relative water content (RWC) versus their measured values using partial least square regression model. Turfgrass quality and relative water contents were predicted using various indices generated by hyperspectral, multispectral and chlorophyll fluorescence sensing technologies. The dashed line represents the I:I line. Regression analysis was performed using all individual data points (five replications for each control and drought stress treatments).
-
Vegetation index Index abbreviation and formula Hyperspectral analysis Multispectral analysis Structure Independent Pigment Index SIPI = (R800 – R445) / (R800 + R680) SIPIm = (RNIR840 – RBlue444) / (RNIR840 + RRed668) Simple Ratio Index SRI = R800 / R675 SRIm = RNIR840 / RRed668 Plant Senescence Reflectance Index PSRI = (R680 –R500) / R750 PSRIm = (RRed668 – RBlue475) / RRededge740 Photochemical Reflectance Index PRI = (R570 – R531) / (R570 + R531) PRI = (RGreen560 – RGreen531) / (RGreen560 + RGreen531) Normalized Difference Vegetation Index NDVI = (R800 – R680) / (R800 + R680) NDVIm = (RNIR840 – RRed668) / (RNIR840 + RRed668) Normalized Difference Red Edge NDRE = (R750 – R705) / (R750 + R705) NDREm = (RRededge717 – RRed668) / (RRededge717 + RRed668) Table 1.
List of vegetation indices calculated using hyperspectral and multispectral image analysis for drought stress monitoring in Kentucky bluegrass. Name and number in subscript following the letter R in each formula represent the reflectance at individual light and particular wavelength.
-
Band name Central wavelength (nm) Band width (nm) Blue444 444 28 Blue475 475 32 Green531 531 14 Green560 560 27 Red650 650 16 Red668 668 14 RE705 705 10 RE717 717 12 RE740 740 18 NIR840 842 57 Table 2.
Spectral band details (center wavelength and band width) for Micasense Rededge-MX dual camera system.
-
Chlorophyll fluorescence parameter Formula Maximum photochemical efficiency of PSII (Fv / Fm) (Fm-Fo) / Fm Photochemical efficiency of open PSII centers
(F'v / F'm)(F'm – F'o) / F'm Actual photochemical quantum yield of PSII centers Y(PSII) (F'm – Fs) / F'm Photochemical quenching coefficient (Puddle model; qP) (F'm – Fs) / (F'm – F'o) Photochemical quenching coefficient (Lake model; qL) qP × F'o / Fs Non-photochemical quenching coefficient (qN) (Fm-F'm) / Fm Non-photochemical quenching (NPQ) (Fm-F'm) / F'm Chlorophyll fluorescence decrease ratio (Rfd) (Fm-Fs) / Fs Table 3.
Chlorophyll fluorescence parameters calculated from pulse amplitude modulated fluorescence imaging system.
-
RWC TQ FV/Fm F'v/F'm Y(PSII) NPQ qN qP qL Rfd SIPI SRI PSRI PRI NDVI NDRE WBI SIPIm PSRIm PRIm NDVIm NDREm RWC 1.00 TQ 0.95* 1.00 FV/Fm 0.87* 0.85* 1.00 F'v/F'm 0.81* 0.77* 0.95* 1.00 Y(PSII) 0.85* 0.74* 0.80* 0.74* 1.00 NPQ 0.88* 0.89* 0.95* 0.84* 0.75* 1.00 qN 0.84* 0.83* 0.96* 0.84* 0.77* 0.96* 1.00 qP 0.82* 0.70* 0.73* 0.66* 0.99* 0.69* 0.72* 1.00 qL 0.89* 0.81* 0.90* 0.86* 0.97* 0.83* 0.86* 0.95* 1.00 Rfd 0.84* 0.82* 0.89* 0.83* 0.77* 0.92* 0.86* 0.72* 0.83* 1.00 SIPI 0.84* 0.71* 0.63* 0.58* 0.51* 0.57* 0.69* 0.48* 0.60* 0.46* 1.00 SRI 0.57* 0.62* 0.44* 0.45* 0.33 0.41* 0.45* 0.30 0.40 0.33 0.83* 1.00 PSRI −0.83* −0.90* −0.90* −0.86* −0.76* −0.83* −0.87* −0.71* −0.86* −0.76* −0.75* −0.57* 1.00 PRI 0.94* 0.82* 0.80* 0.76* 0.71* 0.79* 0.71* 0.66* 0.77* 0.78* 0.26 0.17 −0.78* 1.00 NDVI 0.53* 0.65* 0.41* 0.43* 0.41* 0.42* 0.40 0.38 0.43* 0.42* 0.50* 0.42* −0.54* 0.31 1.00 NDRE 0.64* 0.73* 0.64* 0.63* 0.45* 0.54* 0.64* 0.40 0.56* 0.44* 0.92* 0.85* −0.75* 0.33 0.50* 1.00 SIPIm 0.52* 0.50* 0.56* 0.58* 0.47* 0.52* 0.49* 0.43* 0.52* 0.51* 0.33 0.28 −0.58* 0.61* 0.27 0.39 −0.28 1.00 PSRIm −0.92* −0.85* −0.85* −0.85* −0.83* −0.80* −0.77* −0.79* −0.88* −0.77* −0.40 −0.23 0.77* −0.82* −0.41 −0.40 0.32 −0.52* 1.00 PRIm 0.20 −0.03 0.06 −0.01 0.28 0.14 0.11 0.31 0.20 0.18 0.05 0.10 0.01 −0.04 0.00 0.09 0.06 0.09 −0.04 1.00 NDVIm 0.75* 0.74* 0.77* 0.78* 0.67* 0.72* 0.68* 0.62* 0.73* 0.70* 0.43* 0.33 −0.76* 0.81* 0.37 0.47* −0.35 0.93* −0.76* −0.05 1.00 NDREm 0.90* 0.89* 0.89* 0.89* 0.81* 0.83* 0.81* 0.76* 0.88* 0.81* 0.52* 0.41* −0.87* 0.87* 0.45* 0.53* −0.32 0.62* −0.87* −0.04 0.85* 1.00 Details for individual abbreviations of vegetation indices and fluorescence parameters used in this table were previously mentioned in Tables 1 & 3. Some other abbreviations are: RWC, leaf relative water content; and TQ, turfgrass quality. Values followed by * indicate significant correlation at p ≤ 0.05. Correlation analysis was performed using all individual data points (five replications for each control and drought stress treatments). Table 4.
Correlations among several physiological traits, vegetation indices and chlorophyll fluorescence parameters.
-
Sensing technology used for prediction Predicted
variableNo. of predictors used Predictor variables Root mean
PRESSPercent variation explained
for cumulative YCumulative Q2 Hyperspectral TQ 4 PRI, PSRI, NDRE, SIPI 0.36 87 0.99 RWC 4 PRI, PSRI, NDRE, SIPI 0.38 89 0.99 Multispectral TQ 3 PSRIm, NDVIm, NDREm 0.44 85 0.97 RWC 3 PSRIm, NDVIm, NDREm 0.40 86 0.97 Chlorophyll fluorescence TQ 4 Fv/Fm, NPQ, qN, qL 0.46 83 0.95 RWC 3 Fv/Fm, NPQ, qL 0.59 84 0.93 Table 5.
Summary of partial least square model showing predictability of individual models using specific numbers of predictor variables (identified by leave one out cross validation) generated by different sensing technologies. Details of individual abbreviations are mentioned in previous tables. Partial least square was performed using all individual data points (five replications for each control and drought stress treatments).
Figures
(6)
Tables
(5)