-
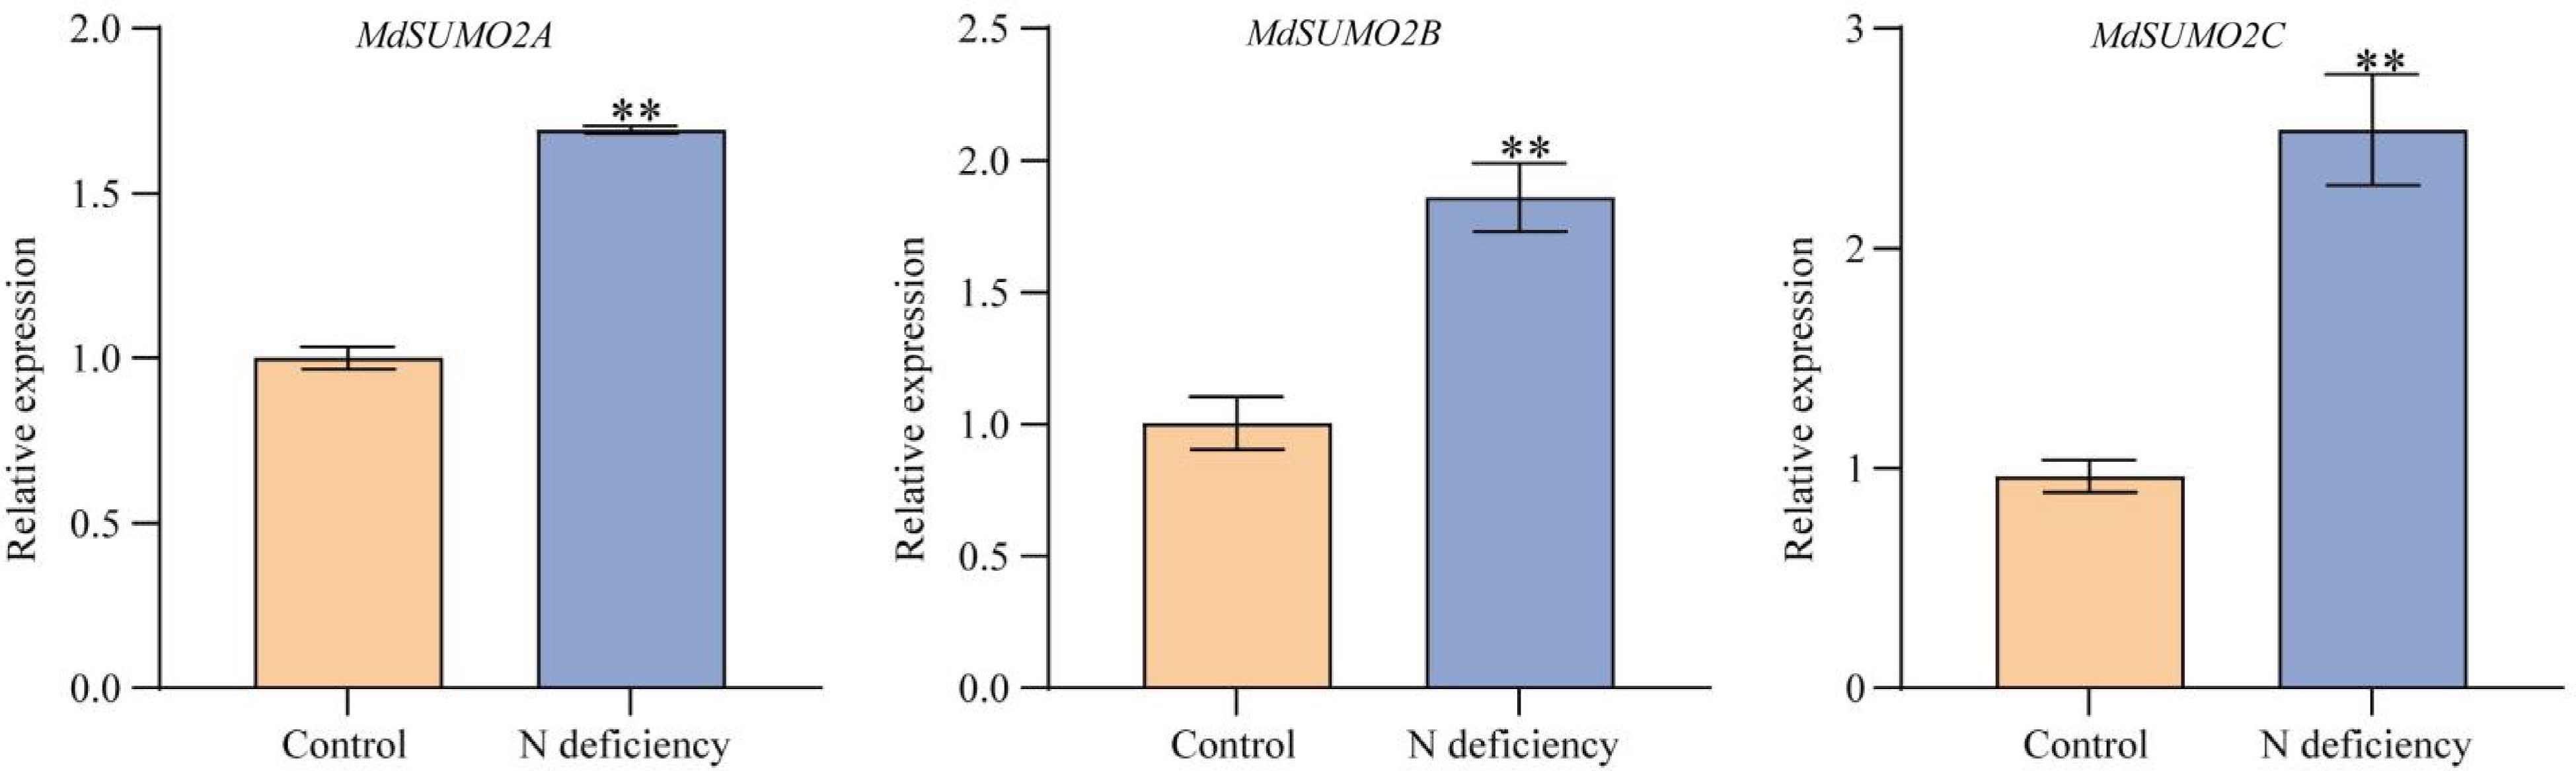
Figure 1.
Expression patterns of MdSUMO2s in apple under N deficient conditions. Hydroponically-cultured GL-3 were treated with normal (6 mM) or low nitrate (0.2 mM) for 4 d. Root samples were collected and used for gene expression analysis. Error bars indicate SD, n = 3. Asterisks indicate statistically significant differences. Student's t test was performed and statistically significant differences were indicated by *p ≤ 0.05, **p ≤ 0.01.
-
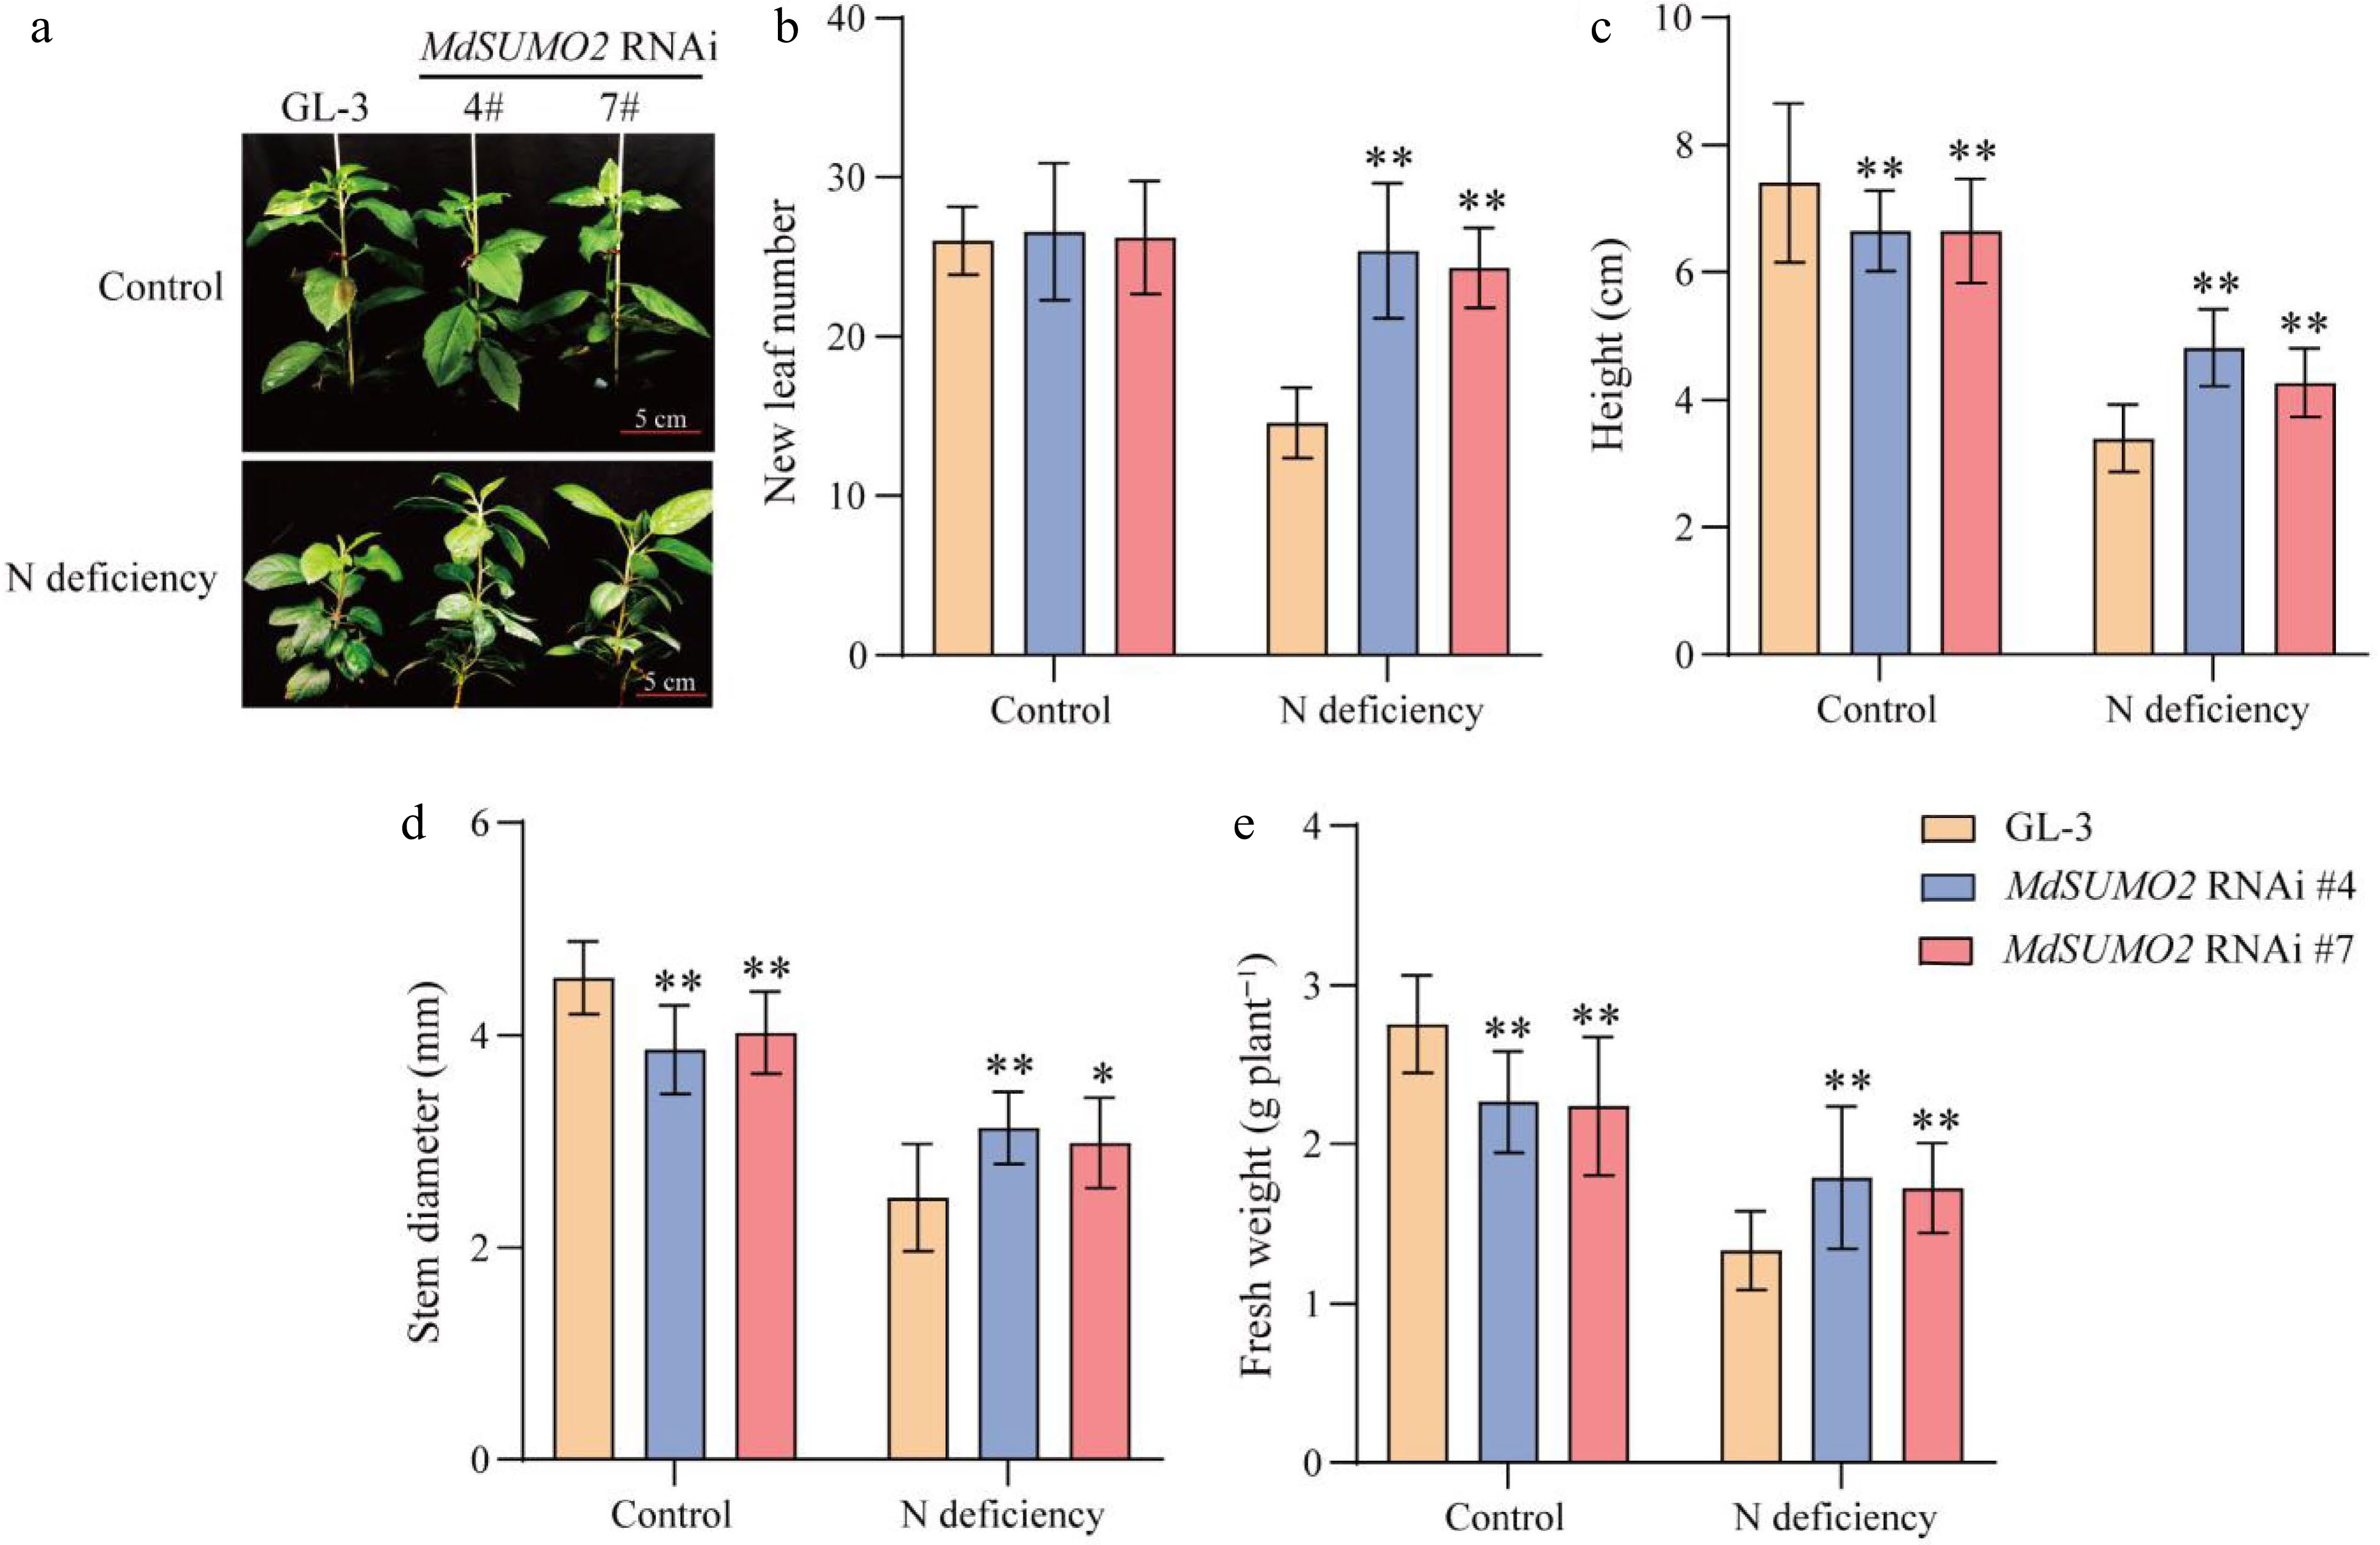
Figure 2.
The MdSUMO2 RNAi transgenic apple plants are more tolerance than the wild type (GL-3) under N deficient conditions. (a) Morphology of three-monthold MdSUMO2 RNAi transgenic apple plants and GL-3 treated with normal nitrogen (Control, 10 mM KNO3, and low nitrogen (N deficient, 0.2 mM KNO3) under hydroponic culture. Scale bars = 5 cm. (b) New leaf number, (c) height, (d) stem diameter, (e) fresh weight in (a). Error bars indicate SD, n = 12 in (b)−(e). Asterisks indicate significant differences between MdSUMO2 RNAi transgenic apple plants and GL-3 plants in each group (control and N deficiency). Student's t test was performed and statistically significant differences were indicated by *p ≤ 0.05, **p ≤ 0.01.
-
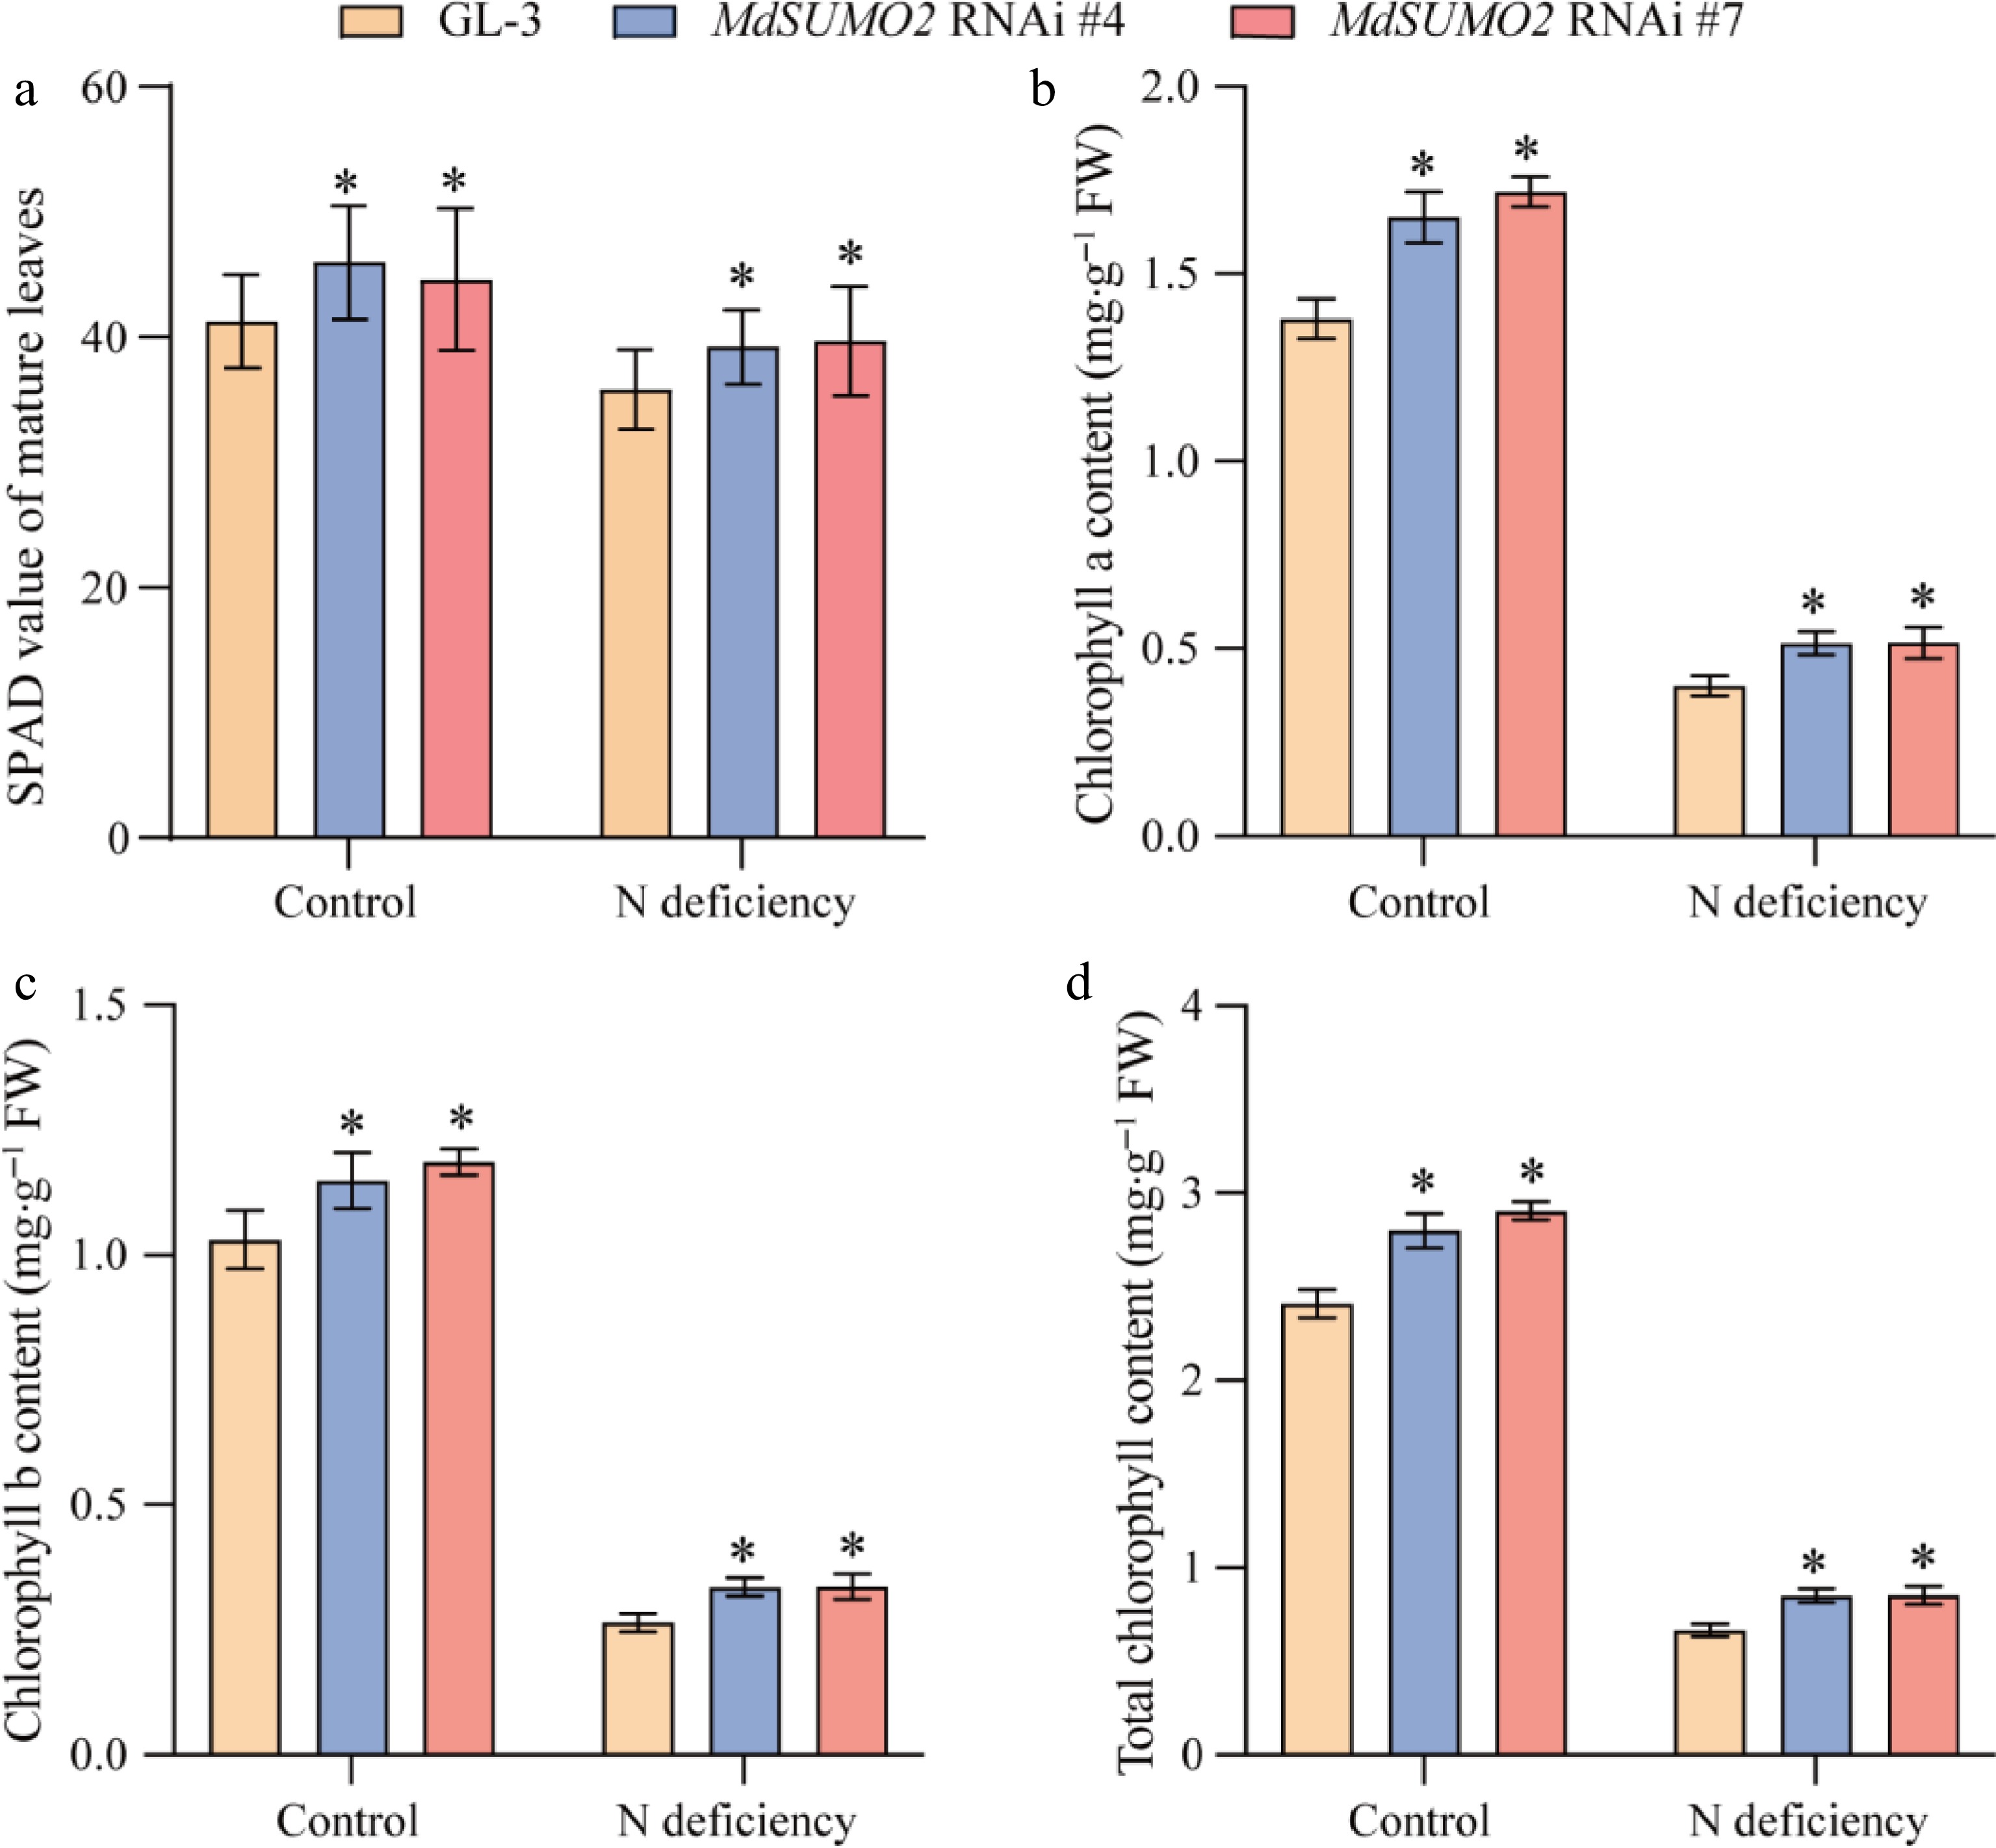
Figure 3.
The MdSUMO2 RNAi transgenic apple plants displayed darker green leaves than the wild type (GL-3) under N deficient conditions. (a) The SPAD value of leaves in response to N deficiency in MdSUMO2 RNAi transgenic apple plants and GL-3. (b) Chlorophyll a, (b) chlorophyll b, and (c) total chlorophyll content of leaves in MdSUMO2 RNAi transgenic apple plants and GL-3 under N deficient conditions. Error bars indicate SD, n = 12 in (a)−(d). Asterisks indicate significant differences between MdSUMO2 RNAi transgenic apple plants and GL-3 plants in each group (control and N deficiency). Student's t test was performed and statistically significant differences were indicated by *p ≤ 0.05, **p ≤ 0.01.
-
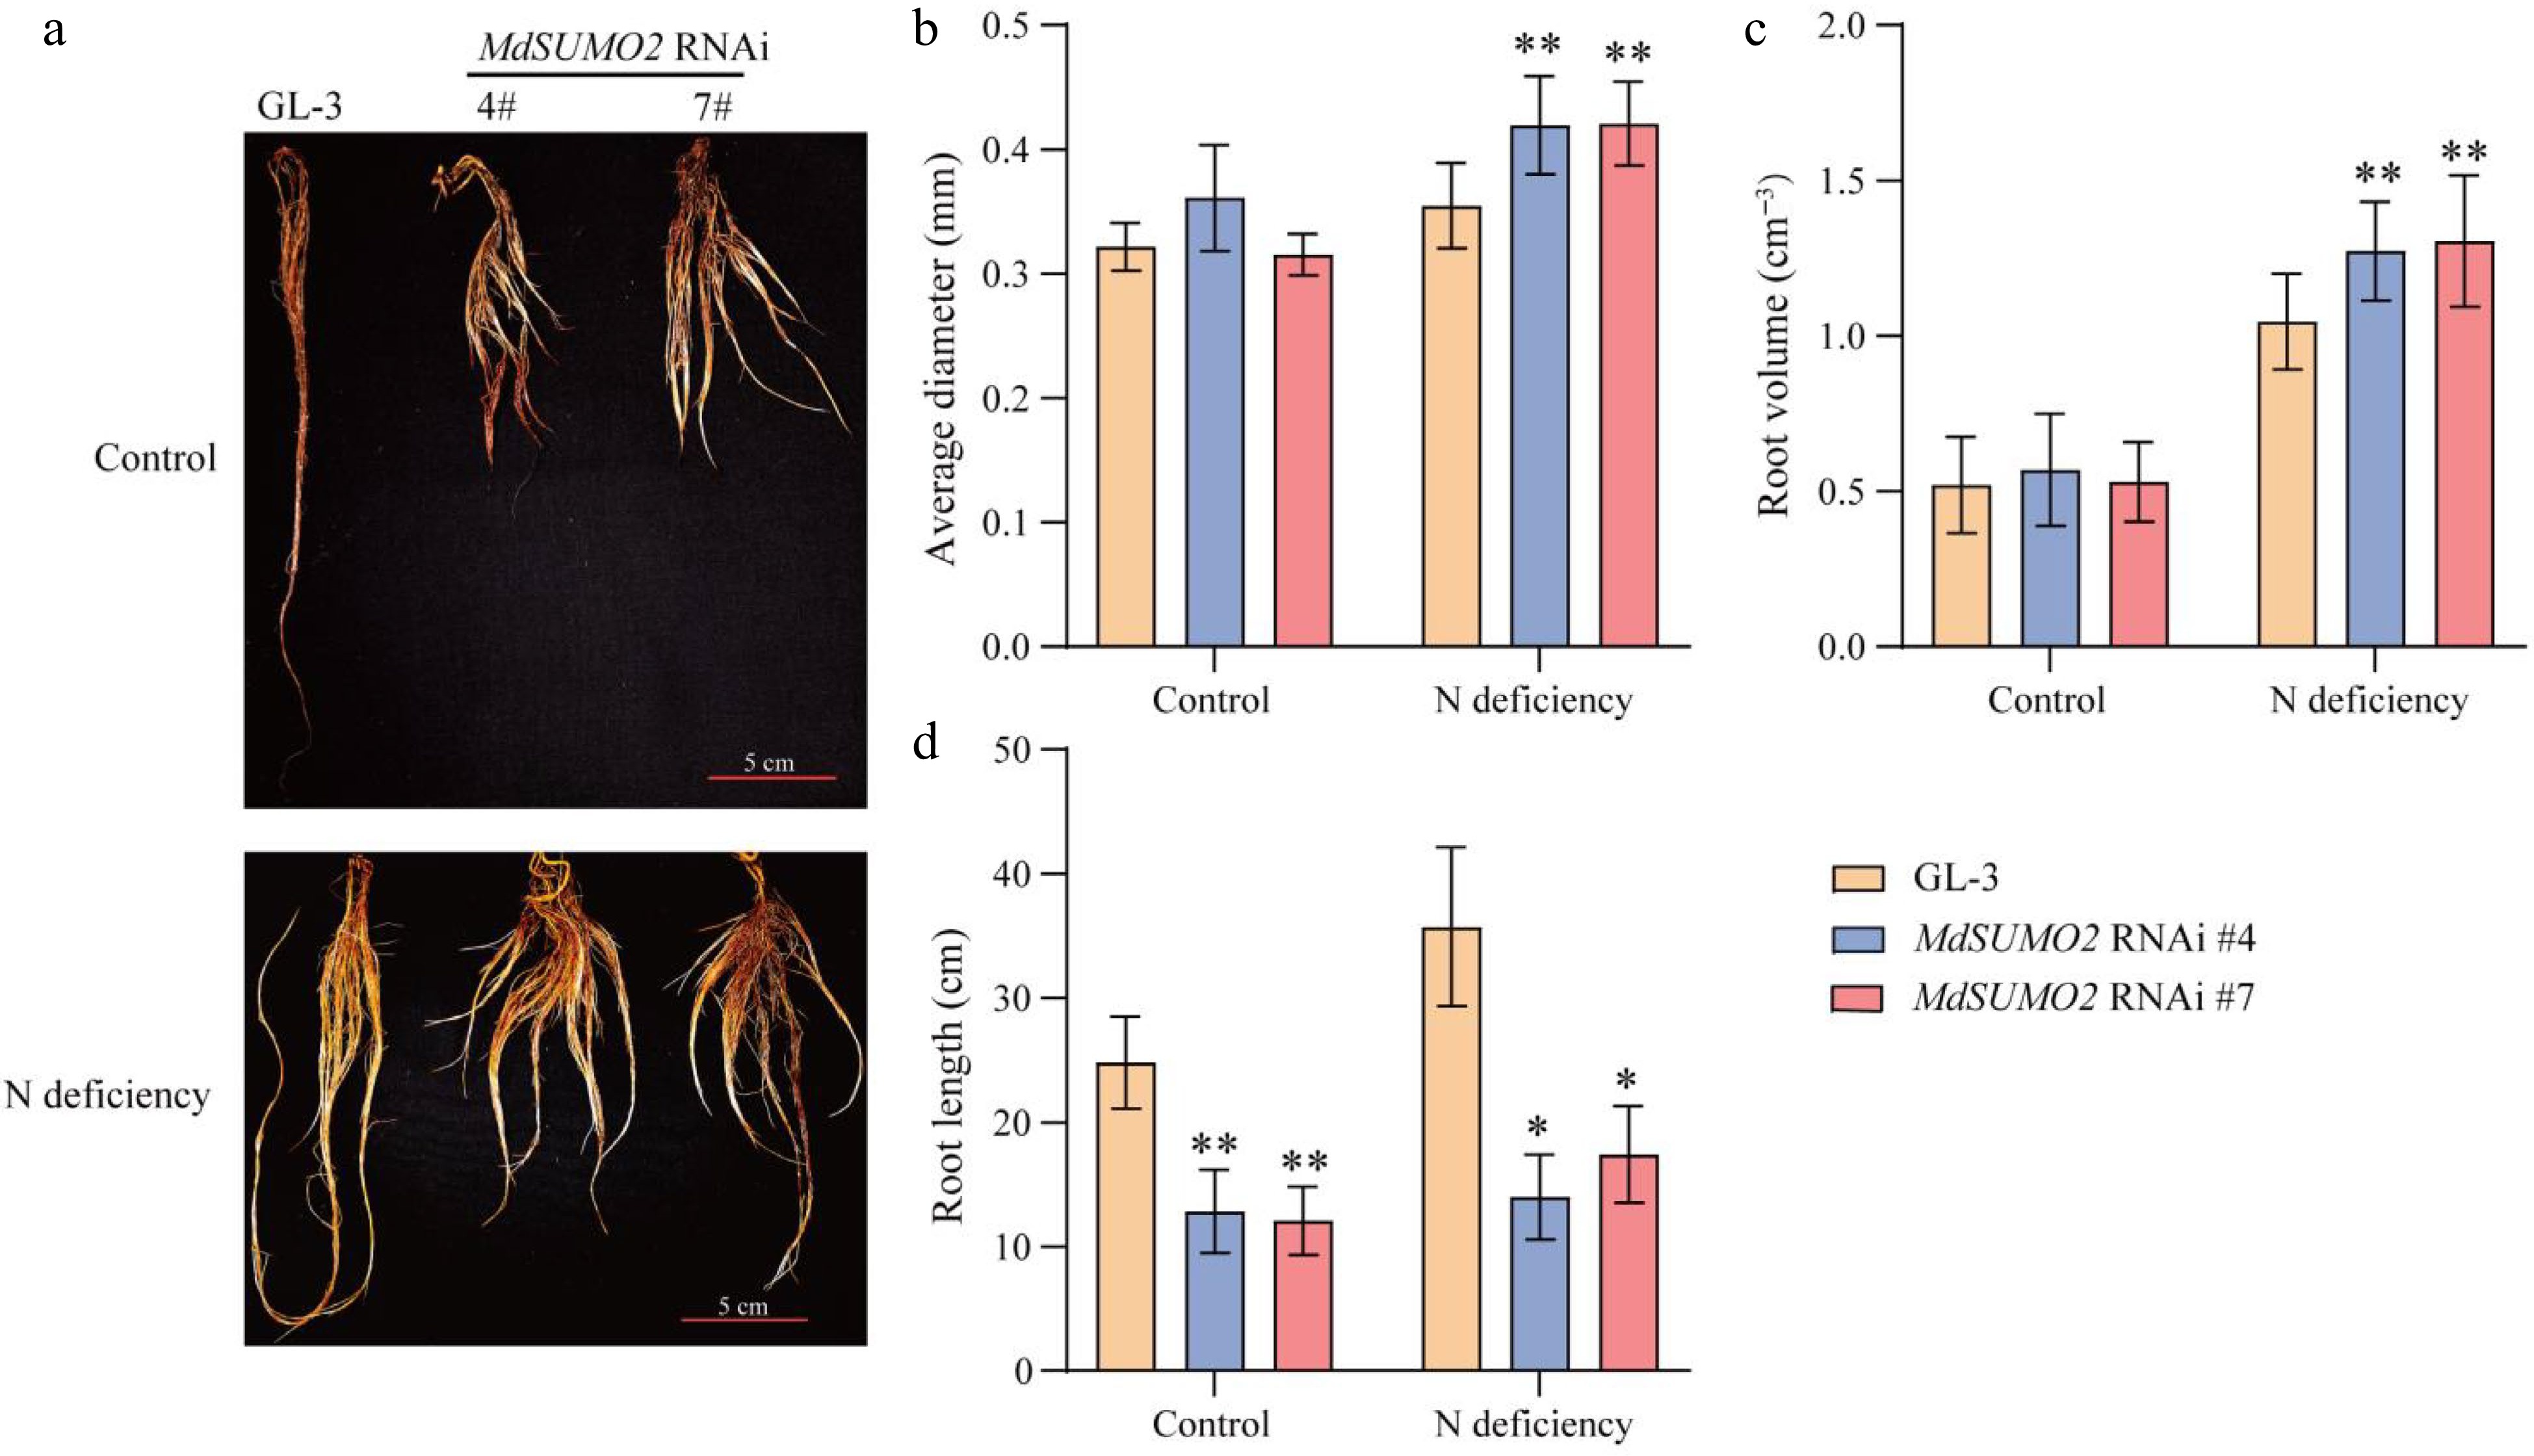
Figure 4.
MdSUMO2 regulates root system in response to N deficient conditions. (a) Morphological characteristics of the root system in three-month-old MdSUMO2 RNAi transgenic apple plants and GL-3 treated with normal nitrogen (Control, 10 mM KNO3), and low nitrogen (N deficiency, 0.2 mM KNO3) under hydroponic culture. Scale bars = 5 cm. (b) Average diameter, (c) root volume, and (d) root length in (a). Error bars indicate SD, n = 12 in (b)−(d). Asterisks indicate significant differences between MdSUMO2 RNAi transgenic apple plants and GL-3 plants in each group (control and N deficiency). Student's t test was performed and statistically significant differences were indicated by *p ≤ 0.05, **p ≤ 0.01.
-
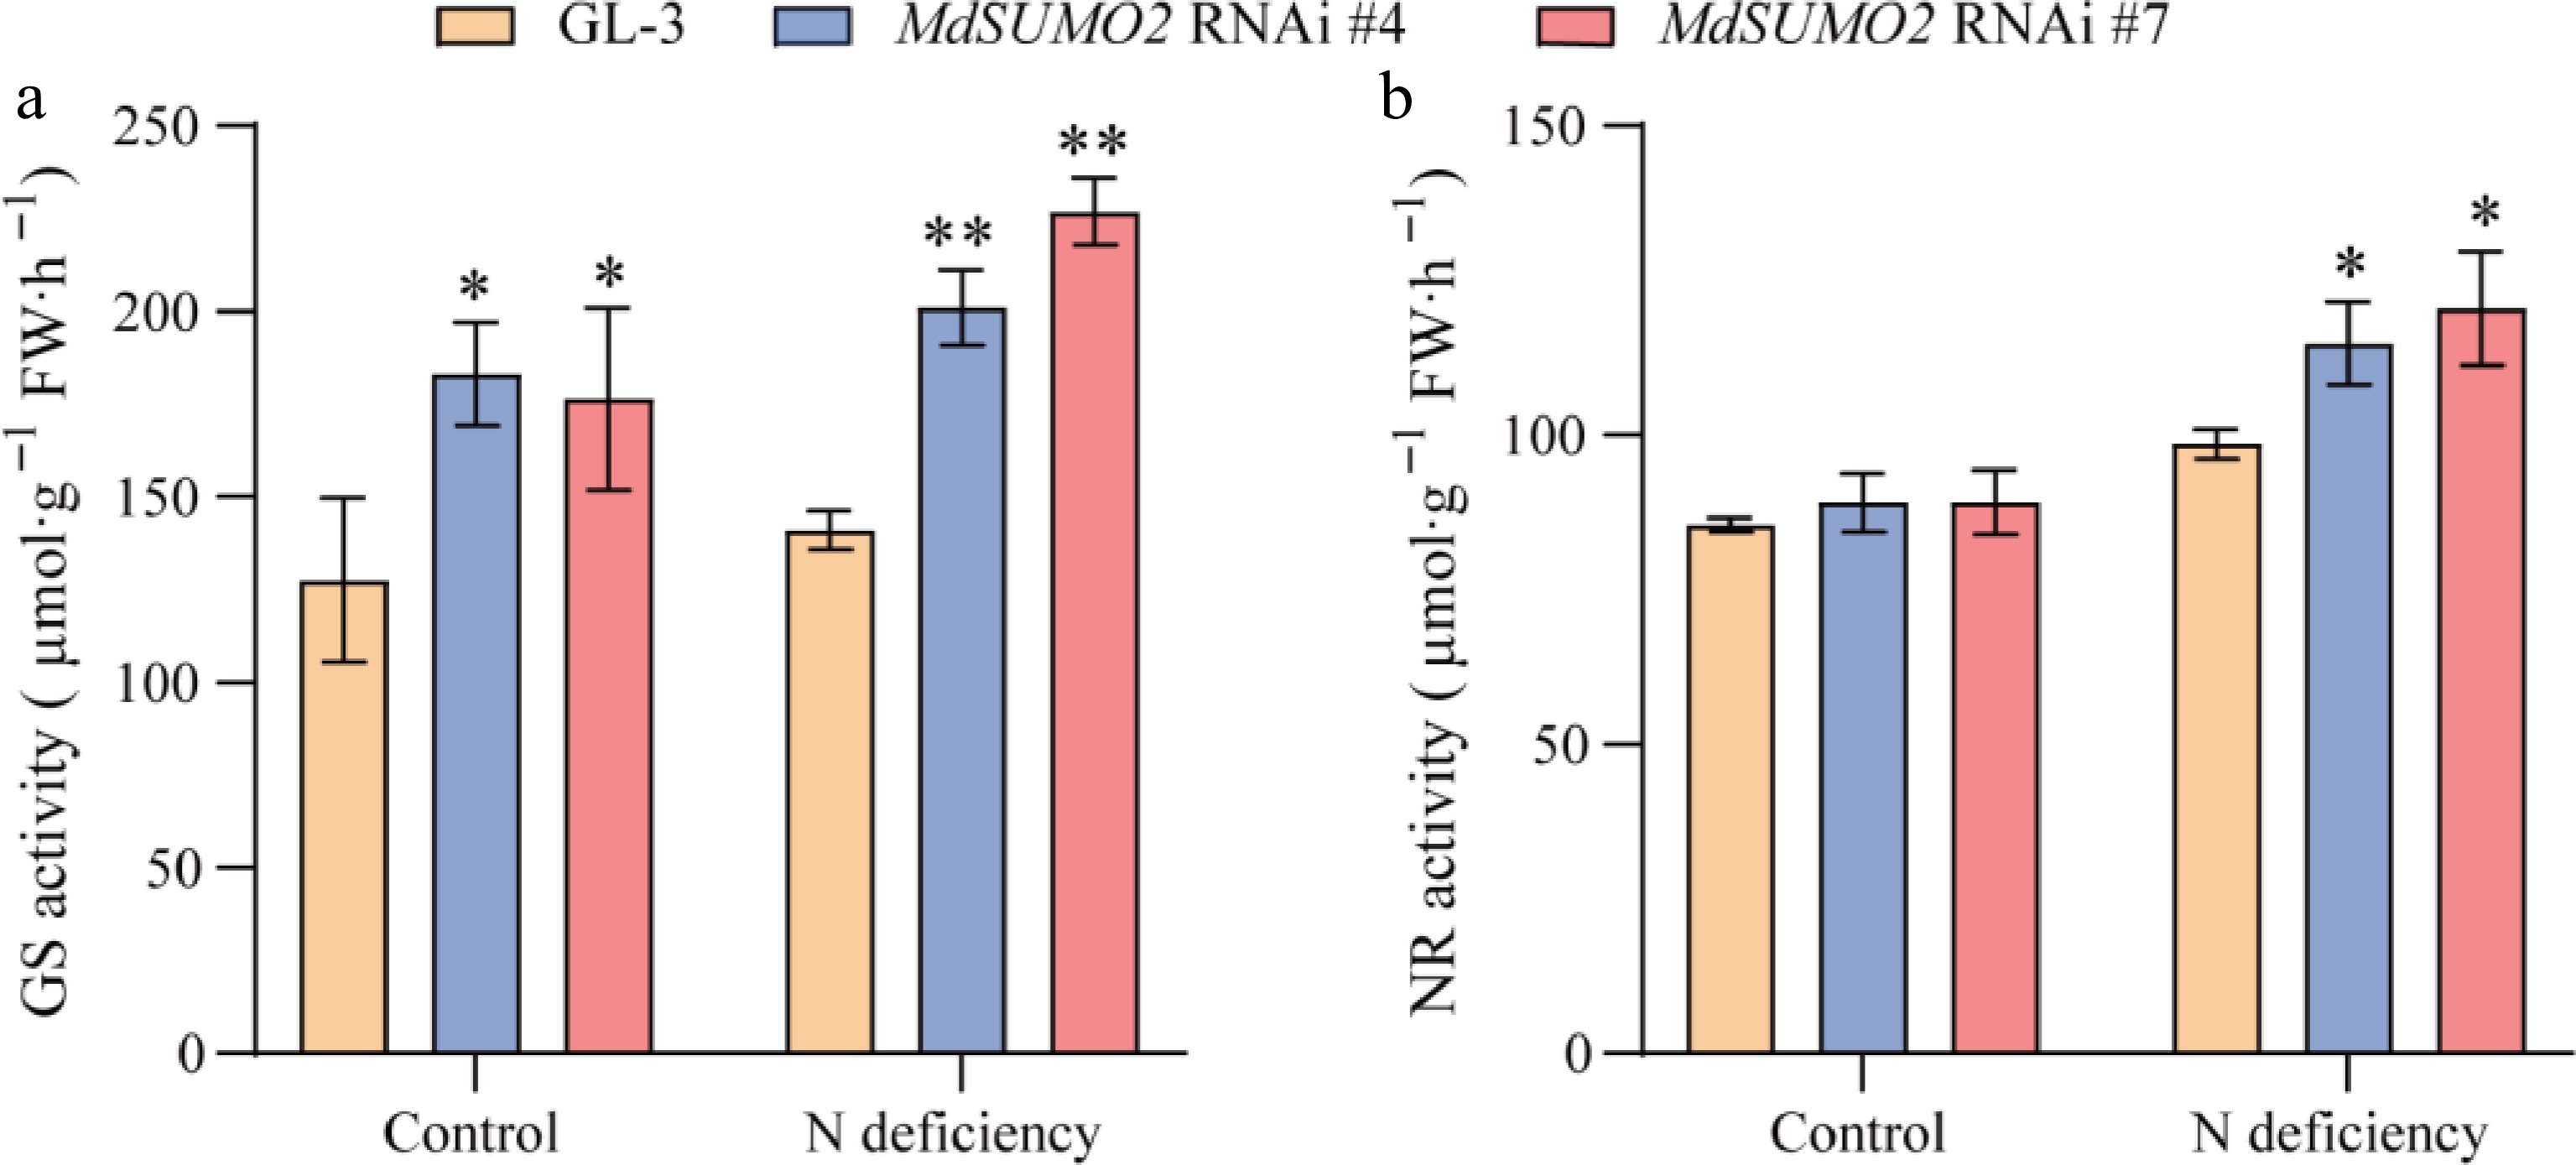
Figure 5.
Activated glutamine synthetase and nitrate reductase in root contribute to the tolerance of MdSUMO2 RNAi transgenic apple plants in response to N deficiency. (a) Glutamine synthetase (GS) activity in MdSUMO2 RNAi transgenic apple plants and GL-3 under control and N deficient conditions. (b) Nitrate reductase (NR) activity in MdSUMO2 RNAi transgenic apple plants and GL-3 under control and N deficient conditions. Error bars indicate SD, n = 3 in (a) and (b). Asterisks indicate significant differences between MdSUMO2 RNAi transgenic apple plants and GL-3 plants in each group (control and N deficiency). Student's t test was performed and statistically significant differences were indicated by *p ≤ 0.05, **p ≤ 0.01.
-
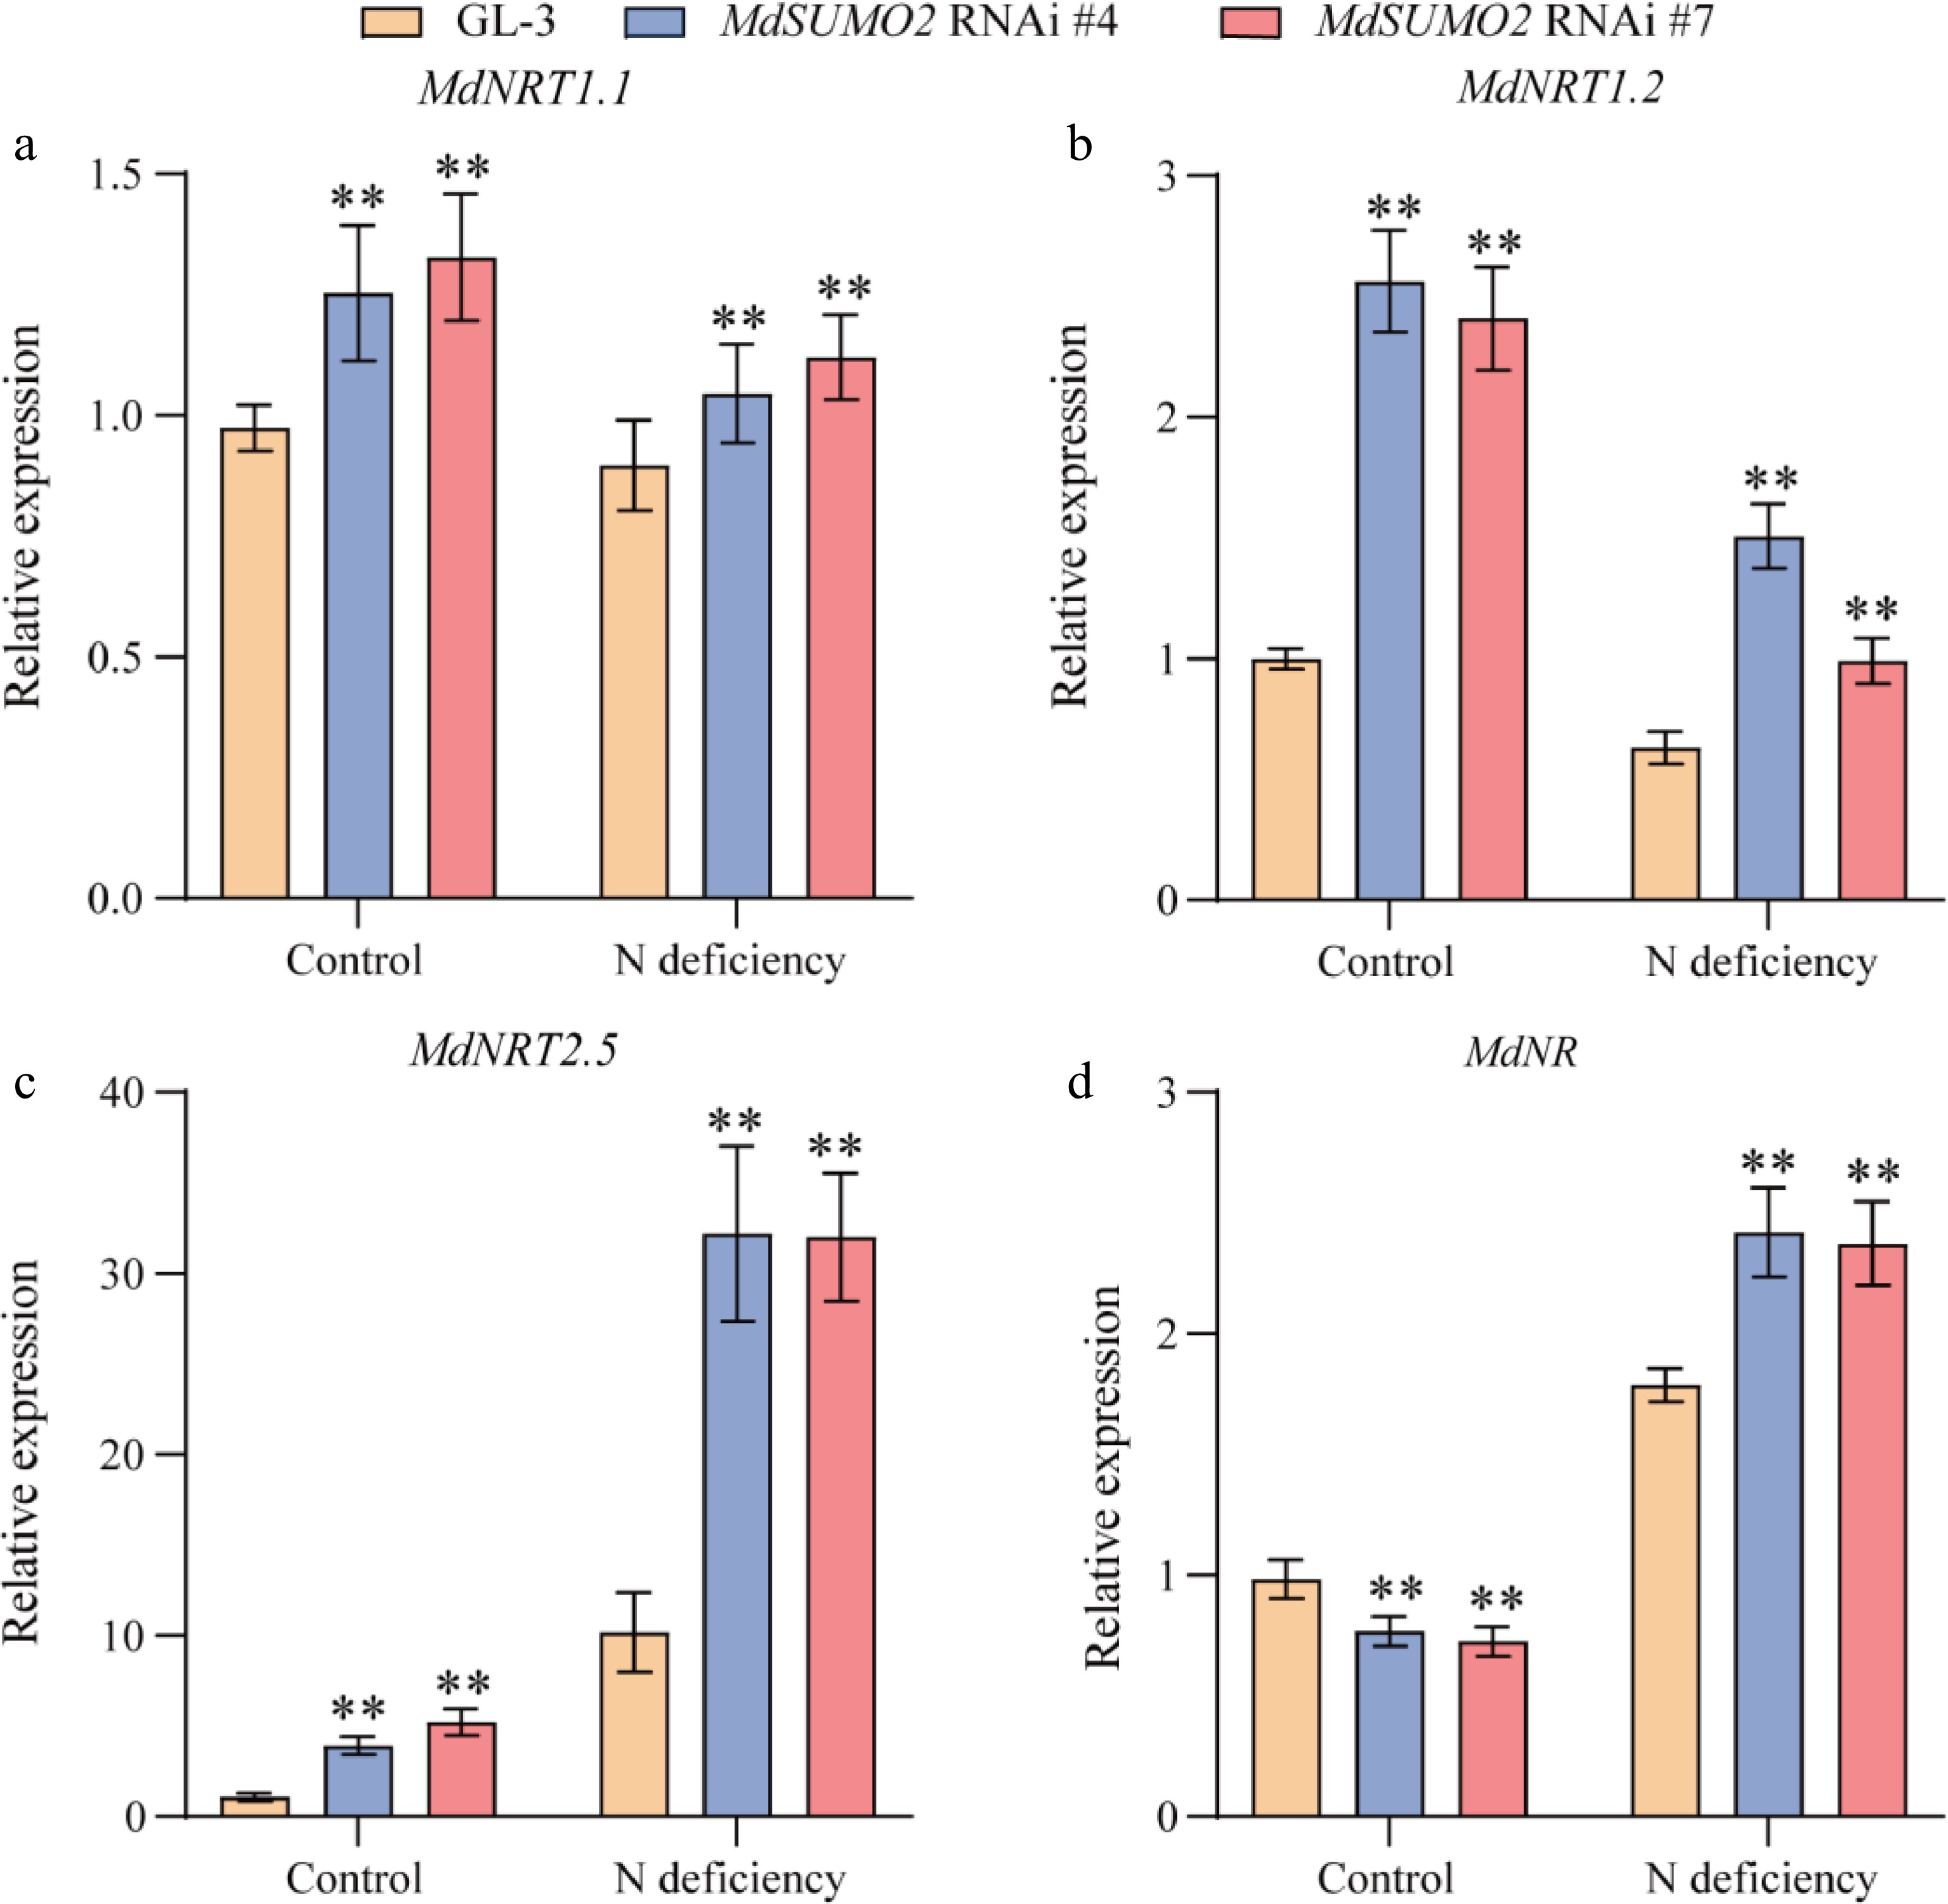
Figure 6.
Genes involved in nitrogen assimilation show a response in the MdSUMO2 RNAi transgenic apple plants under N deficient conditions. Relative expression levels of (a) MdNRT1.1, (b) MdNRT1.2, (c) MdNRT2.5 and (d) MdNR in the root under control and N deficient conditions. Error bars indicate SD, n = 3 in (a)−(d). Asterisks indicate significant differences between MdSUMO2 RNAi transgenic apple plants and GL-3 plants in each group (control and N deficient). Student's t test was performed and statistically significant differences were indicated by *p ≤ 0.05, **p ≤ 0.01.
-
Gene name Forward primer Reverse primer Purpose MdSUMO2C GCACAGAAGAAACCCCTGGAT CACTTCATTACCATCCTGCCCT qRT-PCR analysis MdSUMO2A GTGTTTGGAAGTGGTGGTAGCTC TCTTGTCCTCCTCCTGGTTCG qRT-PCR analysis MdSUMO2B CGACTCCGCAGCAAGAAGAG CTTCAGCTGAGTGCTTCGC qRT-PCR analysis MdSUMO2-RNAi GGGGACAAGTTTGTACAAAAAAGCAGGCTTC
TCAGGCGTCACGAACCAGGGGGGACCACTTTGTACAAGAAAGCTGGGTCGC
TGGGTACTTCTCTTGATCCTGAPlasmid construction of MdSUMO2 RNAi MdNRT1.1 ACGGGCACCACGCACTTG GGTTGGAGGCTGGGGACTG qRT-PCR analysis MdNRT1.2 TCCCTATCTTCCCCGTACTCTTC GGAGTTGGTCGCTACACGCT qRT-PCR analysis MdNRT2.5 CGTTCCACCTGTCTTGGTTTTC CGATGTCGCTGGCGGTTAG qRT-PCR analysis MdNR TGACGATAGCGTTGTCCAGG AGTGAGGCGGACCATTGAAG qRT-PCR analysis Table 1.
Sequences of primers used in this study.
Figures
(6)
Tables
(1)