-
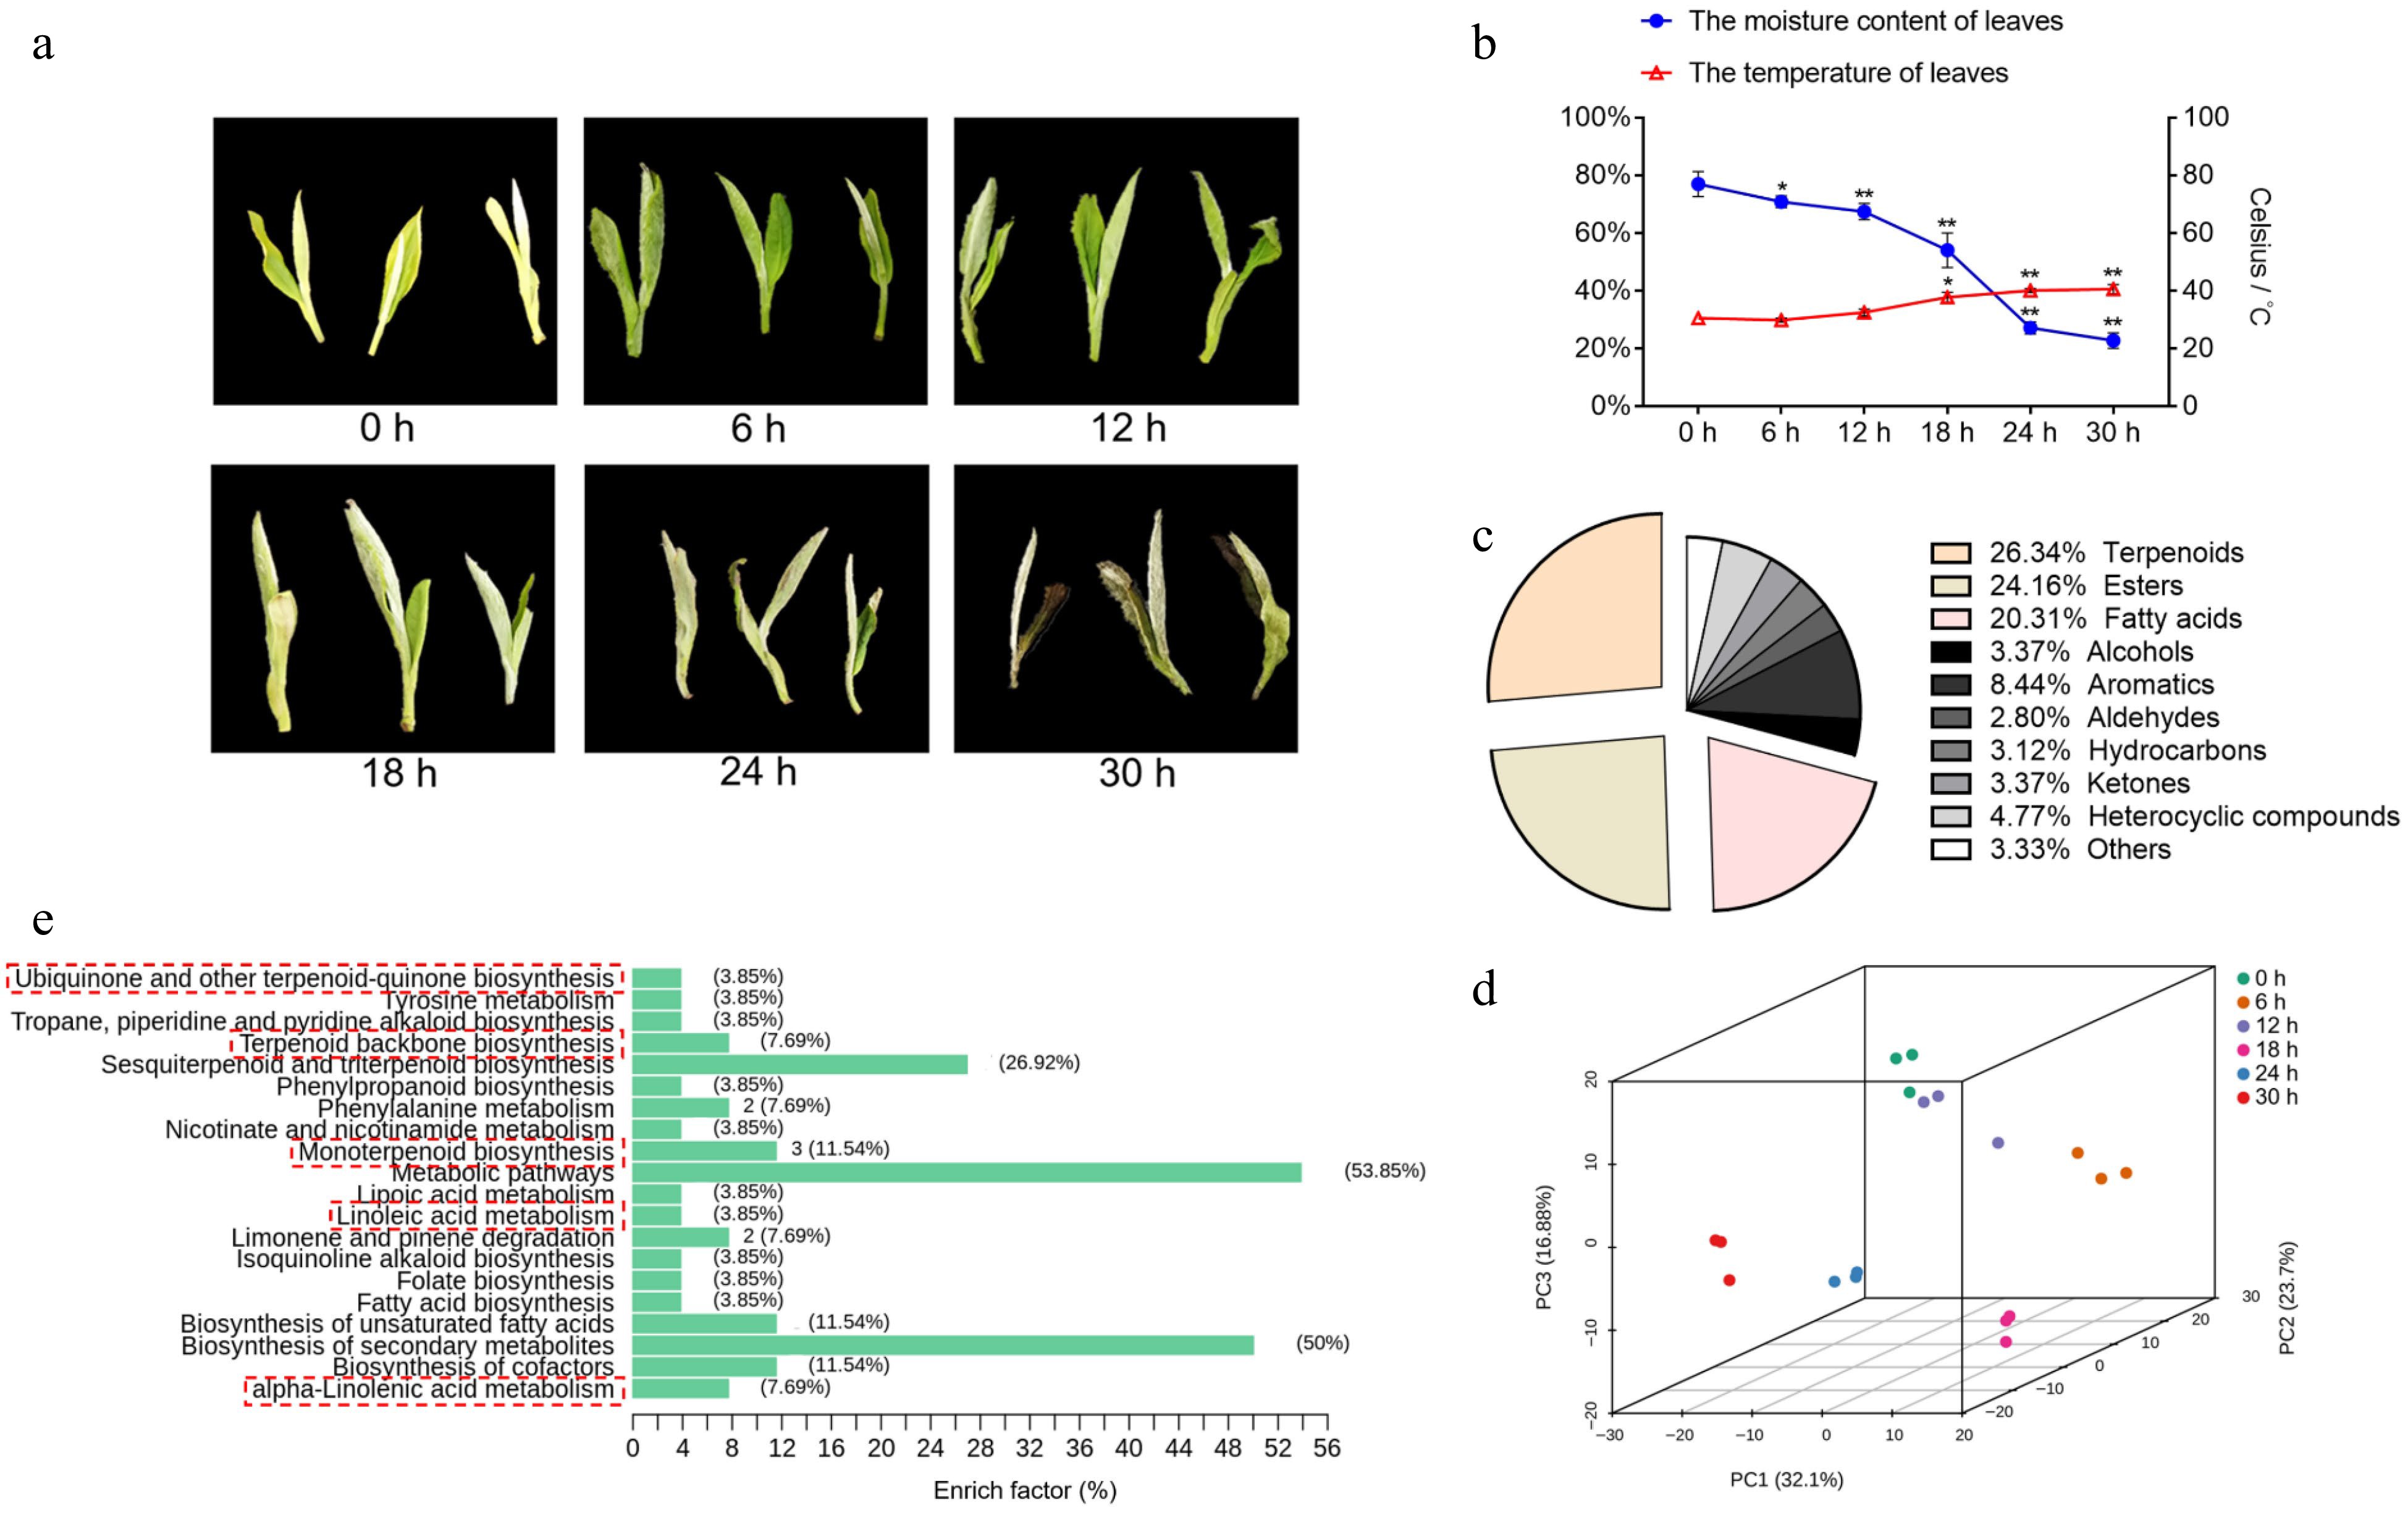
Figure 1.
Tea plant leaves changes in water content, temperature and overview of nonvolatile com-pounds. (a) The phenotype of the picked tea leaves at 0, 6, 12, 18, 24, and 30 h. (b) The moisture content and temperature of tea leaves following withering for different time periods. Data represent the mean value ± standard deviation (n = 3), *, p < 0.05 compared with the sample of 0 h; **, p < 0.01 compared with the sample of 0 h. (c) The proportion of total content of various volatile substances in tea plant leaves during withering. (d) Principal component analysis score plot of tea leaves with different withering times (0, 6, 12, 18, 24, and 30 h). (e) KEGG classification of differential metabolites during withering.
-
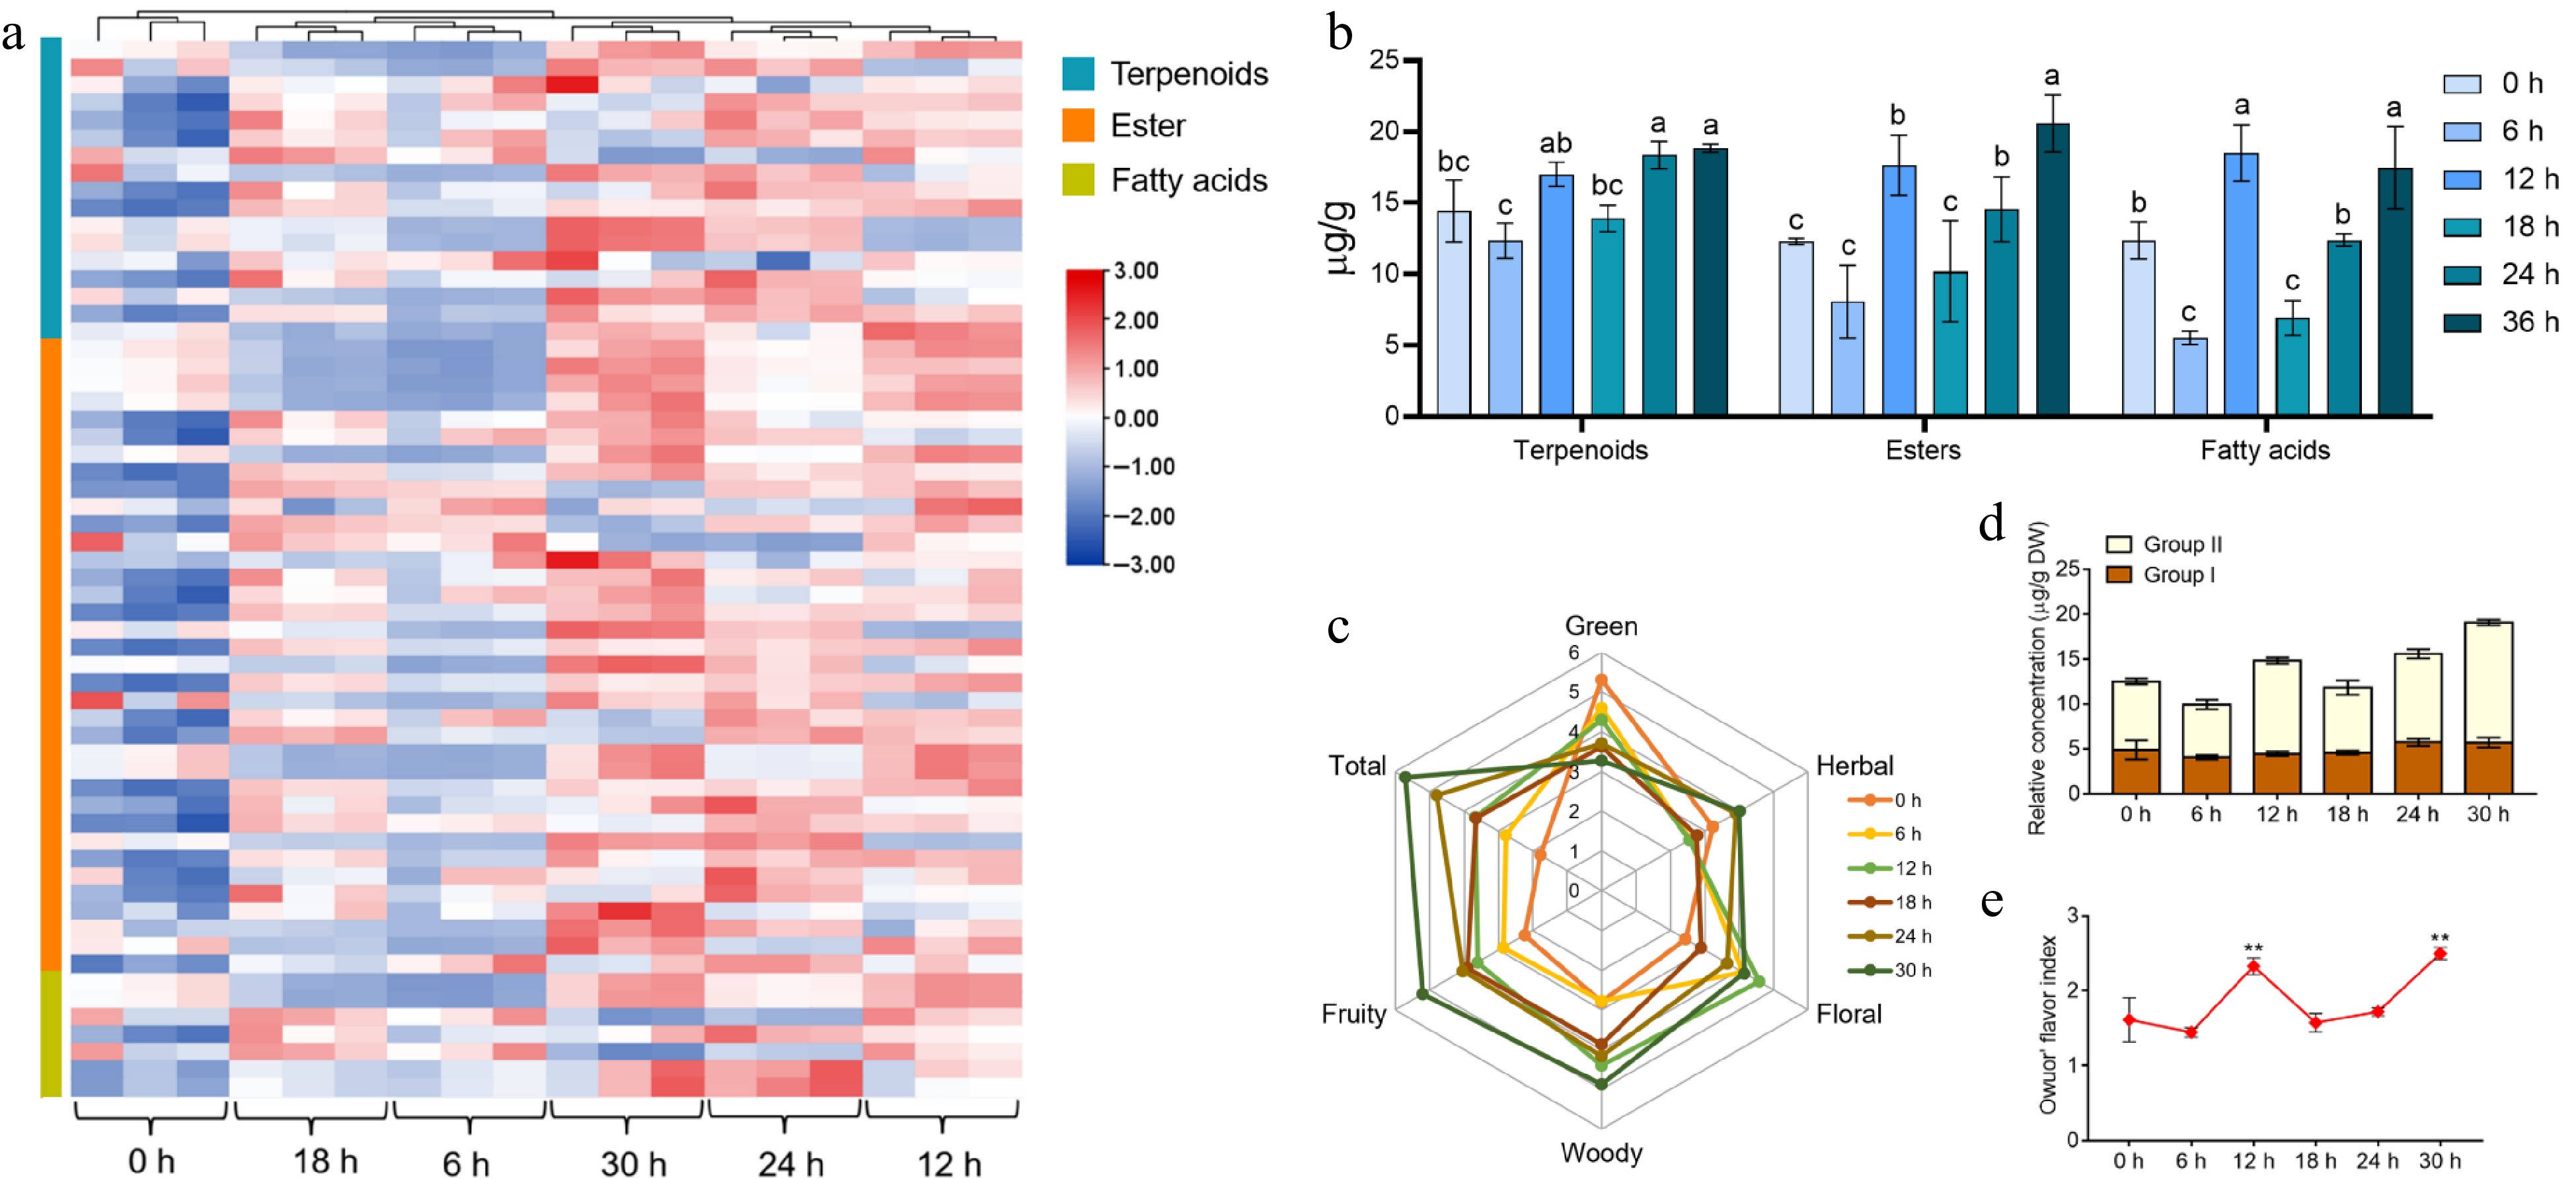
Figure 2.
The variation rules of the main aroma substances and the assessment of aroma quality in tea leaves during the withering process. (a) Heat map of the types and contents of terpenes, esters, and acids volatiles detected in different samples. (b) Trends in volatiles of terpenoids, esters and fatty acids in tea leaves at different withering periods. (c) Aroma profile of different withering time points. (d), (e) The change in Owuor's flavor index during withering. The calculation of the Owuor's flavor index was based on the aroma compounds in Supplemental Table S3. Data represent the mean value ± SD (n = 3); Values with different letters (a–c) differ from each other significantly (different periods for the same component). **, p < 0.01 compared with the sample of 0 h.
-
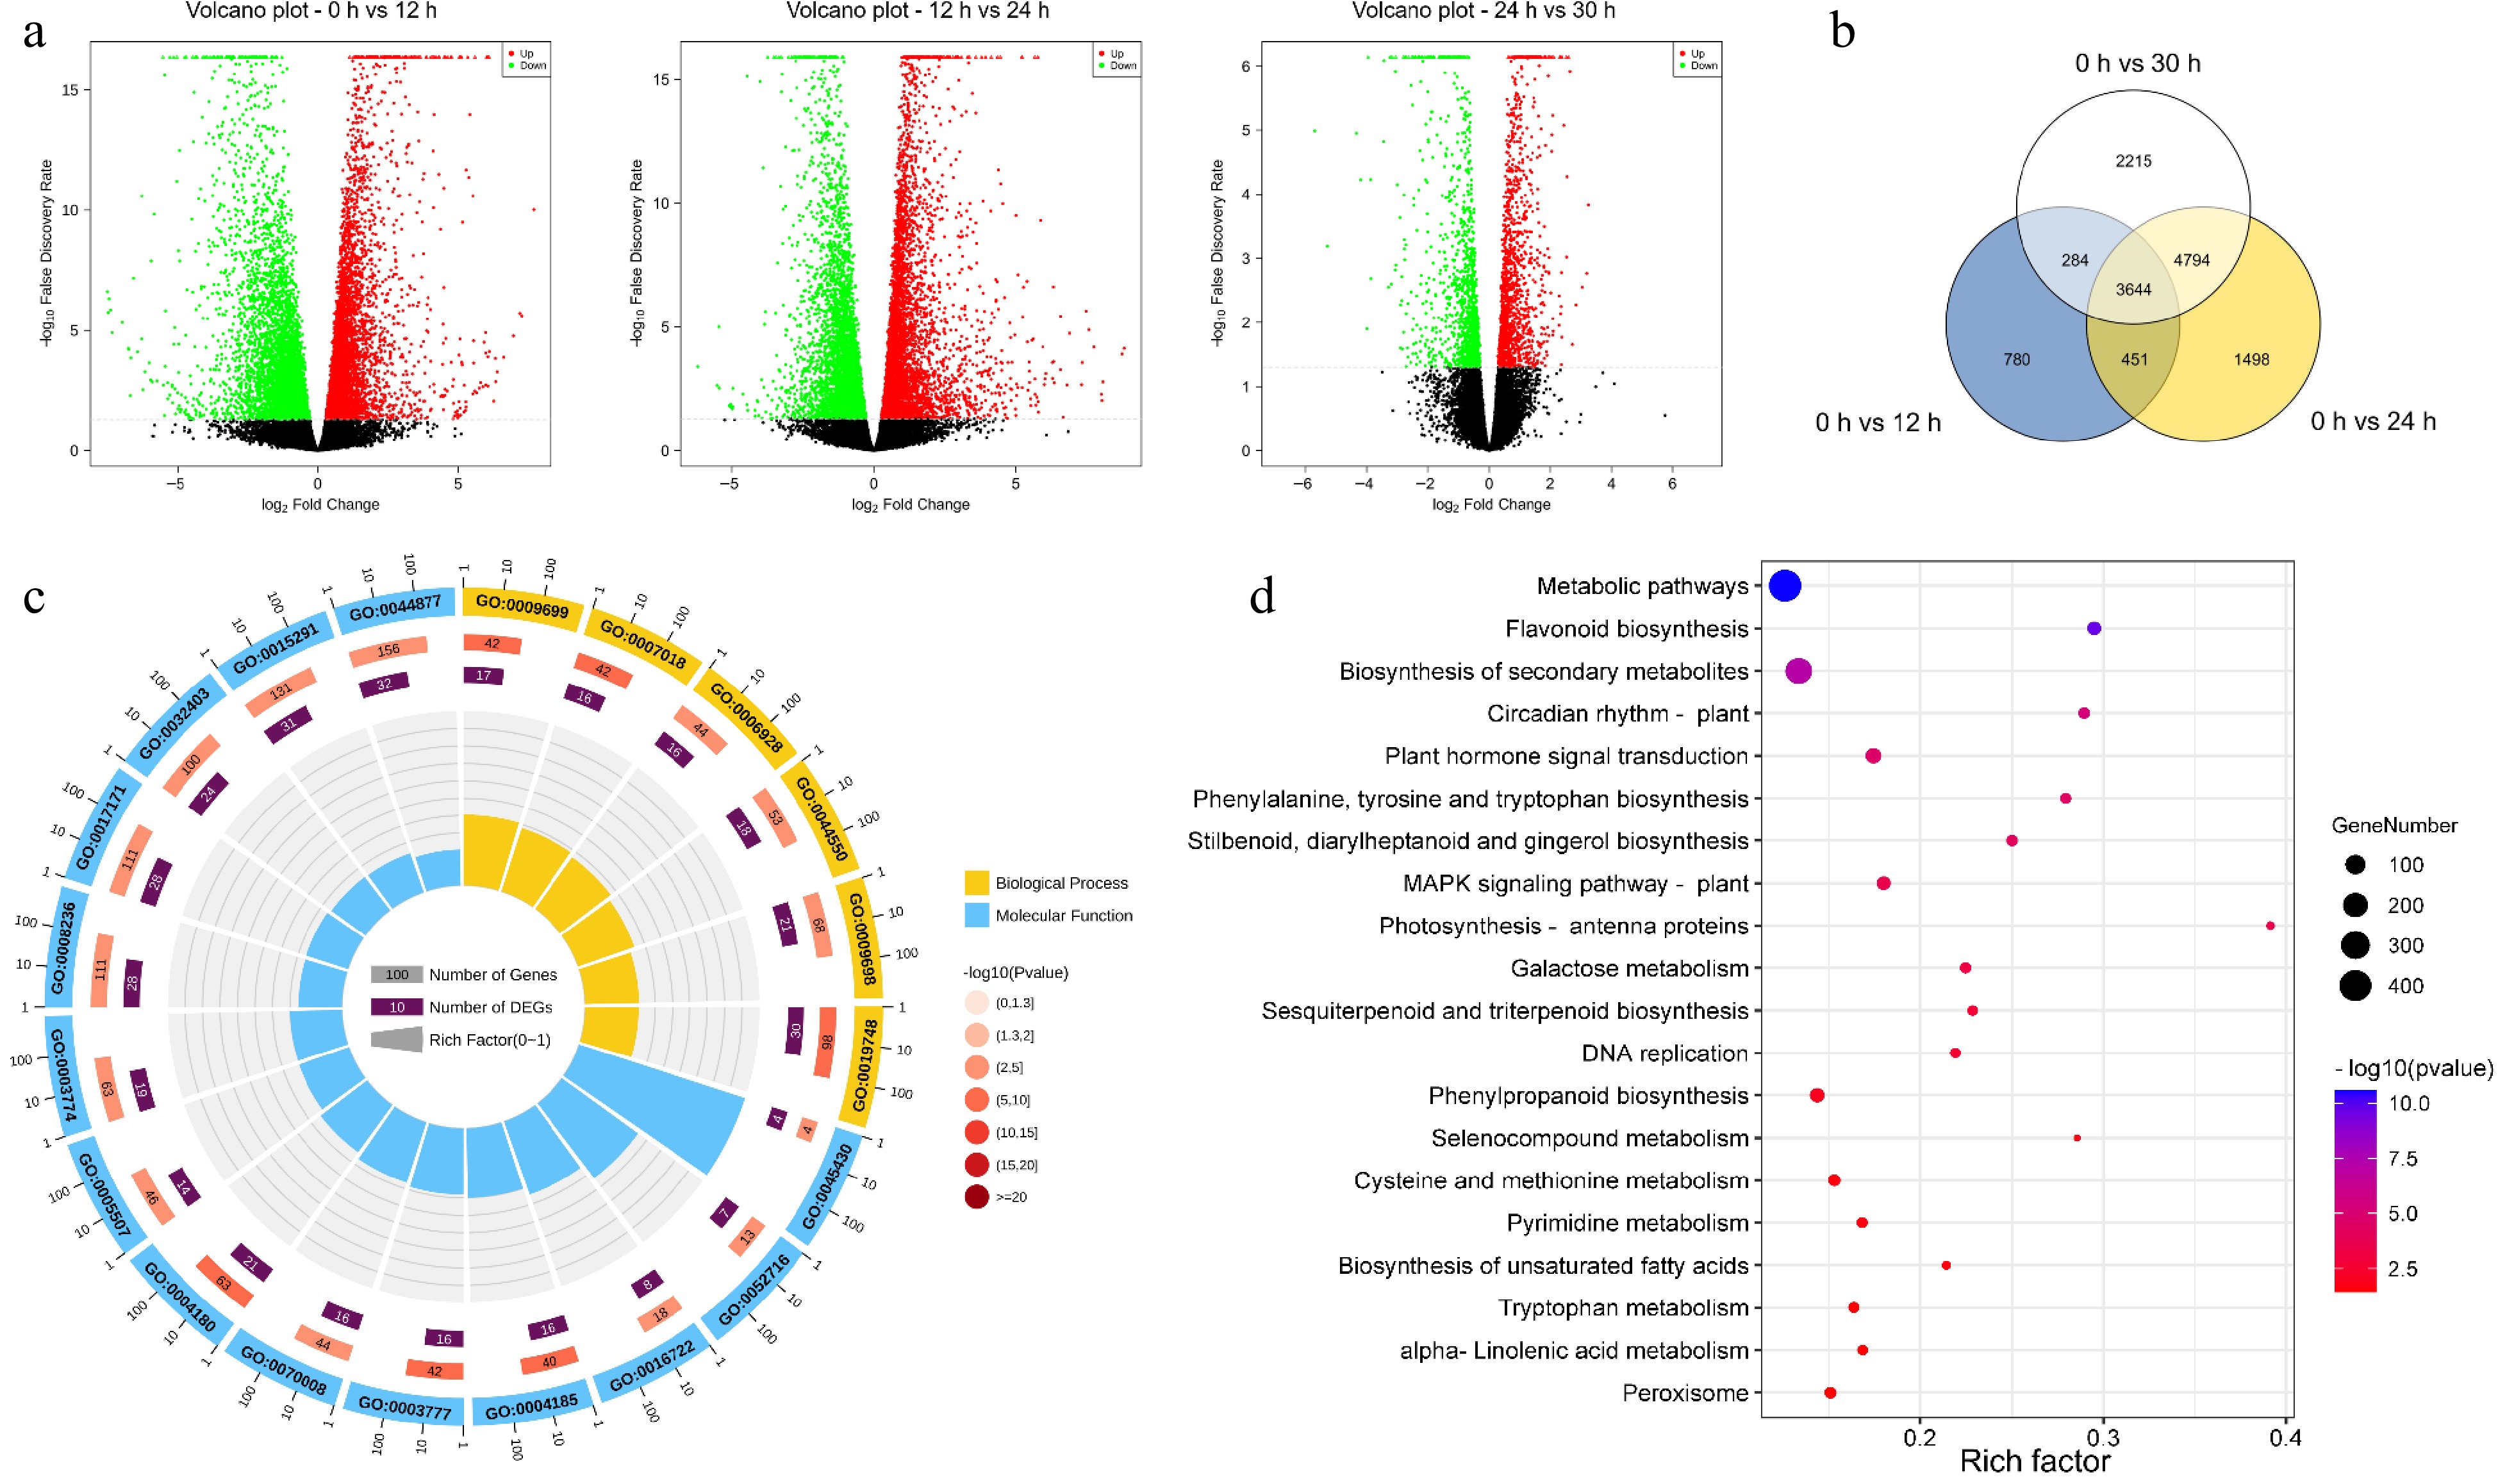
Figure 3.
Functional enrichment analysis of differentially expressed genes (DEGs). (a) The volcanic map was drawn by using the fold change in DEGs between the two groups of samples (including 0 h vs 12 h, 12 h vs 24 h, 24 h vs 30 h) and the p-value obtained by t-test, which was used to show the significant difference between the two groups. (b) Venn diagram of DEGs at different withering periods. (c) Top 20 significantly enriched GO pathways of the 3644 overlapping DEGs in (b). (d) Top 20 significantly enriched KEGG pathways of the 3644 overlapping DEGs in (a).
-
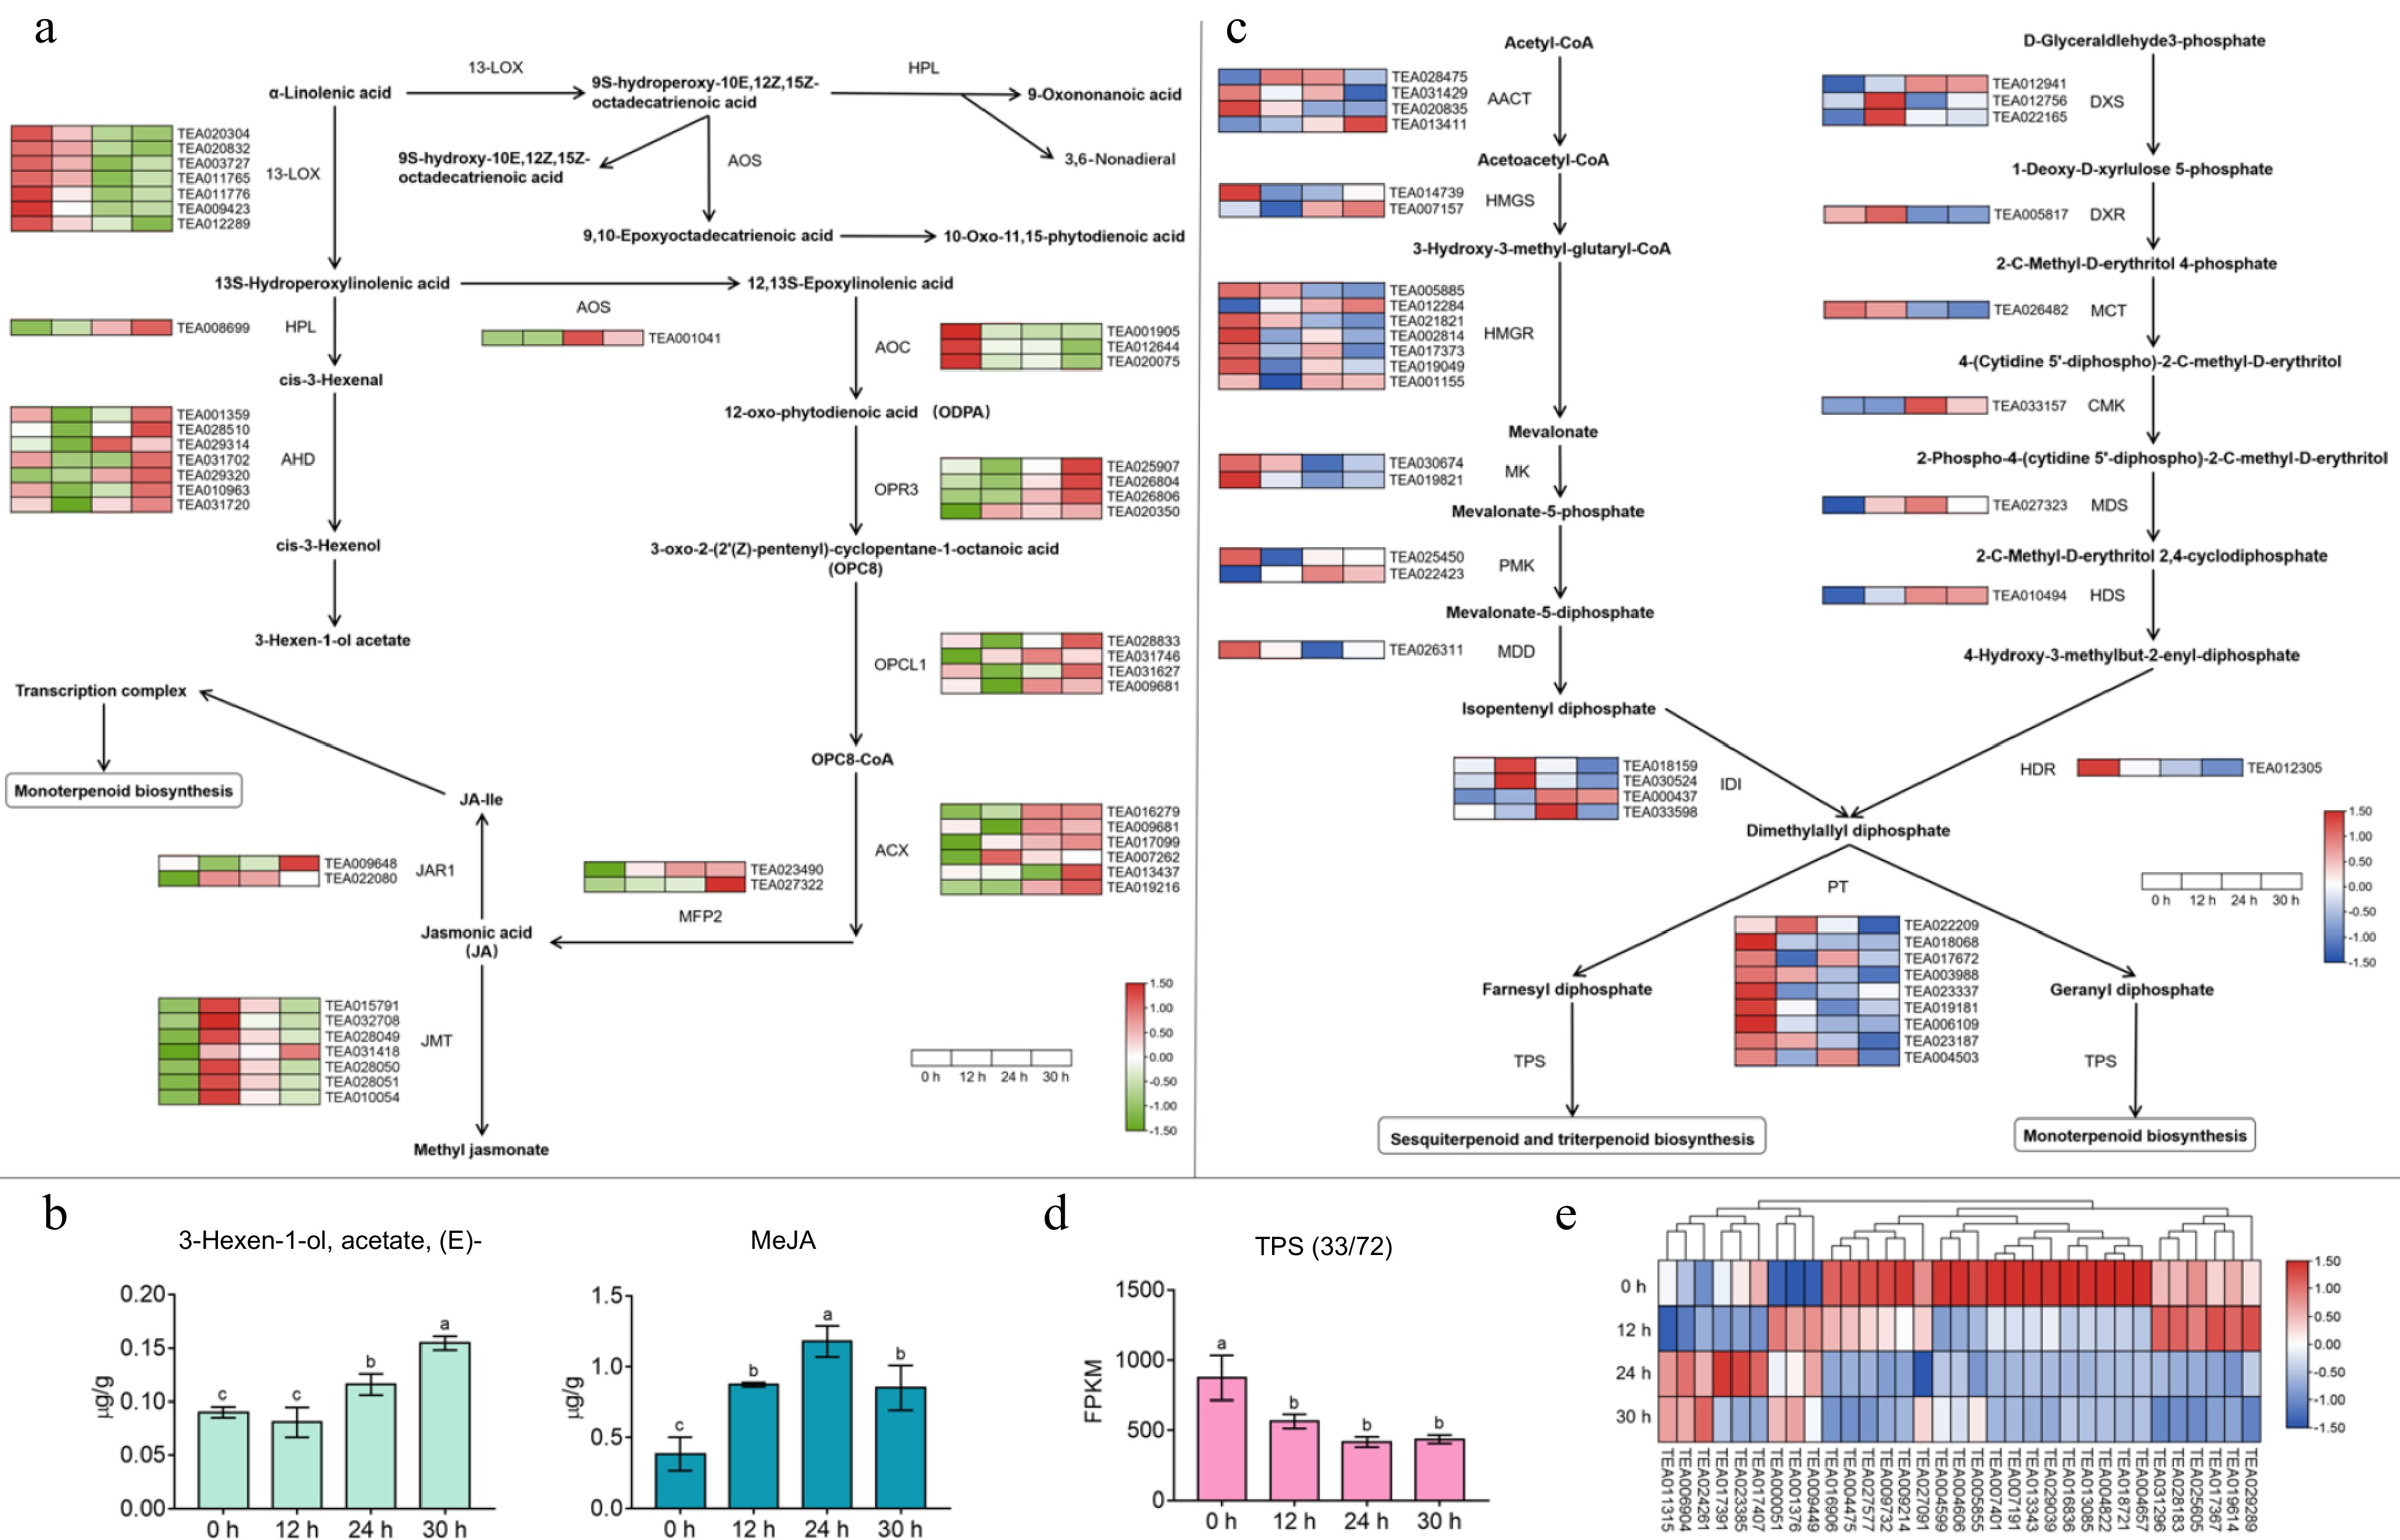
Figure 4.
Effect of apoptosis on gene expression in the α-linolenic acid metabolic pathway and terpene synthesis pathway and changes in related volatile content. (a) The expression patterns of key genes in α-linolenic acid metabolism pathway. 13-LOX, 13S-lipoxygenase; HPL, hydroperoxide lyase; ADH, alcohol dehydrogenase; AOS, allene oxide synthase; AOC, allene oxide cyclase; OPR3, 12-oxophytodienoate reductase 3; OPCL1, OPC-8:0 CoA ligase 1; ACX, acyl-CoA oxidase; MFP2, multifunctional protein 2; JMT, jasmonic acid car-boxyl methyltransferase, JAR, jasmonic acid-amino synthetase. (b) Changes in the content of partial fatty acid-derived volatile compounds during the withering process. (c) The expression regularities of key genes in terpene synthesis pathway. AACT, acetoacetyl-CoA thiolase; HMGS, 3-hydroxy-3-methylglutaryl-CoA synthase; HMGR, 3-hydroxy-3-methylglutaryl-CoA reductase; MK, mevalonate kinase; PMK, phospho-mevalonate kinase; MDD, mevalonate-5-diphosphate decarboxylase; IDI, isopentenyl diphosphate isomer-ase; PT, prenyl transferase; TPS, terpene synthase; DXS, 1-deoxy-D-xylulose 5-phosphate synthase; DXR, 1-deoxy-D-xylulose 5-phosphate reductase; MCT, 2-C-methyl-D-erythritol 4- phosphate cytidyl-transferase; CMK, 4-diphosphocytidyl-2-C-methyl-D-erythritol kinase; MDS, 2-C-methyl-D-erythritol 2,4-cyclodiphosphate synthase; HDS, (E)-4-hydroxy-3-methyl-but-2-enyl diphosphate synthase; HDR, (E)-4-hydroxy-3-methyl-but-2-enyl diphosphate reductase. (d) The variation trend of total FPKM value of TPS family members at different withering time points. (e) Heat map of TPS family genes expression during withering. Values with different letters (a–c) differ from each other significantly; Data represent the mean value ± SD (n = 3).
-
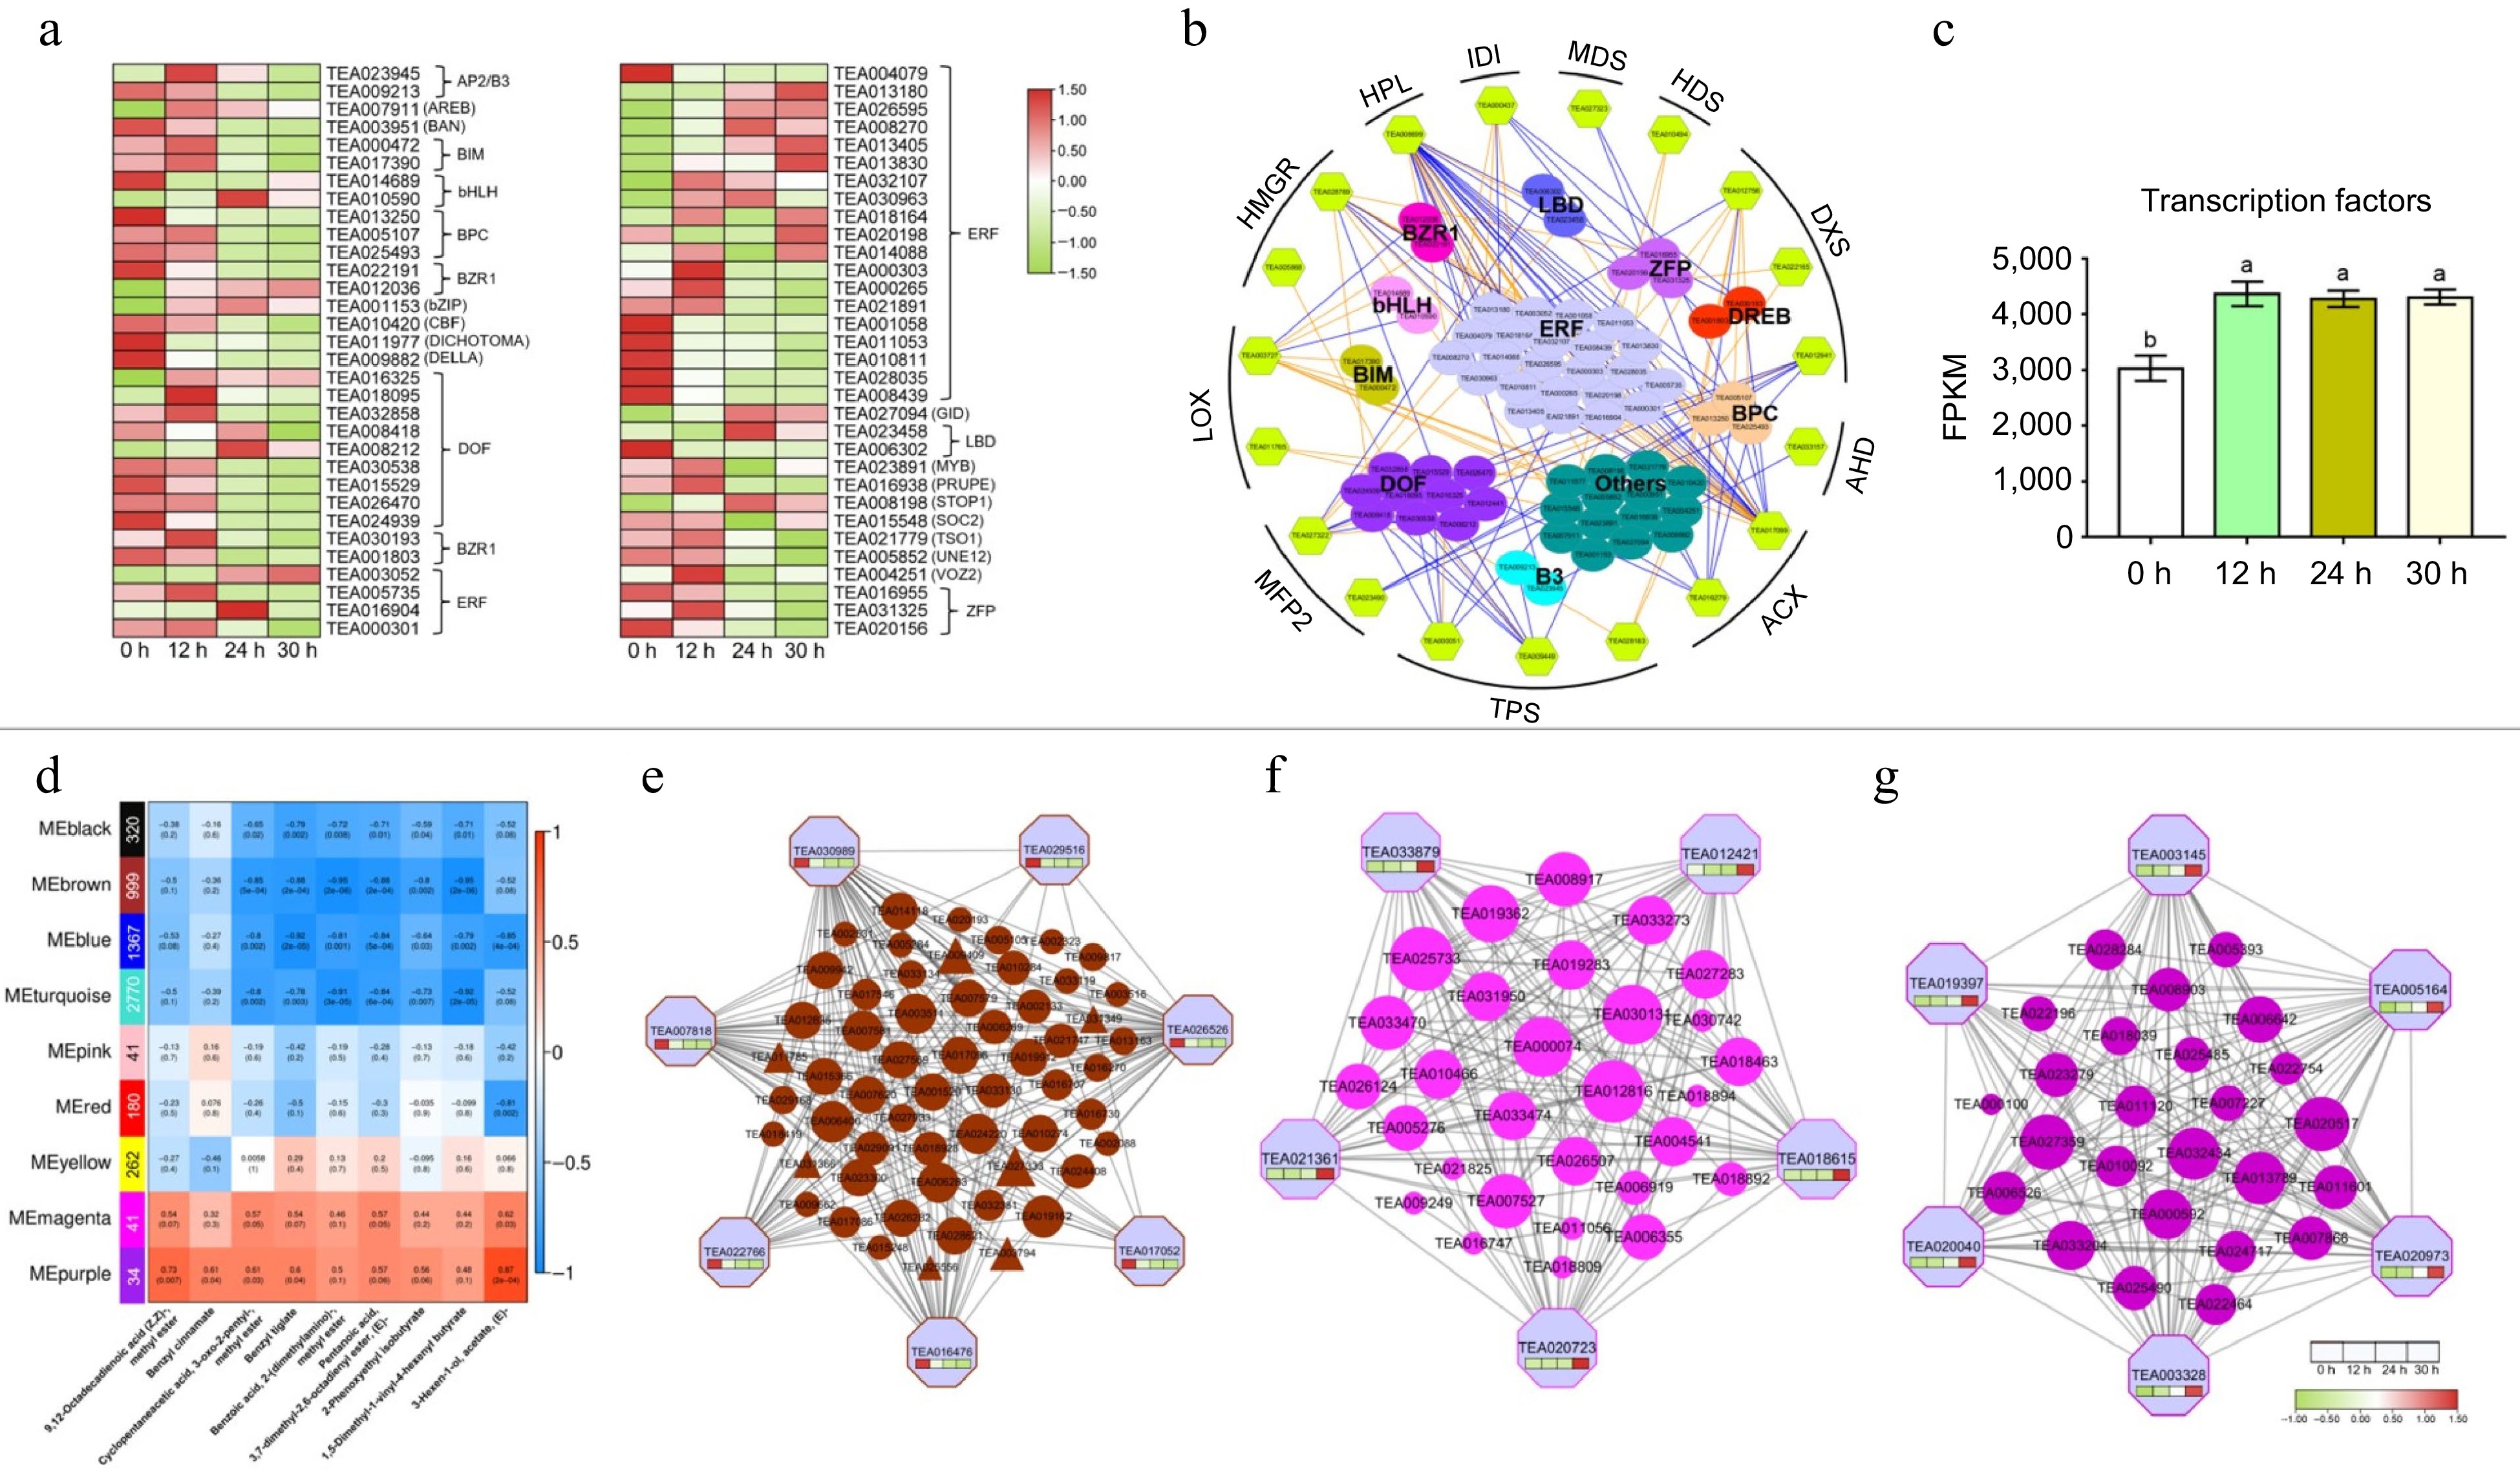
Figure 5.
Expression patterns of transcription factor families and co-expression modules identification based on weighted gene co-expression network analysis (WGCNA). (a) Heat map of TFs expression during withering. (b) Transcriptional regulation of α-linolenic acid metabolism and terpenoid biosynthetic genes. The color filled hexagons represent the structural genes, and the color filled spheres represent different transcription factors. The expression correlations between transcription factors and the structural genes are shown with colored lines (PCC, p ≤ 0.05), and the orange line indicates a positive correlation, and the blue line indicates a negative correlation. (c) The variation trend of total FPKM value of transcription factors at different withering time points. (d) Module-trait associations based on PCC. Each row represents one module, and the numbers of genes in each module were shown on the far left. Each column corresponds to one volatile metabolite. (e) protein co-expression network for the MEbrown module. The top 200 proteins based on topo-logical overlap measure (TOM) values were used to construct the coexpression network. (f) and (g) Protein co-expression net-works for the MEmagenta and MEpurple module. All proteins in the modules were used to construct the coexpression network.
Figures
(5)
Tables
(0)