-
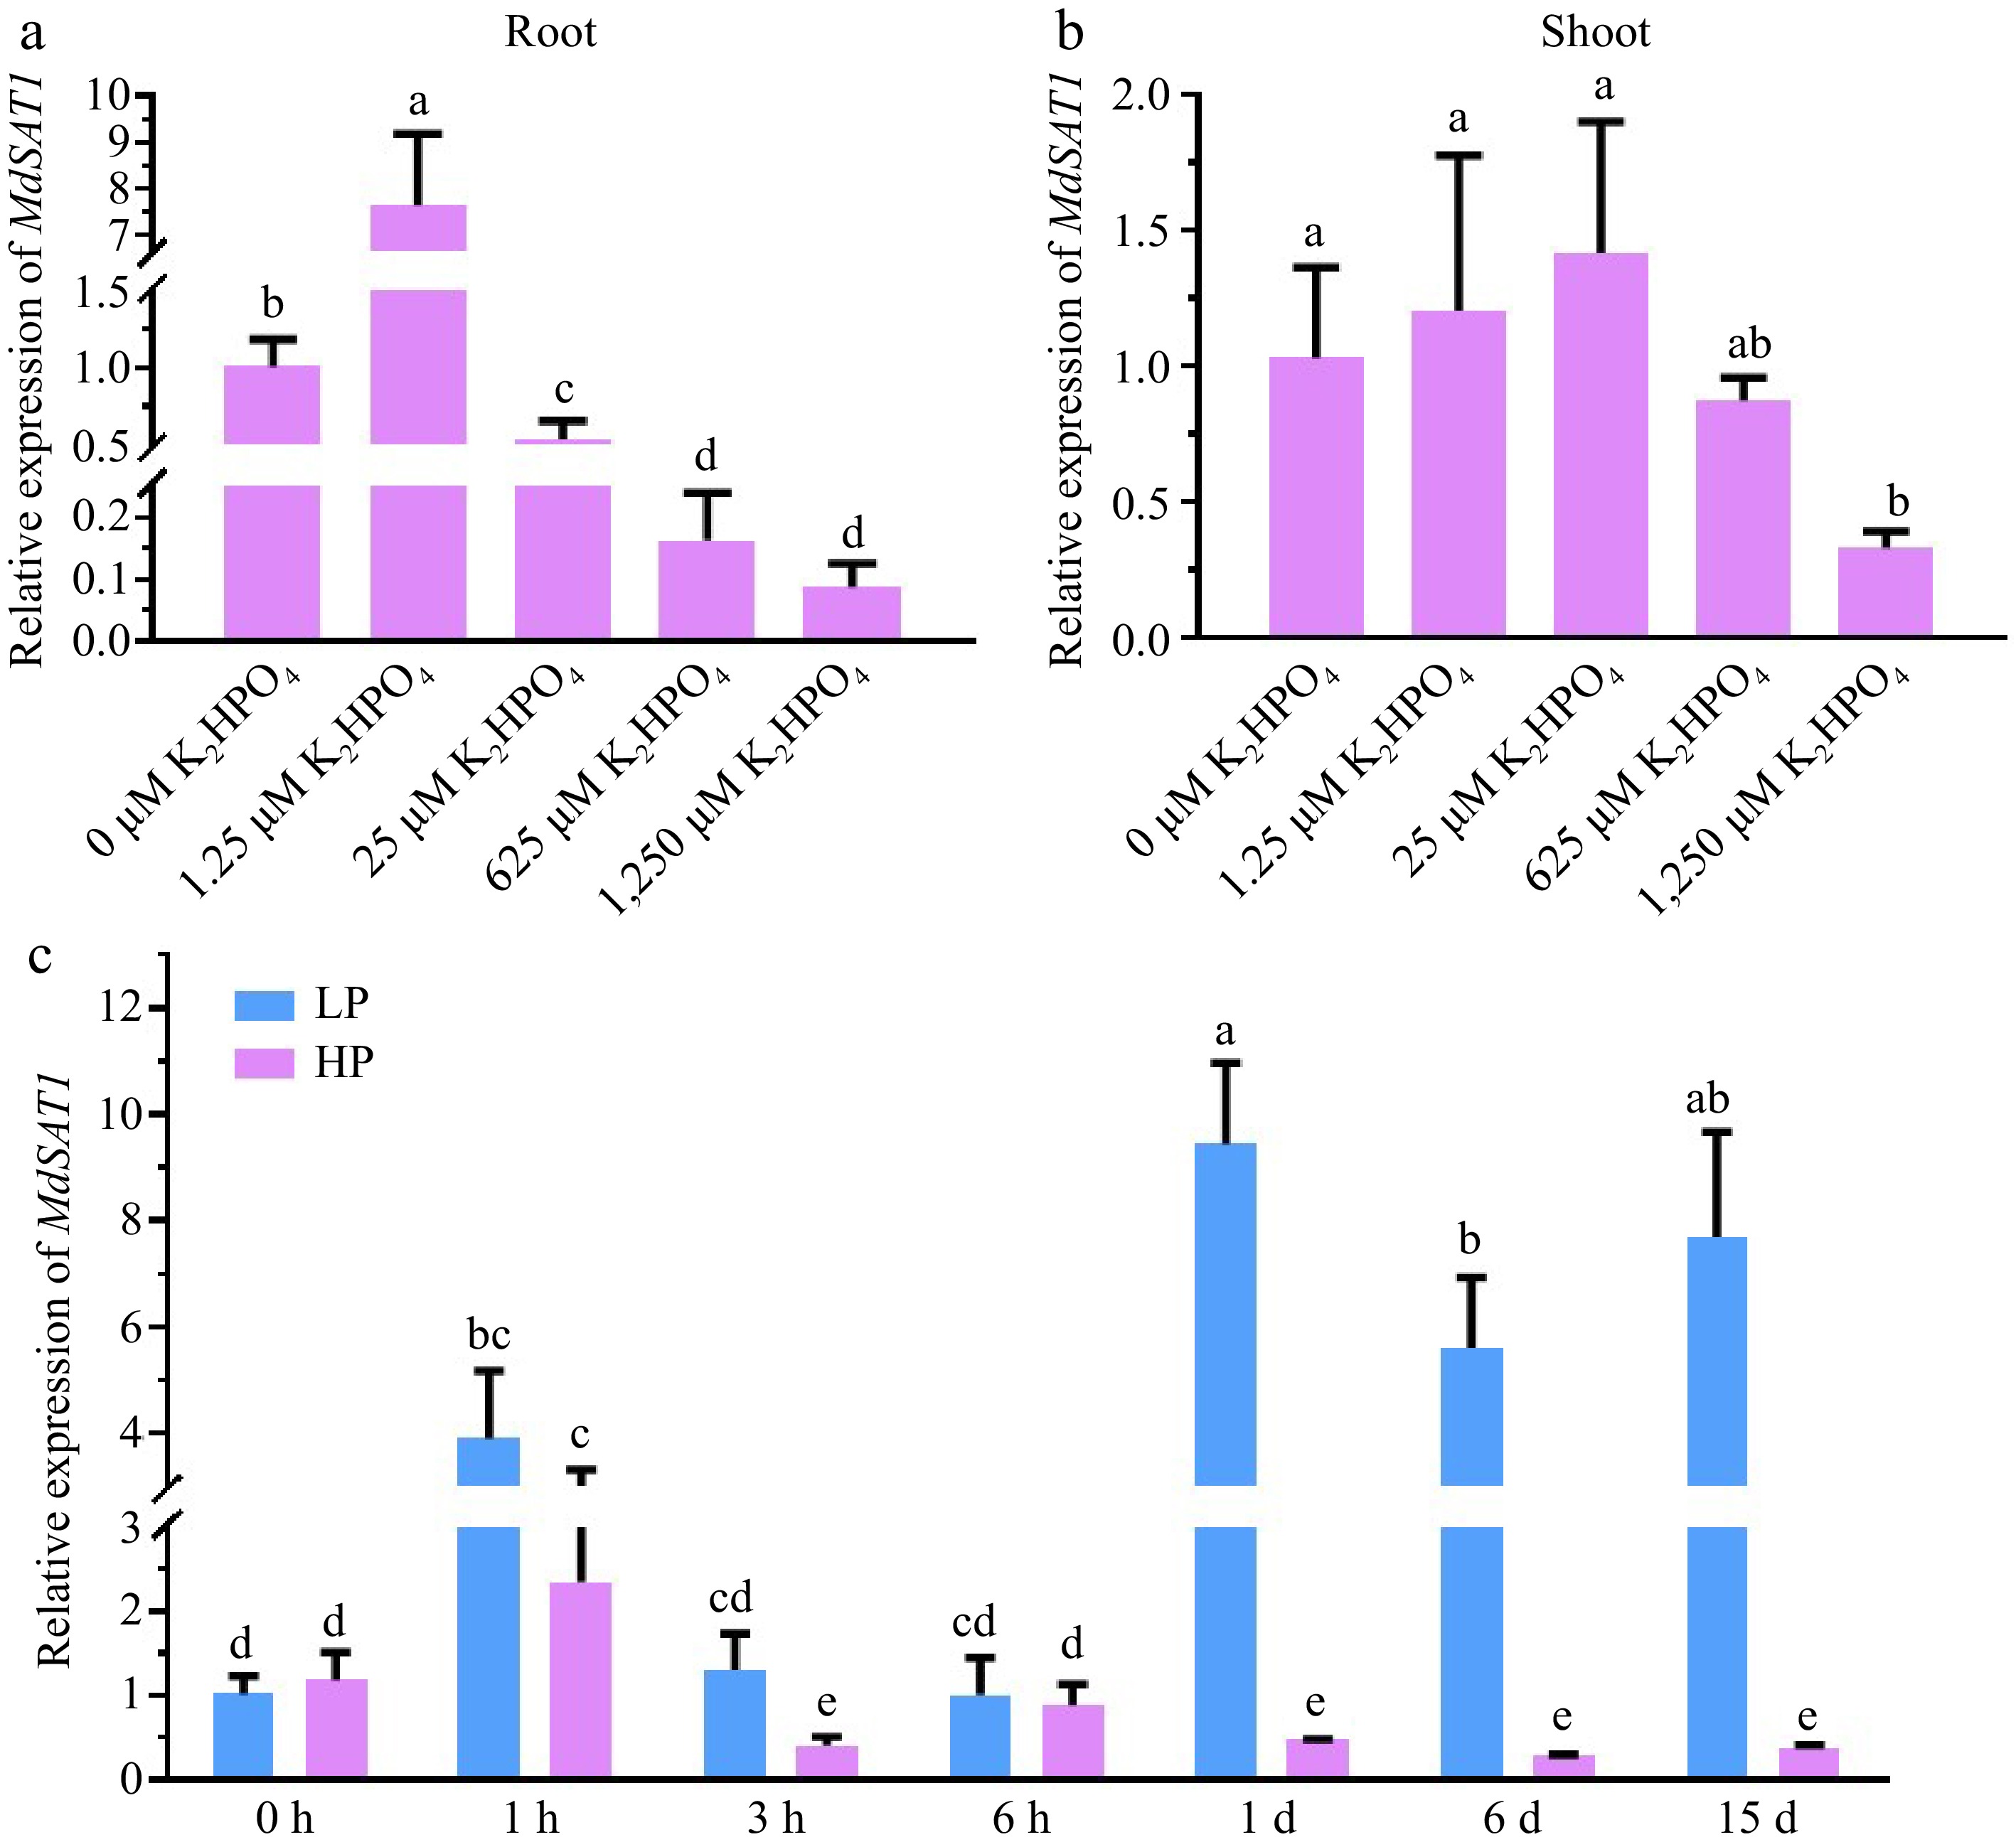
Figure 1.
MdSAT1 gene expression analysis in response to phosphate. (a) Root and (b) shoot MdSAT1 expression levels under different phosphate concentrations (the different Pi concentrations the apple seedlings were treated with were 0, 1.25, 25, 625, and 1,250 μM K2HPO4 for 15 d, supplemented with 2,500 μM K+ using the corresponding concentration of K2SO4). The seedlings treated with 0 μM K2HPO4 (1.25 mM K2SO4) were used as a negative control. (c) MdSAT1 expression levels under the 1.25 μM K2HPO4 (LP) and 1.25 mM K2HPO4 (HP) conditions. Plants grown at 23 °C/21 °C for day/night with 16L/8D, with an irradiance of 150 μmol·m−2·s−1 and relative humidity of 60%−70%. The seedlings treated with LP (0 h) were used as the negative control. Md18S was used as the reference gene. Error bars represent standard deviations (n ≥ 3). Different letters above the bars indicate significantly different values (p < 0.05).
-
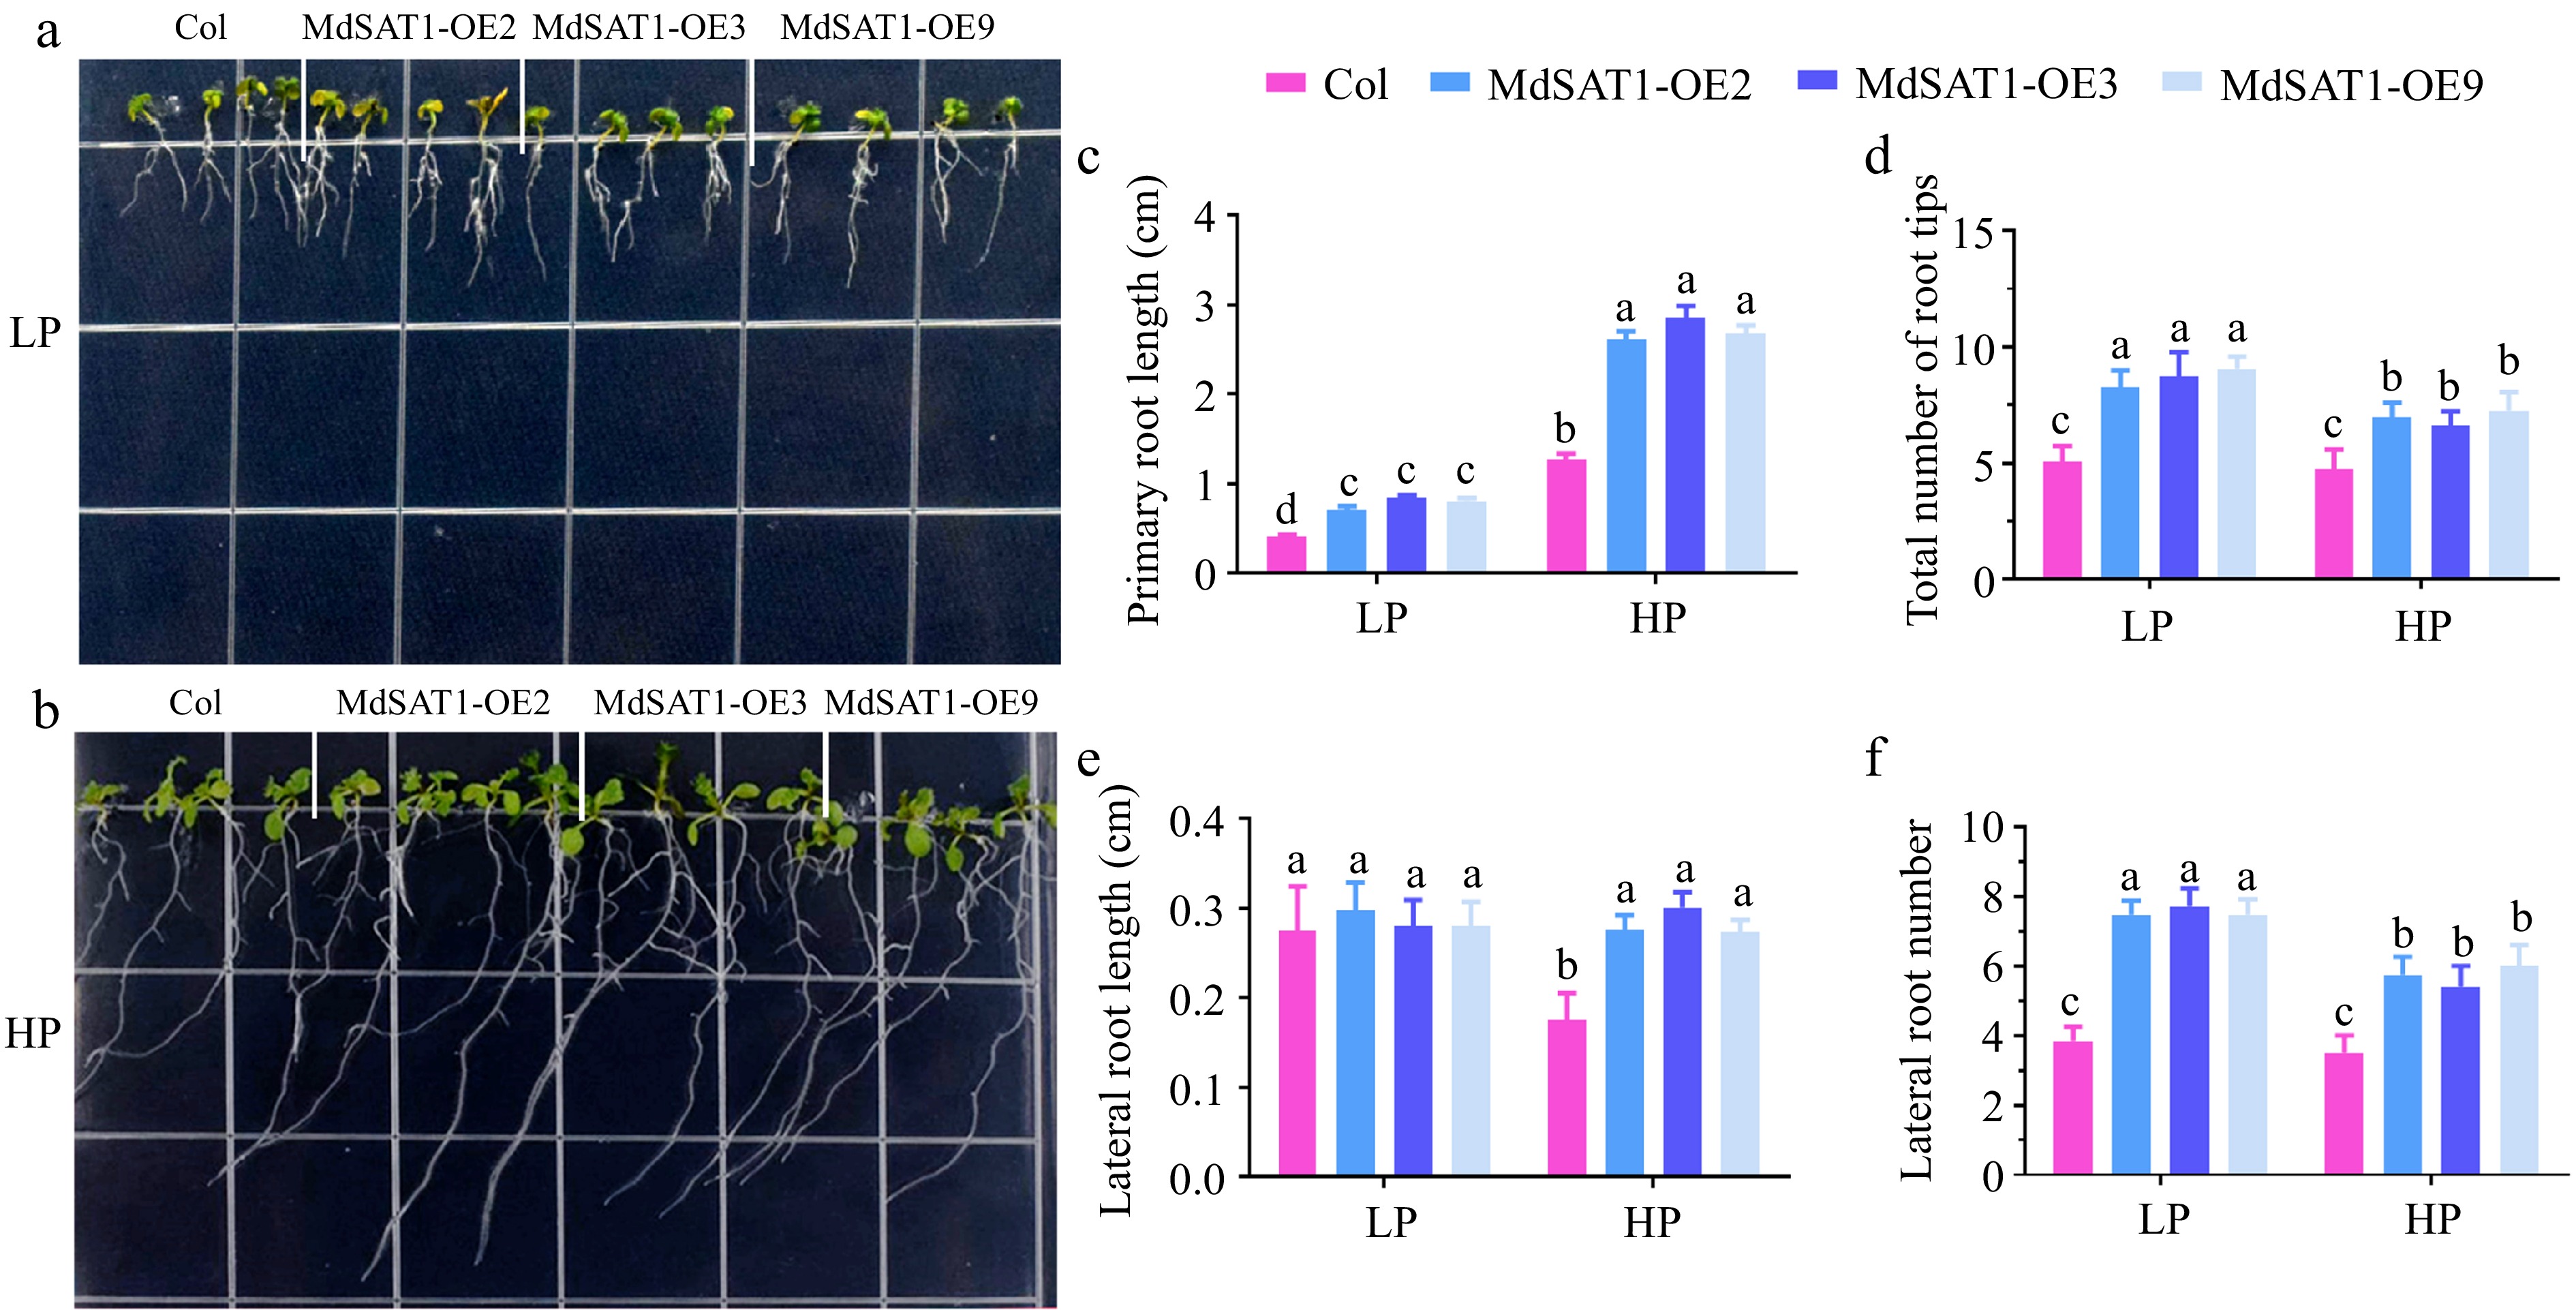
Figure 2.
MdSAT1 regulates root architecture. MdSAT1-OE and Col plants were grown for 7 d under LP (1.25 μM K2HPO4, 1.5% sucrose and 0.8% agar powder, pH 5.9) or HP (1.25 mM K2HPO4, 1.5% sucrose and 0.8% agar powder, pH 5.9) conditions. Plants grown at 23 °C/21 °C for day/night with 16L/8D, with an irradiance of 150 μmol·m−2 ·s−1 and relative humidity of 60%−70%. (a), (b) Morphological changes, (c) primary root length, (d) the total number of root tips, (e) lateral root length, and (f) lateral root number are presented. Error bars represent standard deviations (n ≥ 3). Different letters above the bars indicate significantly different values (p < 0.05).
-
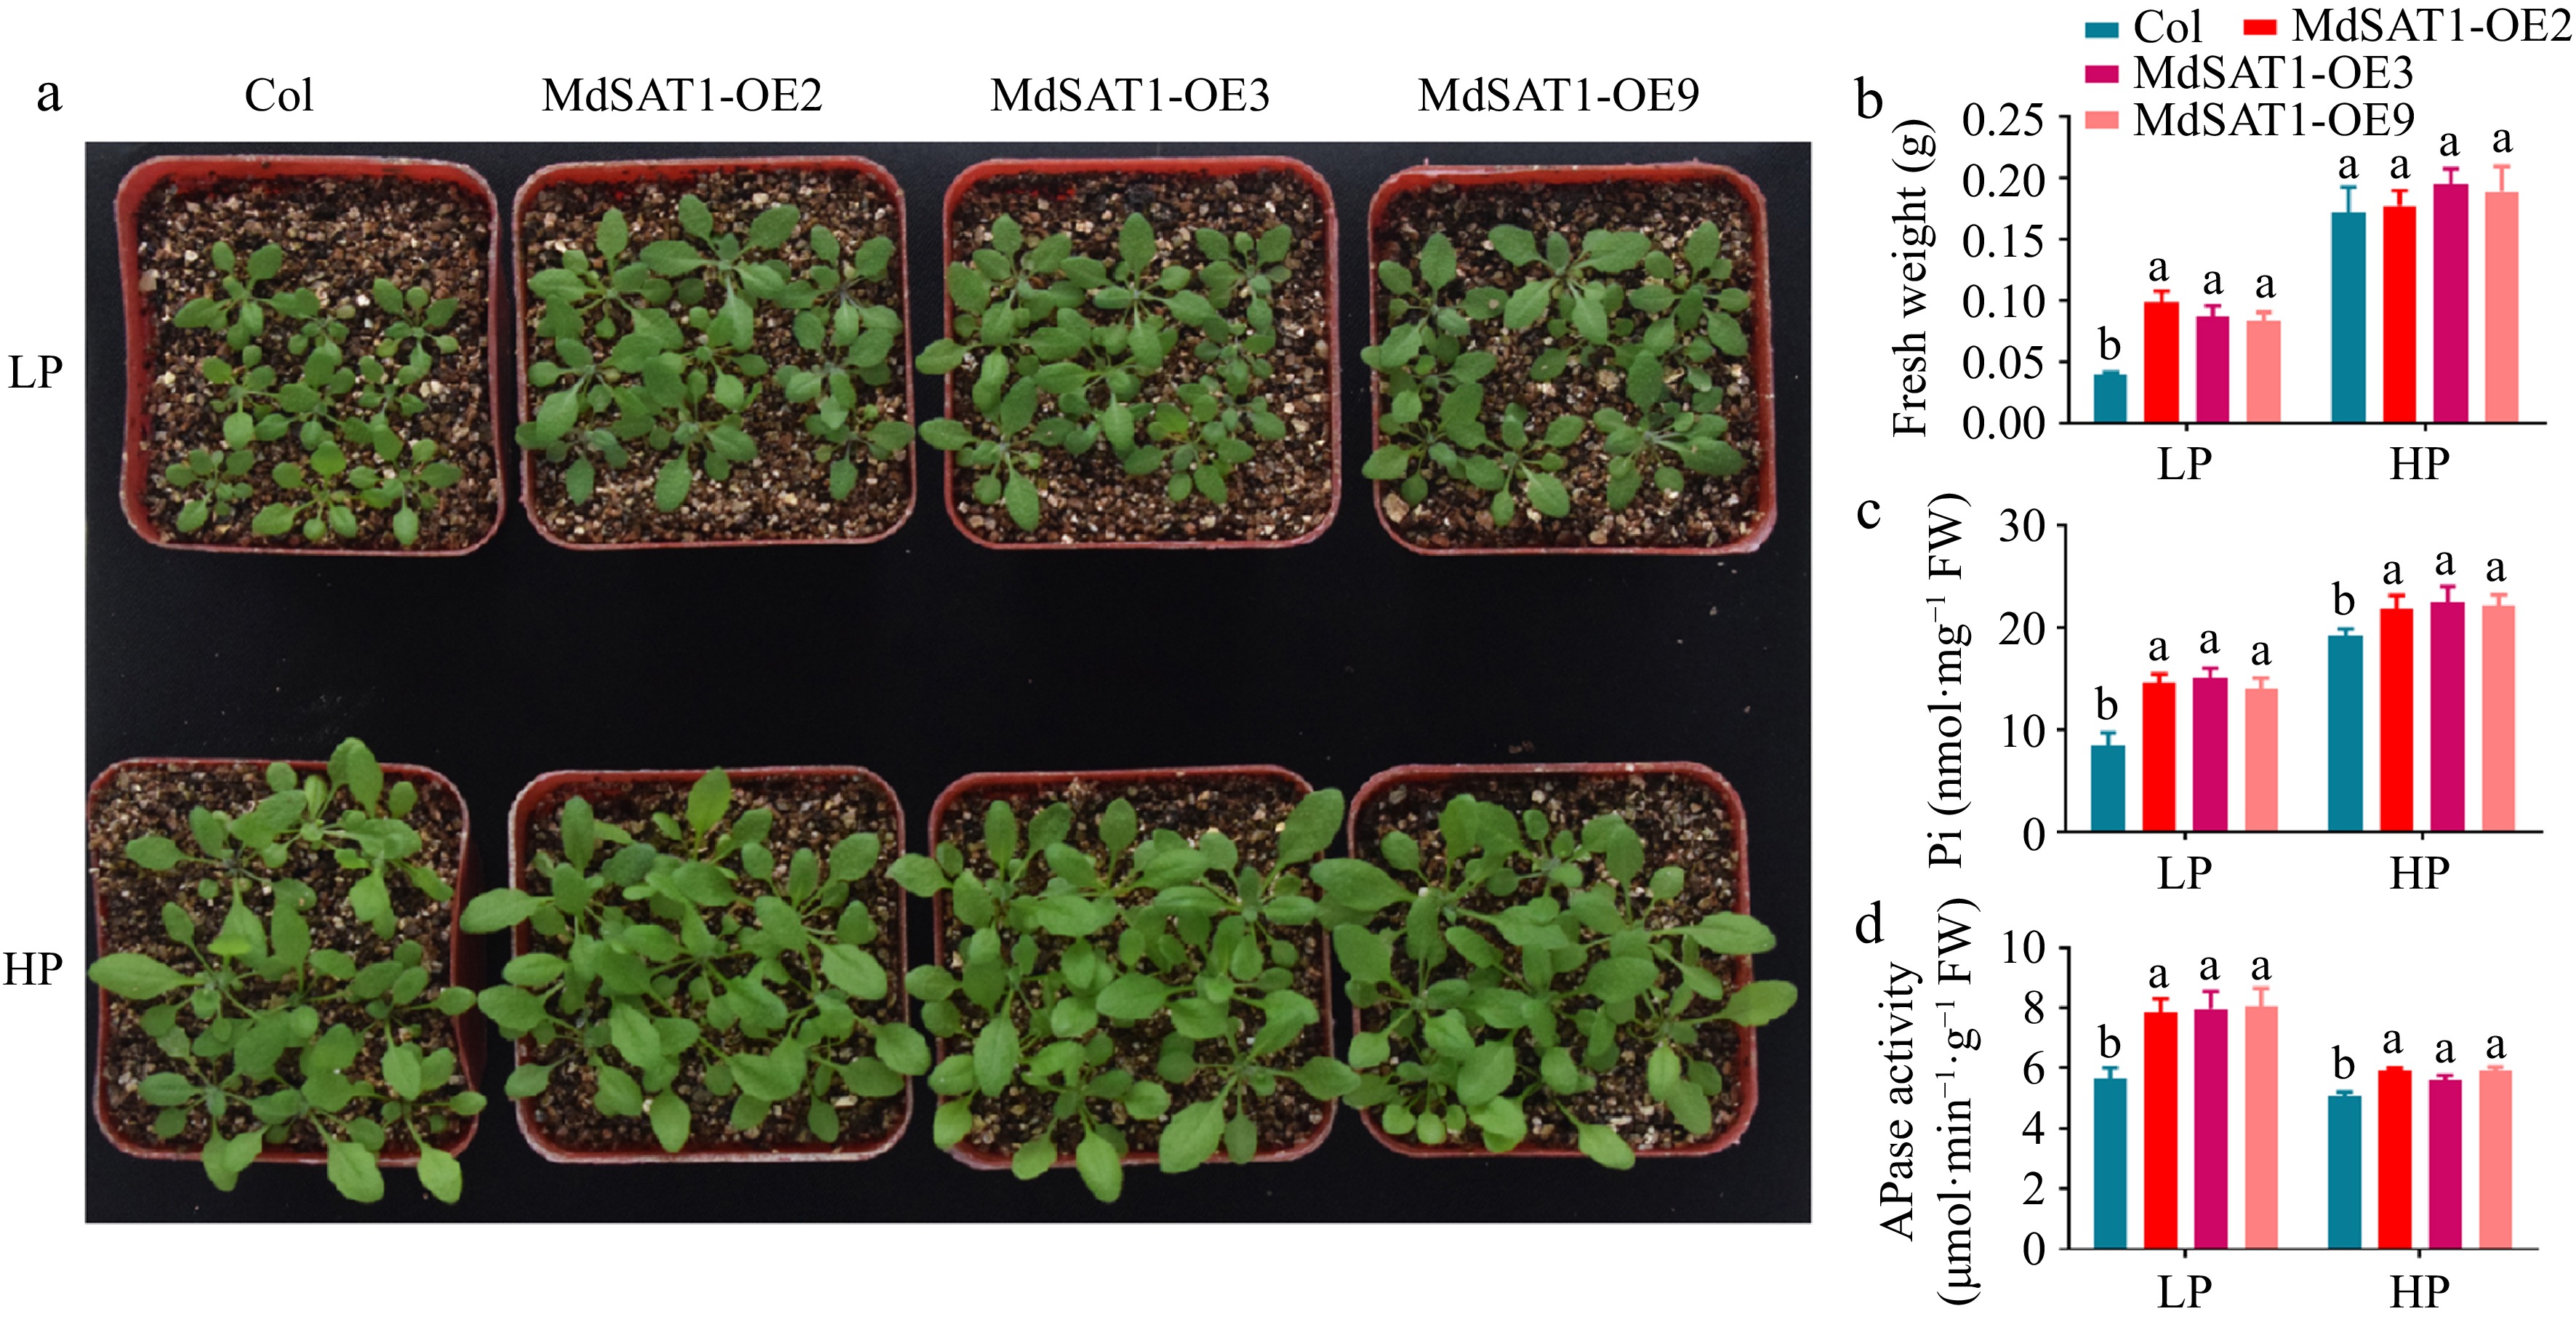
Figure 3.
MdSAT1 promotes phosphate uptake and regulates plant growth. MdSAT1-OE and Col plants were grown for 3 weeks under LP (1.25 μM K2HPO4) or HP (1.25 mM K2HPO4) conditions. Plants grown at 23 °C/21 °C for day/night with 16L/8D, with an irradiance of 150 μmol·m−2·s−1 and relative humidity of 60%−70%. (a) Morphological changes, (b) fresh weight, (c) phosphate content, and (d) APase activity are presented. Error bars represent standard deviations (n ≥ 3). Different letters above the bars indicate significantly different values (p < 0.05).
-
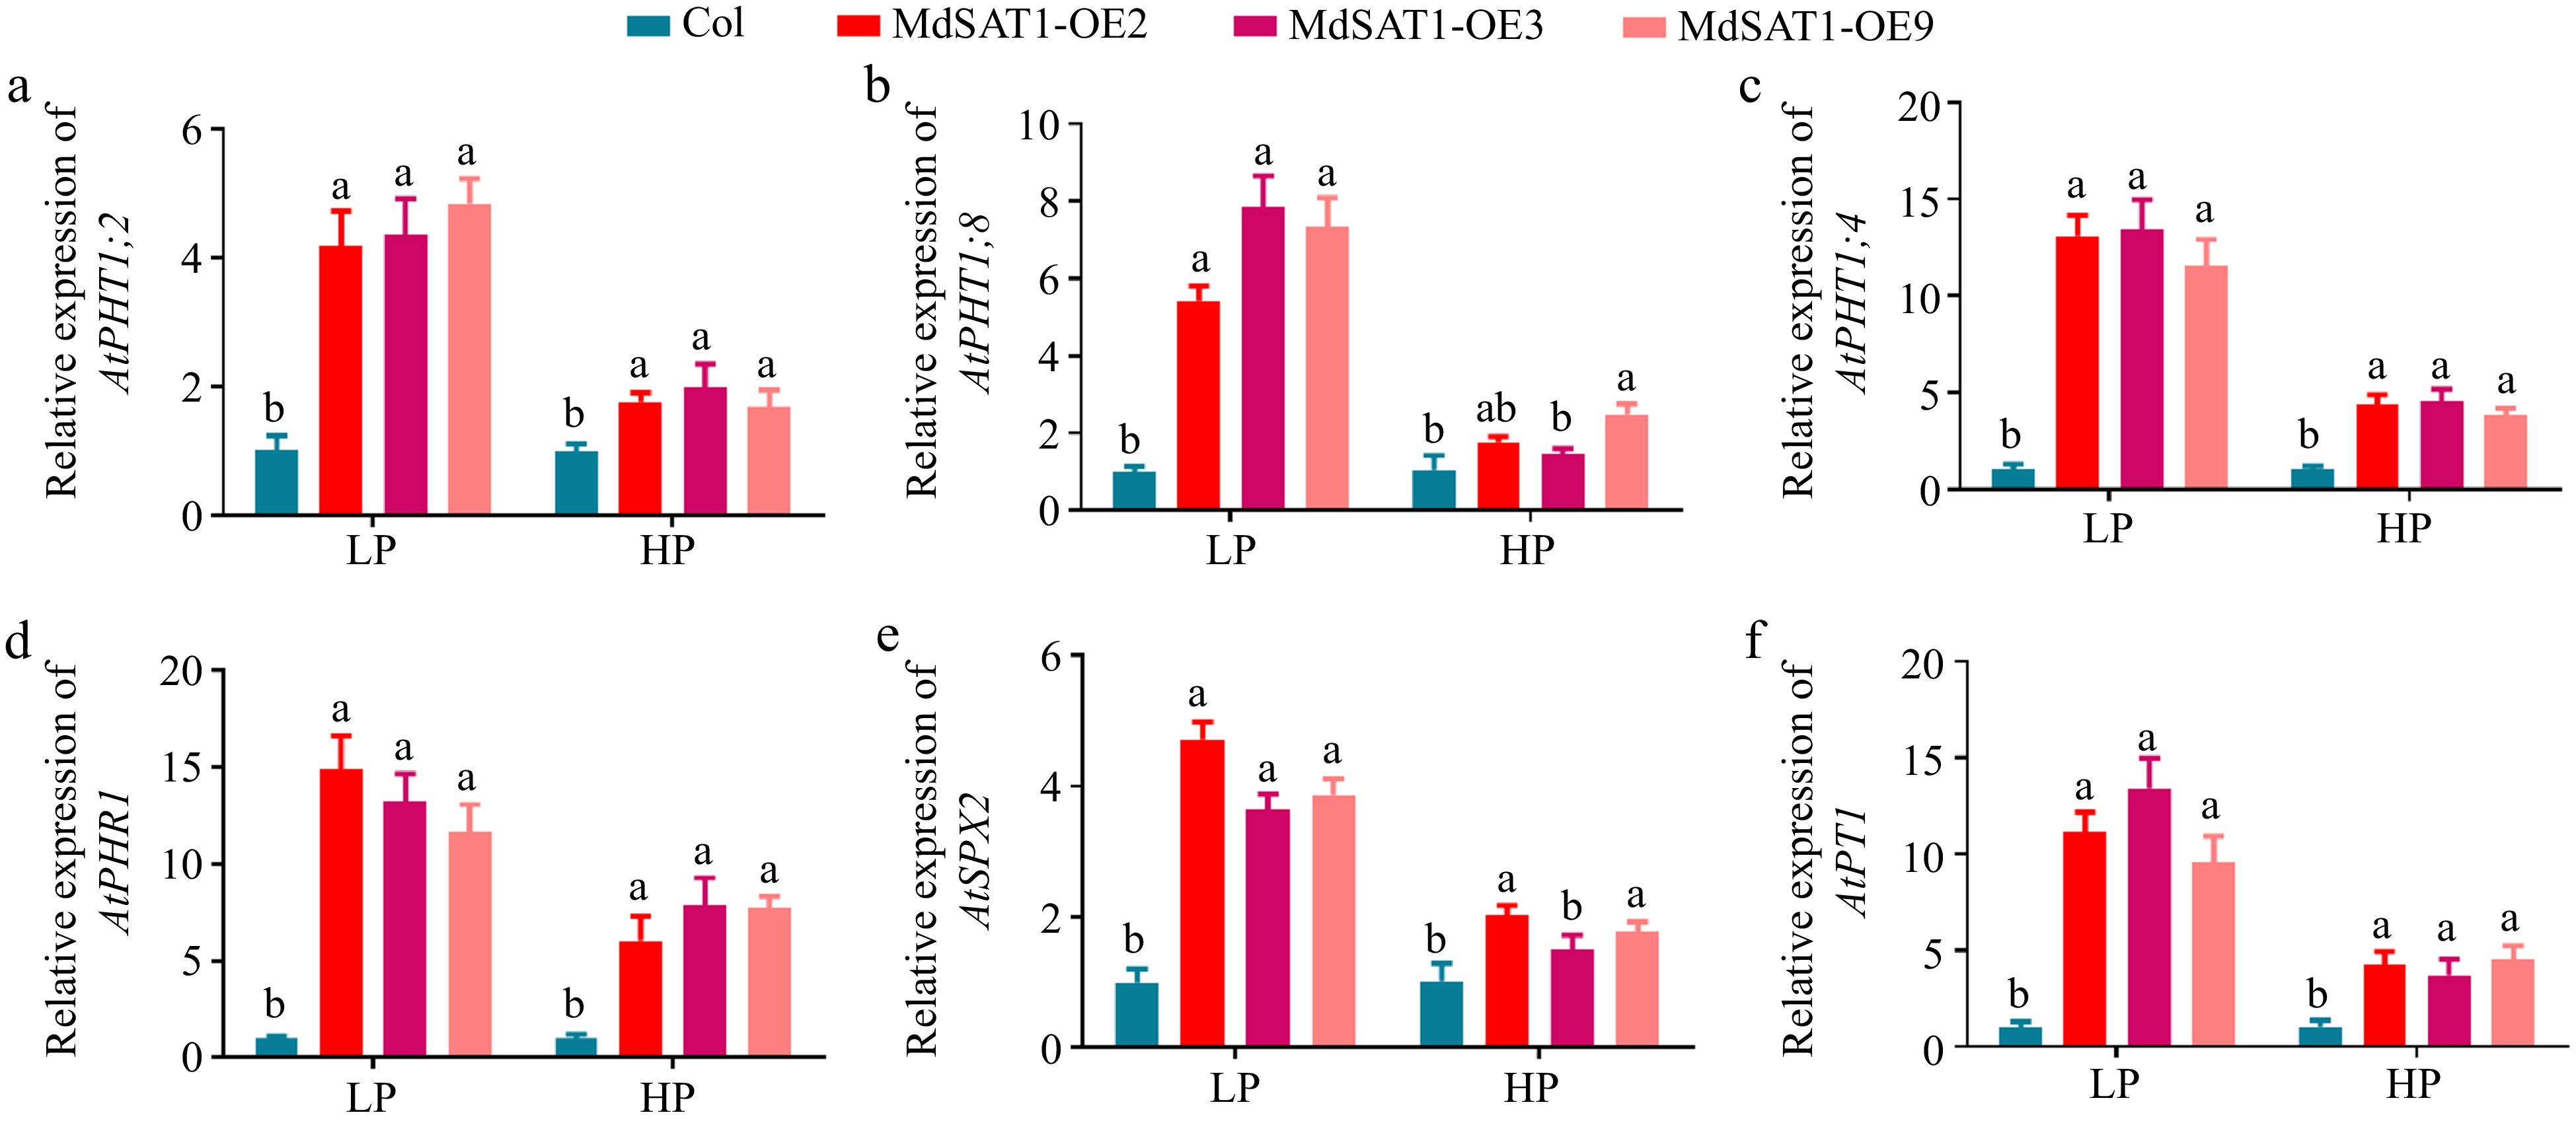
Figure 4.
MdSAT1 regulates the expression of Pi-responsive genes. MdSAT1-OE and Col Arabidopsis plants were grown for 3 weeks under LP (1.25 μM K2HPO4) or HP (1.25 mM K2HPO4) conditions. Plants grown at 23 °C/21 °C for day/night with 16L/8D, with an irradiance of 150 μmol·m−2·s−1 and relative humidity of 60%–70%. (a)–(f) Transcript levels of AtPHT1; 2, AtPHT1; 8, AtPHT1; 4, AtPHR1, AtSPX2, and AtPT1 in MdSAT1-OE and Col plants under LP conditions. Error bars represent standard deviations (n ≥ 3). Different letters above the bars indicate significantly different values (p < 0.05).
-
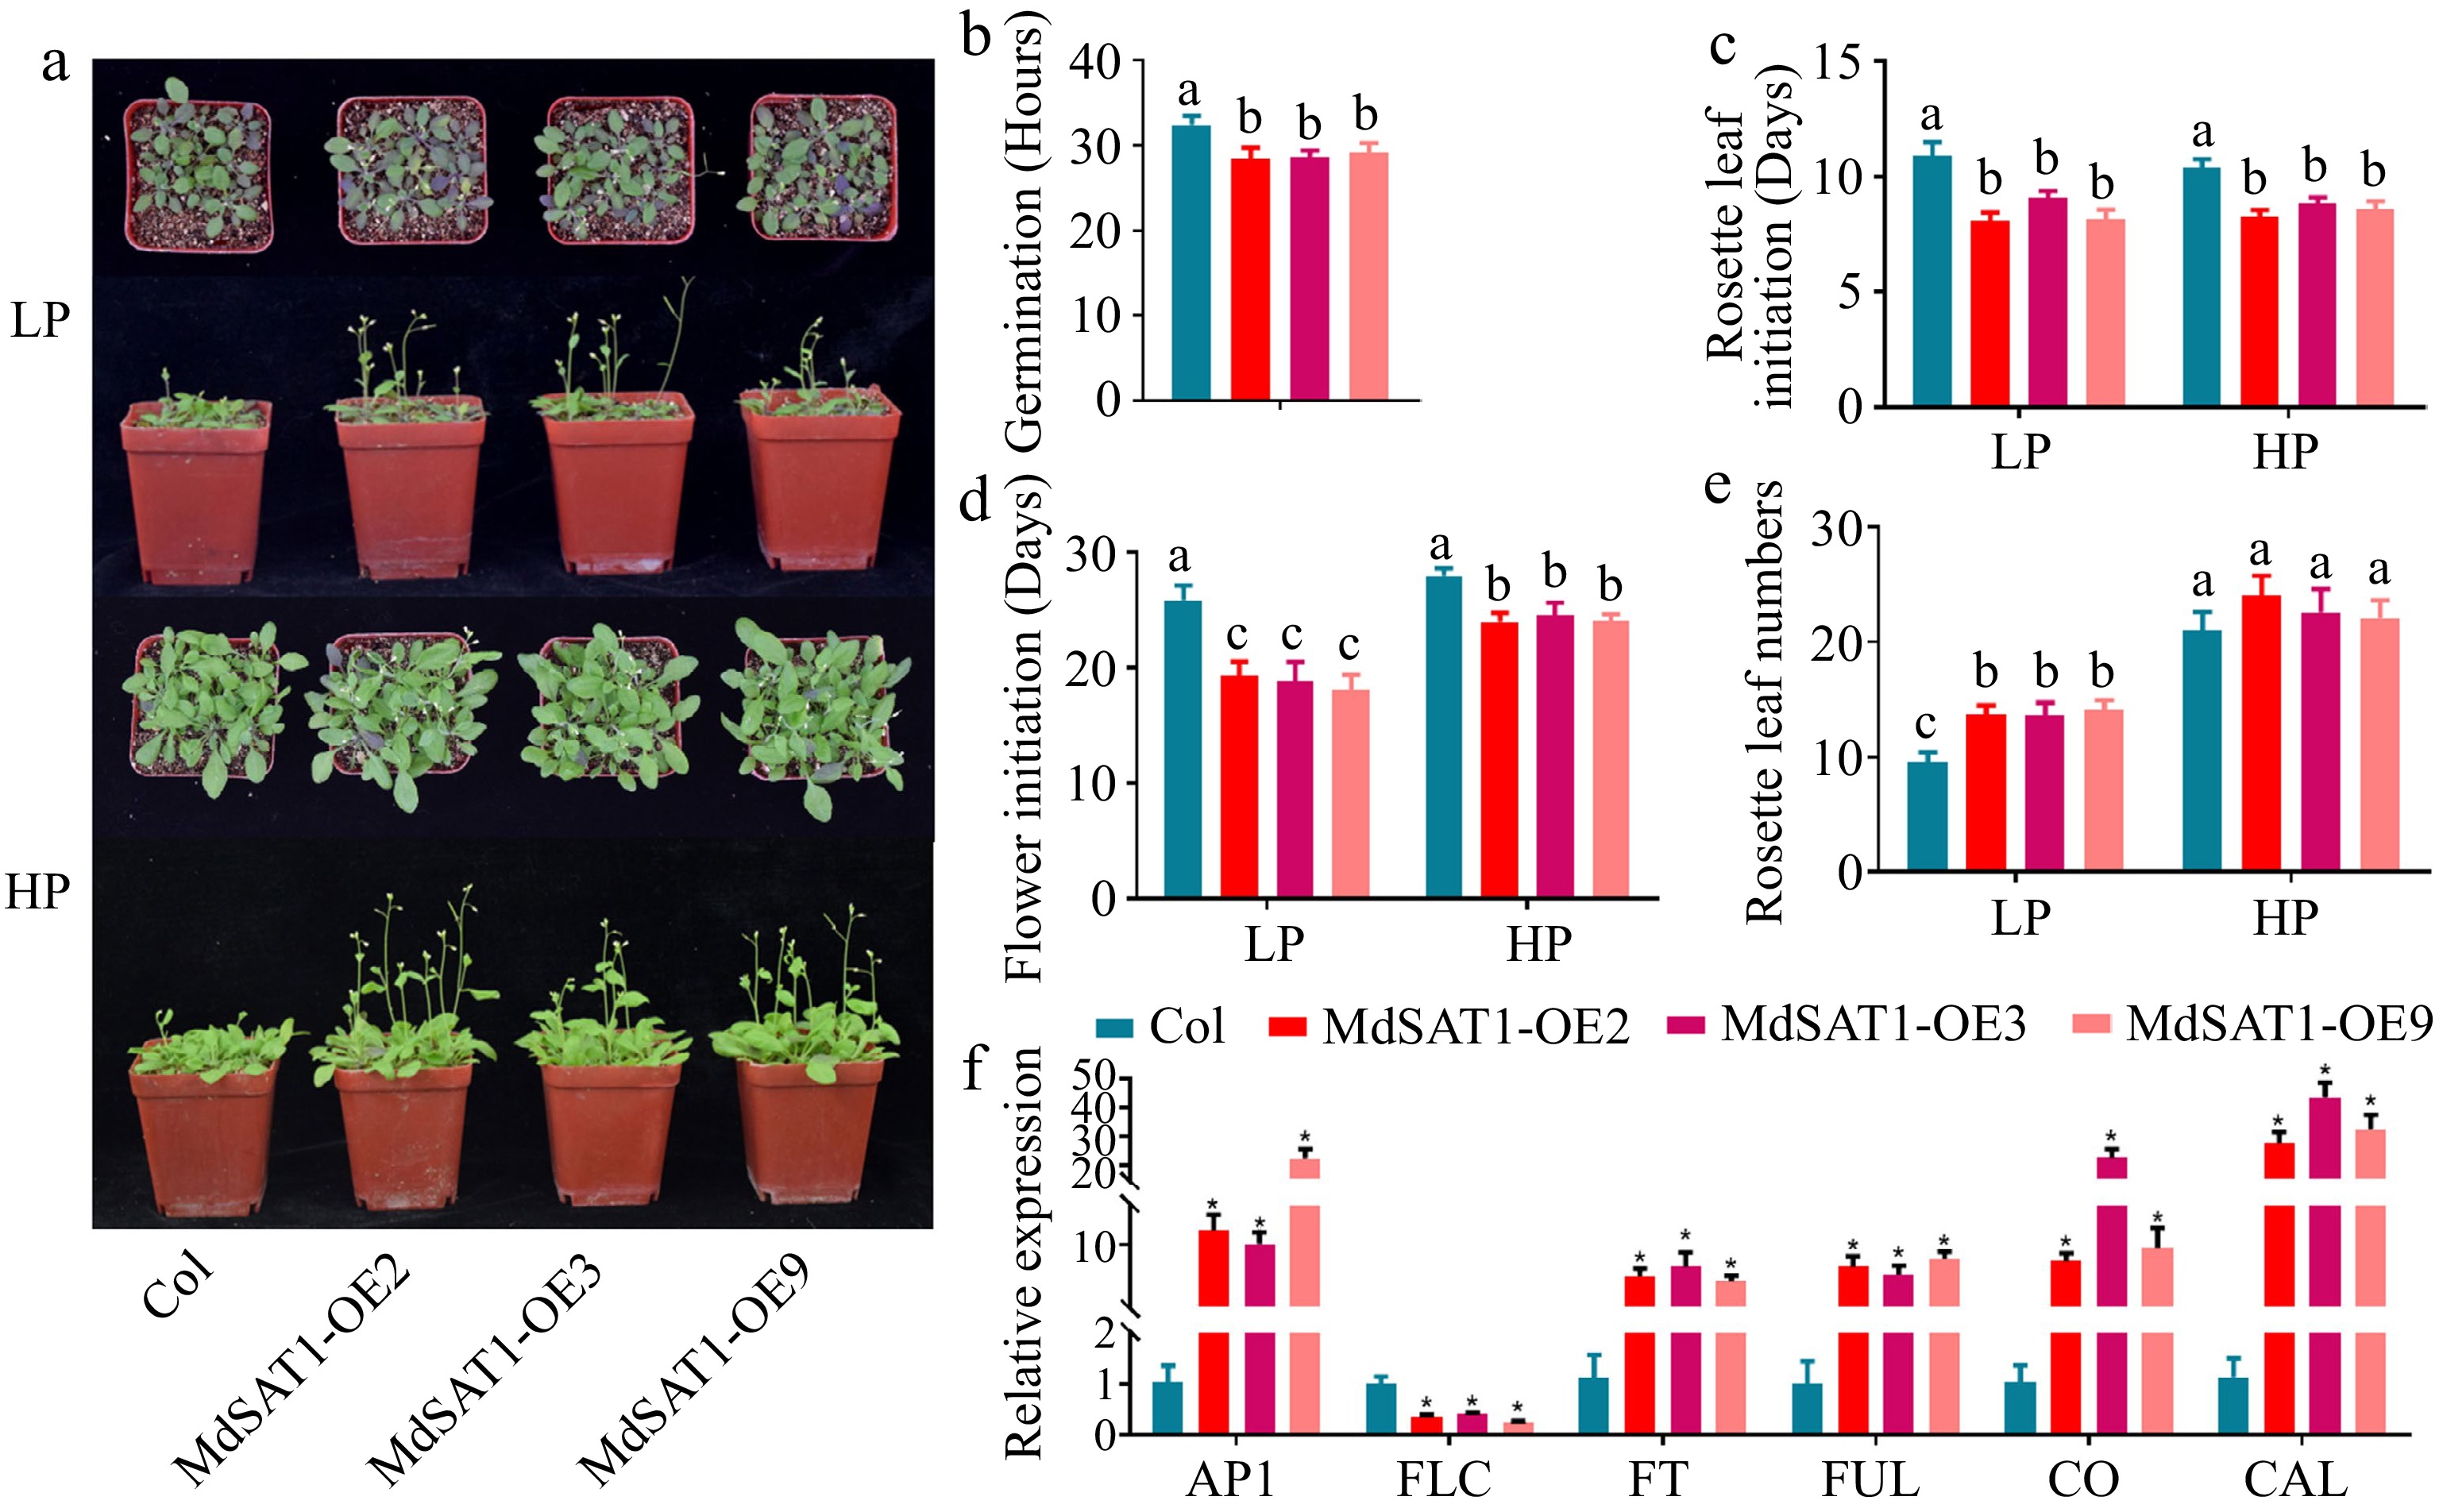
Figure 5.
MdSAT1 promotes early flowering. MdSAT1-OE and Col Arabidopsis plants were grown for 5 weeks under LP (1.25 μM K2HPO4) or HP (1.25 mM K2HPO4) conditions. Plants grown at 23 °C/21 °C for day/night with 16L/8D, with an irradiance of 150 μmol·m−2·s−1 and relative humidity of 60%−70%. (a) Morphological changes, (b) germination, (c) initiation of rosette leaves, (d) flower initiation, and (e) the number of rosette leaves are presented. (f) Transcript levels of AP1, FLC, FT, FUL, CO, and CAL in MdSAT1-OE and Col plants under LP conditions. Error bars represent standard deviations (n ≥ 3). * and different letters above the bars indicate significantly different values (p < 0.05).
-
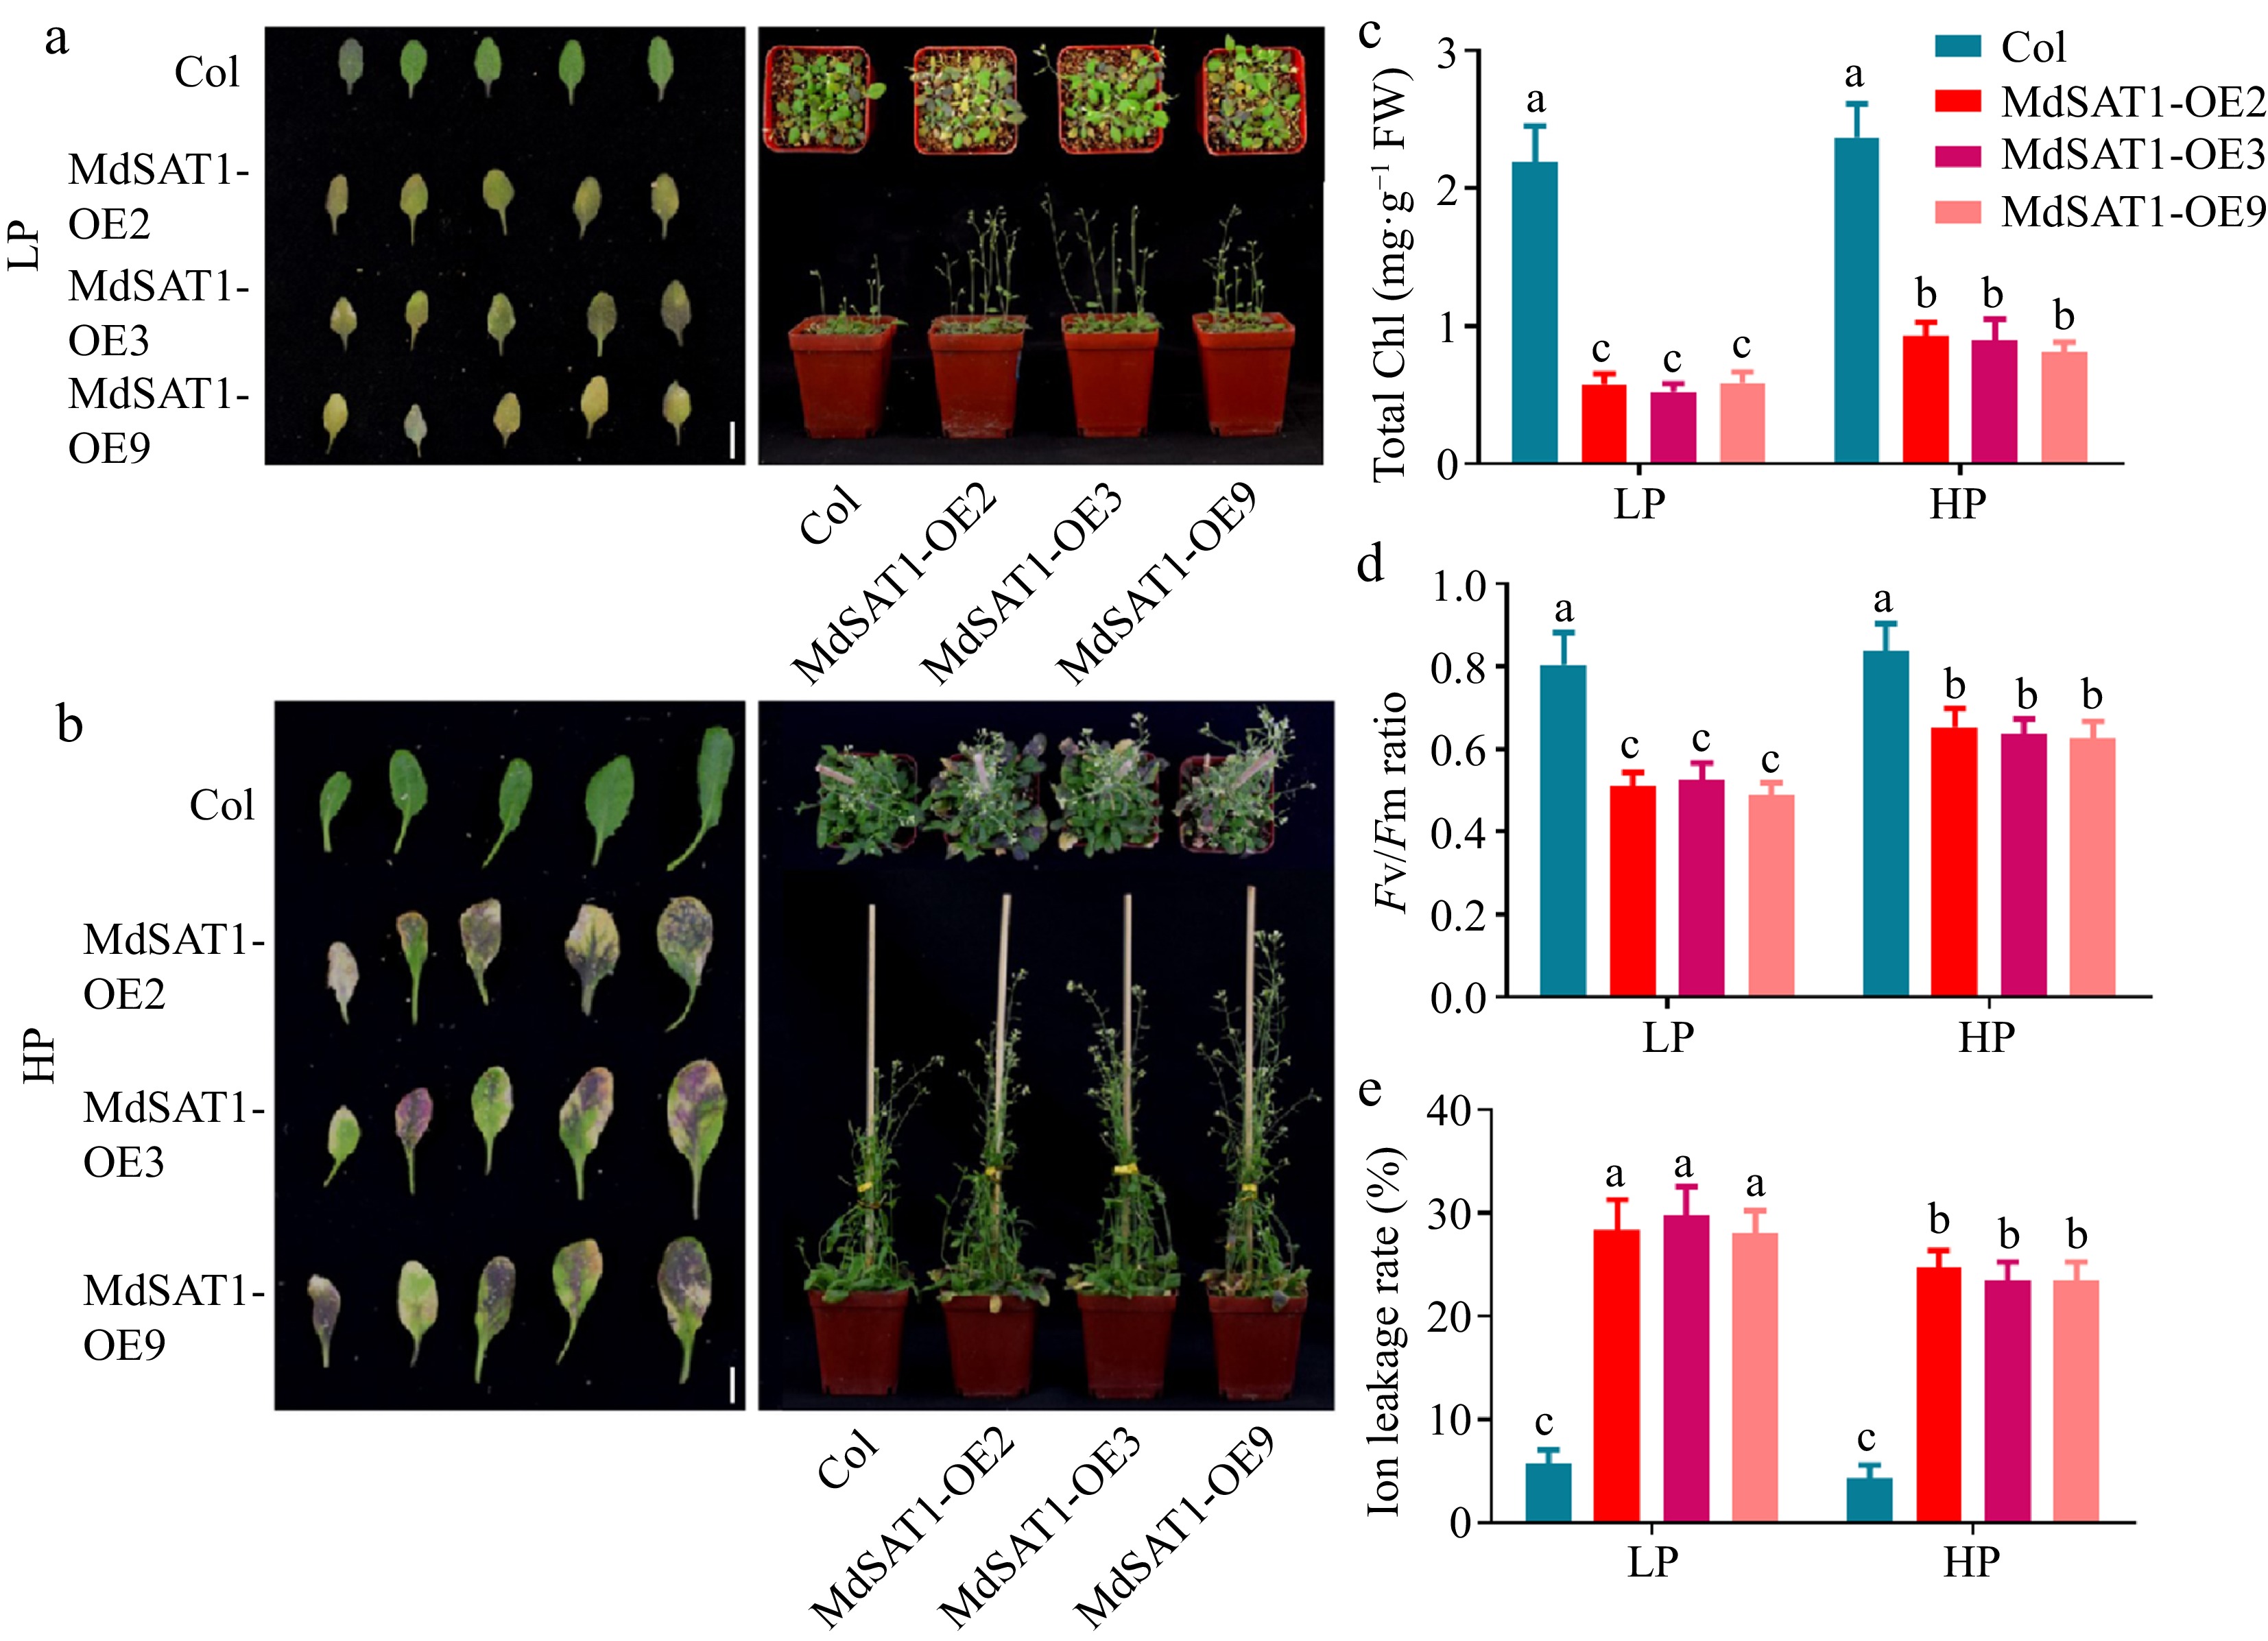
Figure 6.
MdSAT1 promotes leaf senescence. MdSAT1-OE and Col Arabidopsis plants were grown for 7 weeks under LP (1.25 μM K2HPO4) or HP (1.25 mM K2HPO4) conditions. Plants grown at 23 °C/21 °C for day/night with 16L/8D, with an irradiance of 150 μmol·m−2·s−1 and relative humidity of 60%−70%. (a), (b) Morphological changes, (c) total chlorophyll, (d) Fv/Fm ratio, and (e) ion leakage rate are presented. Error bars represent standard deviations (n ≥ 3). Different letters above the bars indicate significantly different values (p < 0.05).
Figures
(6)
Tables
(0)