-
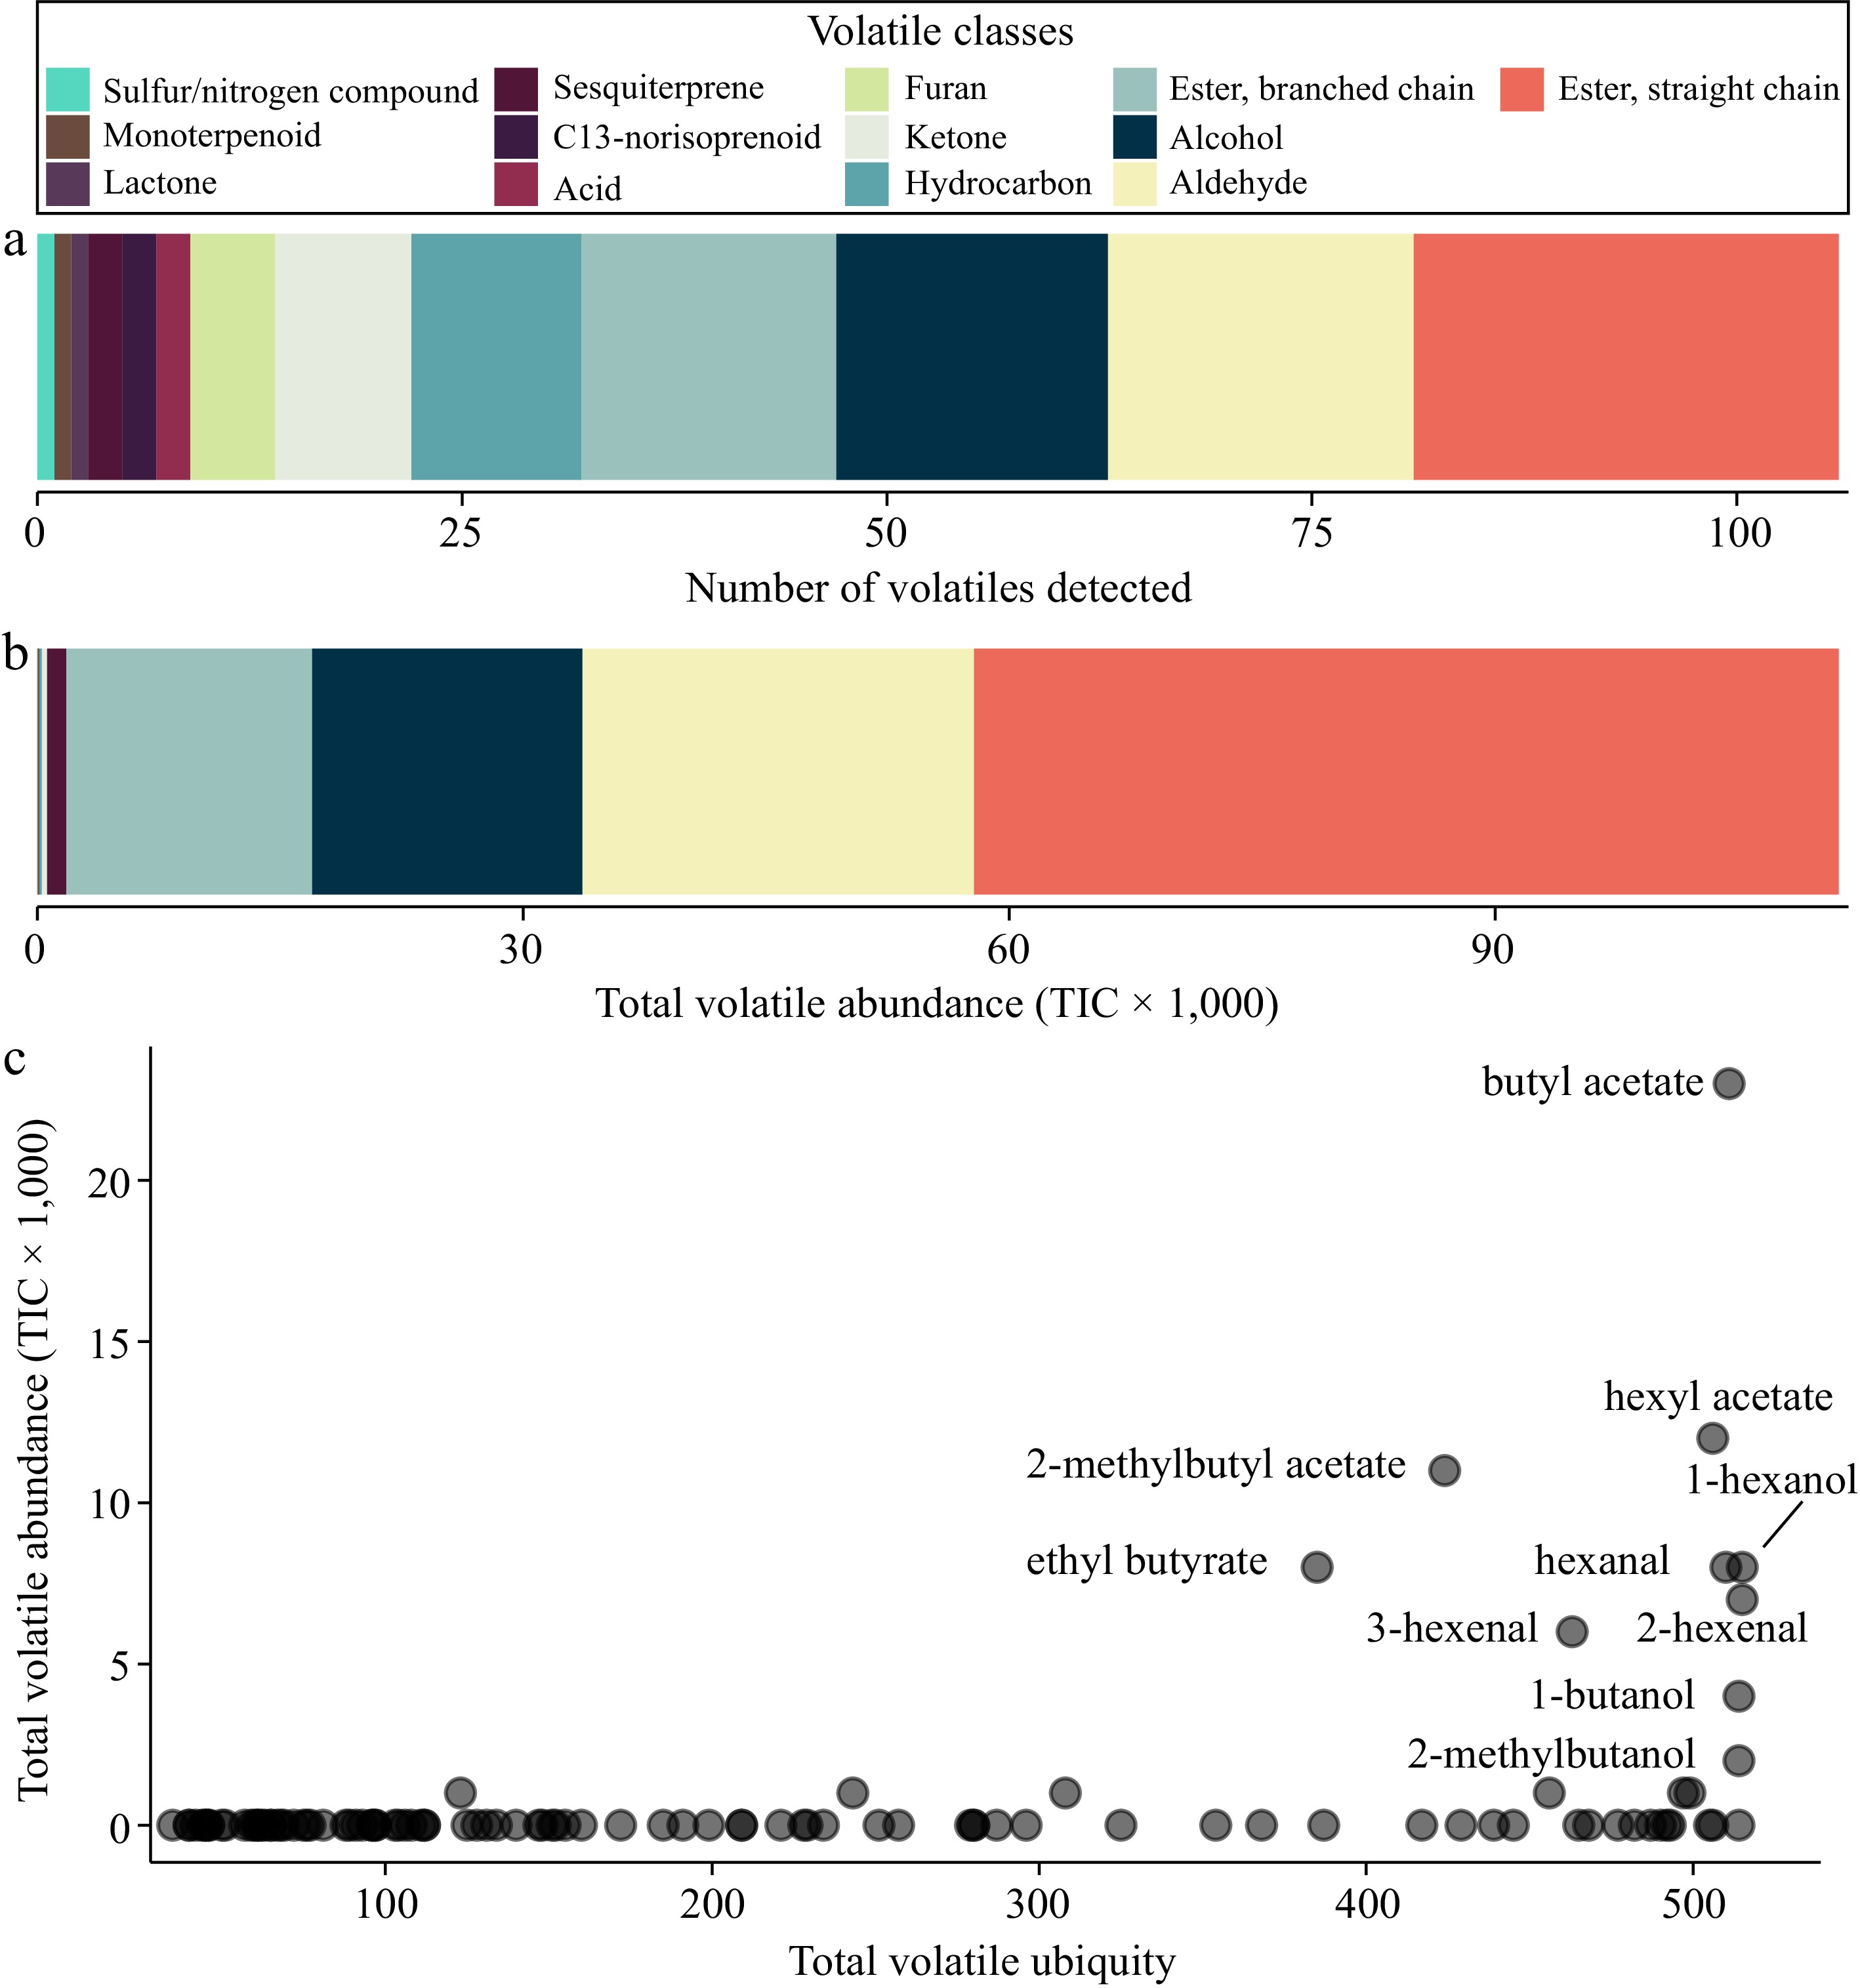
Figure 1.
VOC composition across 515 apple varieties. (a) The number of VOCs detected by VOC class. (b) The total volatile abundance by VOC class. (c) The ubiquity of each VOC (x-axis) is plotted against its abundance (y-axis). Ubiquity is defined as the number of samples in which a VOC was detected.
-
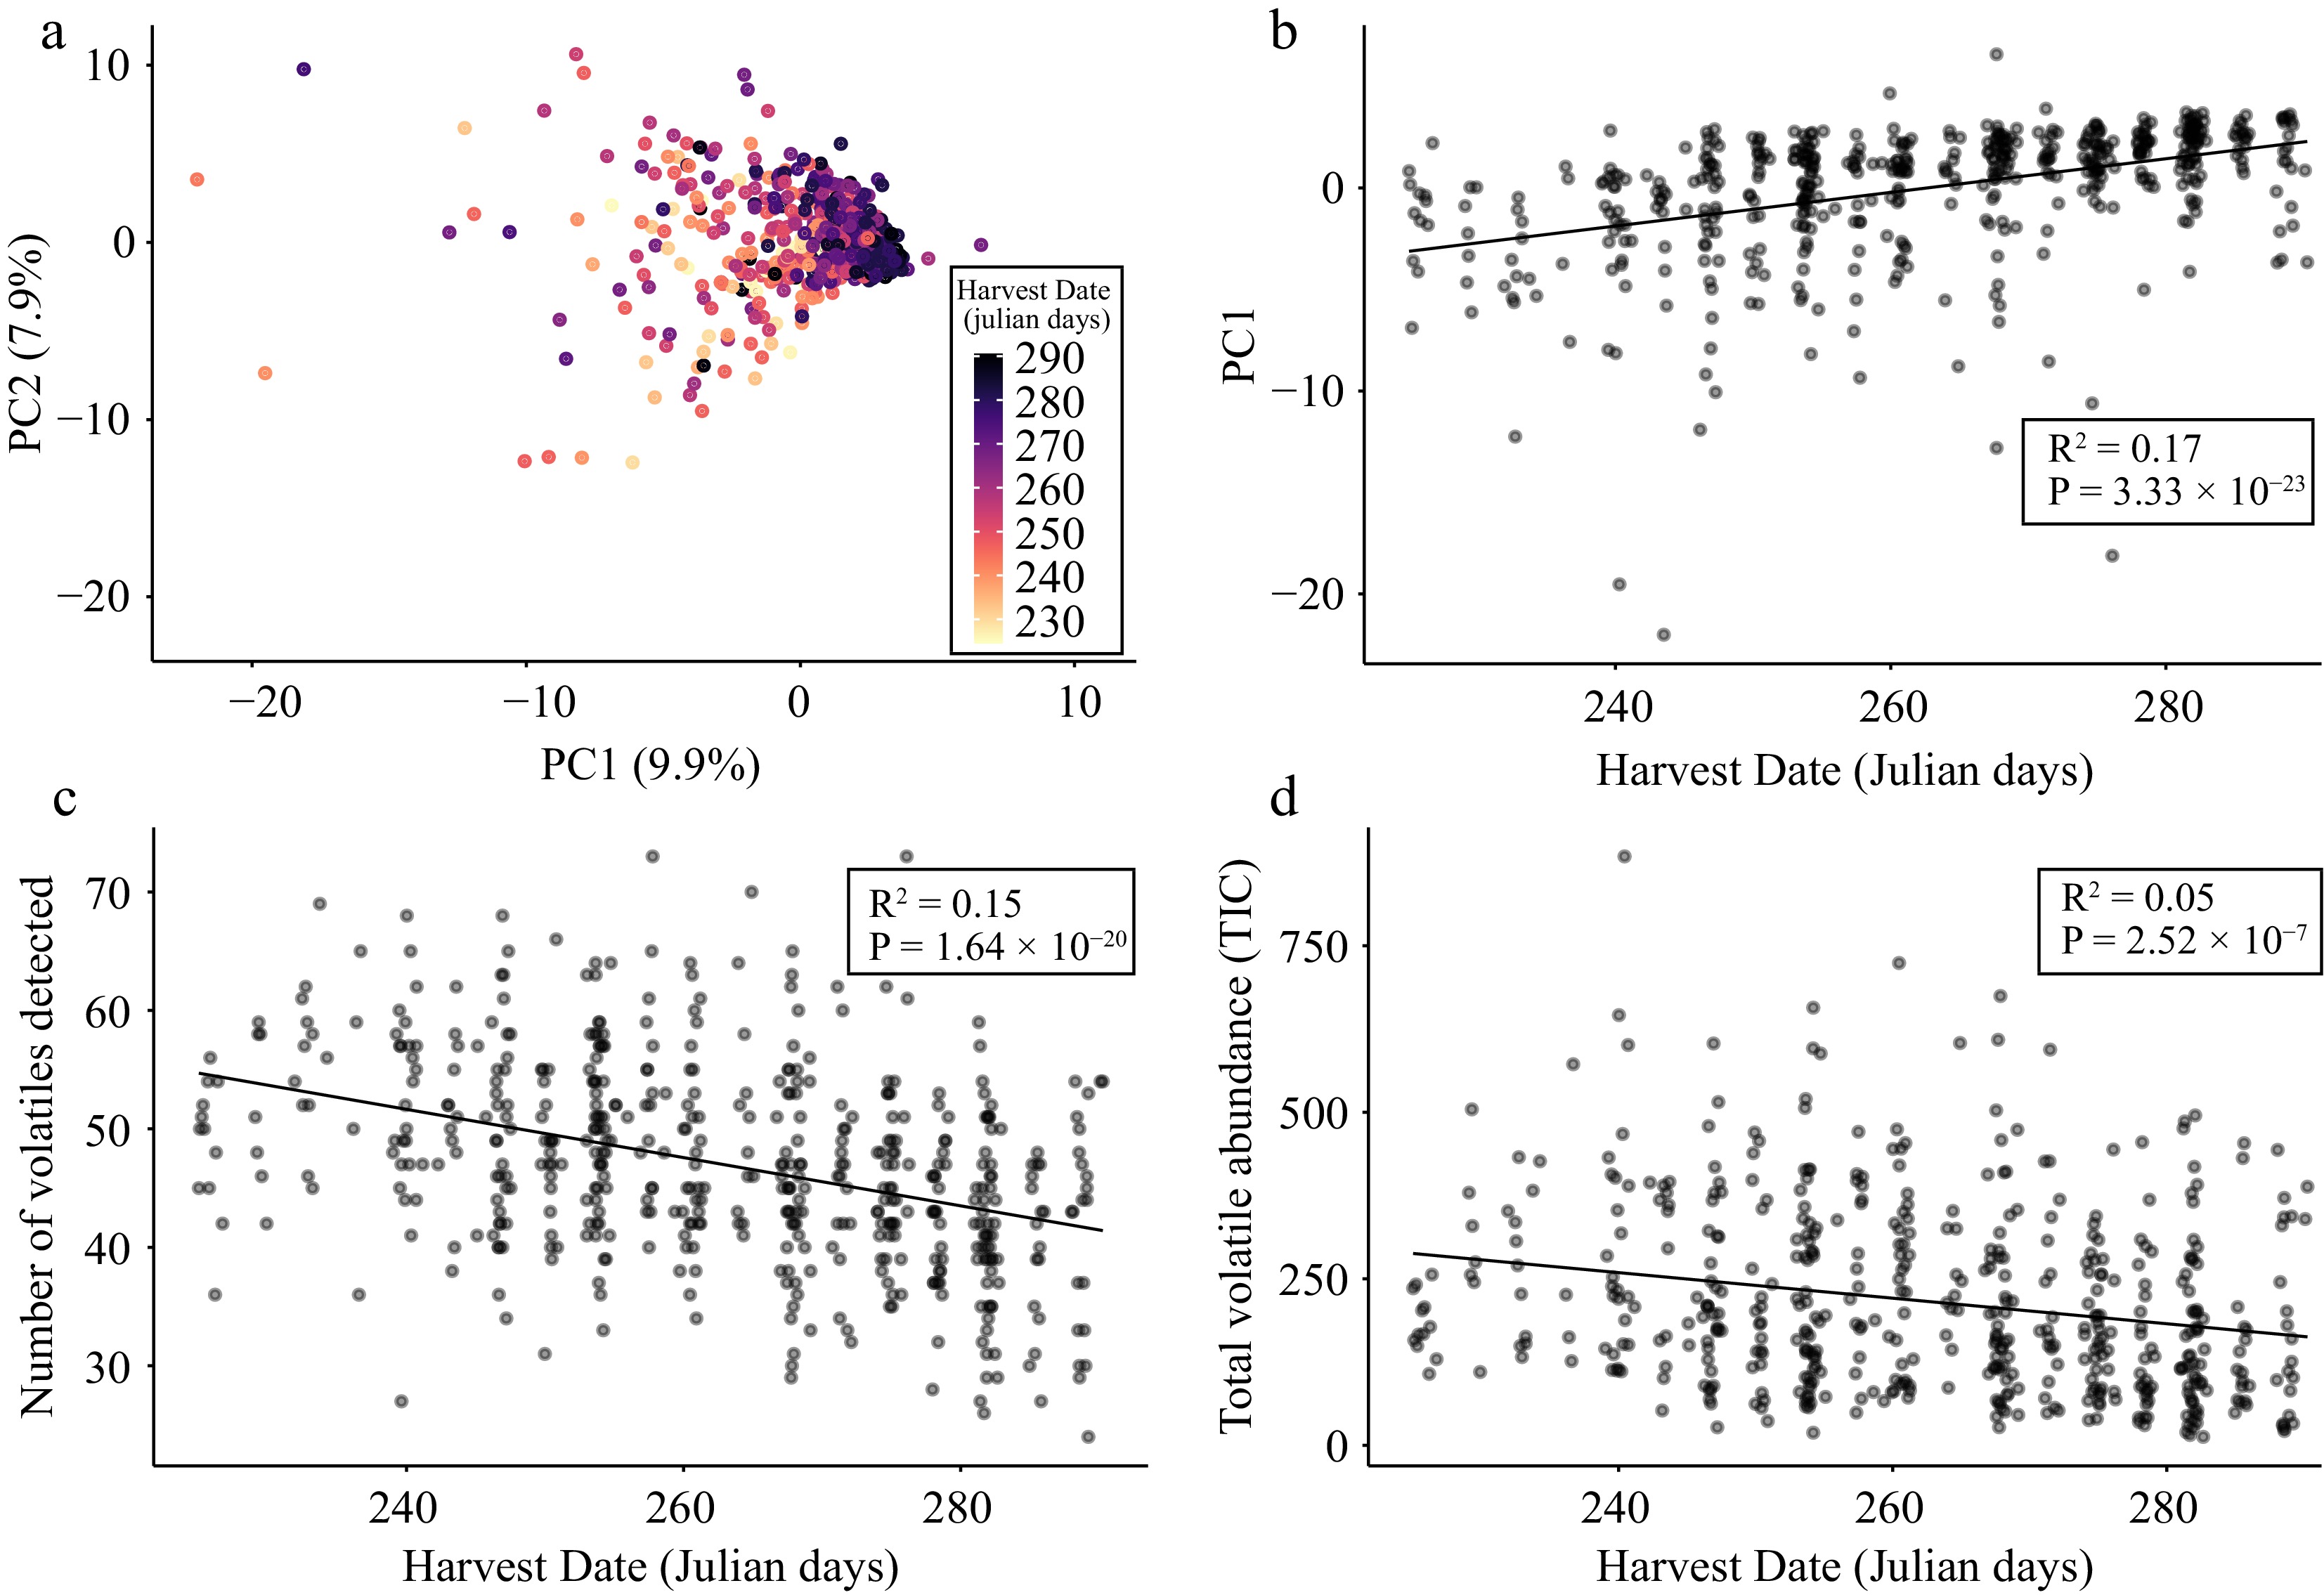
Figure 2.
Apple volatilome variation is associated with harvest date. (a) PCA bi-plot of PC1 and PC2 derived from a matrix of 106 VOCs across 515 apple varieties. Each point is a unique apple variety that is coloured according to its harvest date. (b) Scatter plot of PC1 values and harvest date across 515 varieties. (c) Scatter plot of VOC ubiquity (i.e., the number of VOCs detected per sample) and harvest date across 515 varieties. (d) Scatter plot of total volatile abundance and harvest date across 515 varieties. Lines of best fit, R2 and P values result from Pearson correlations between variables.
-
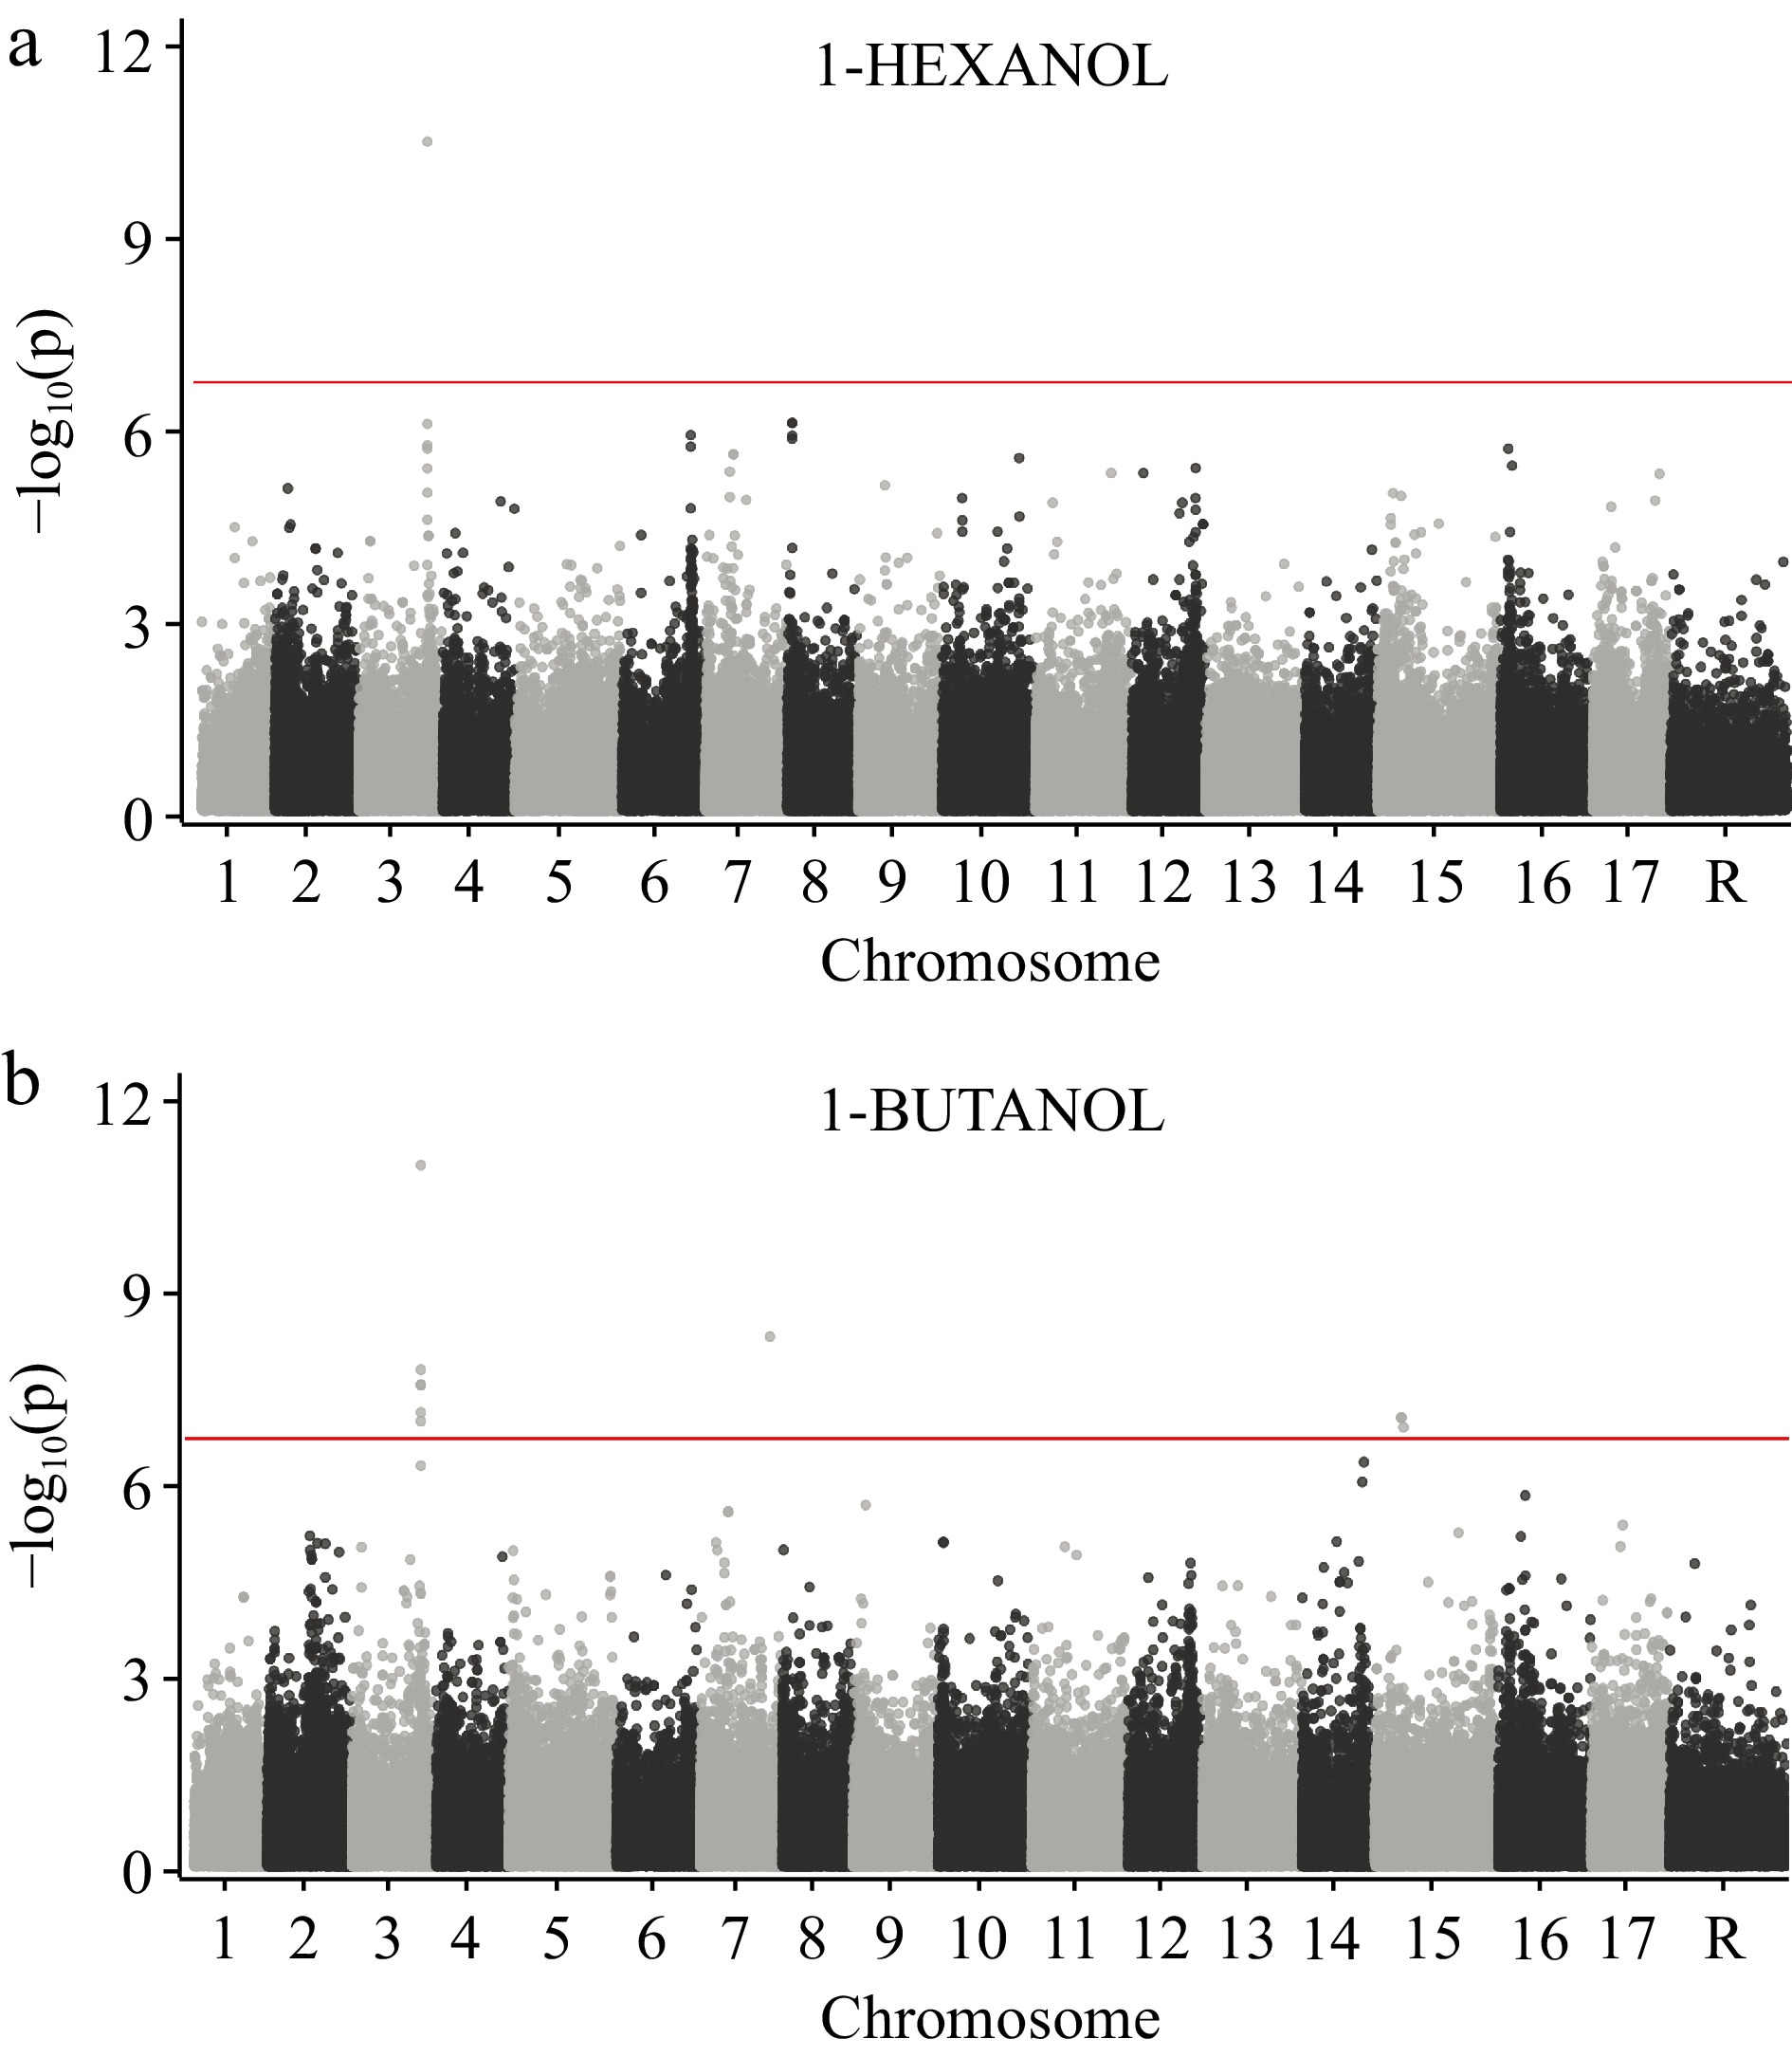
Figure 3.
GWAS of 1-hexanol and 1-butanol across 515 apple varieties using 250,579 SNPs. (a) Manhattan plot for 1-hexanol. (b) Manhattan plot for 1-butanol. The horizontal red line represents the significance threshold after correcting for multiple comparisons (see Methods). Chromosome 'R' is composed of contigs that remain unanchored to the reference genome.
-
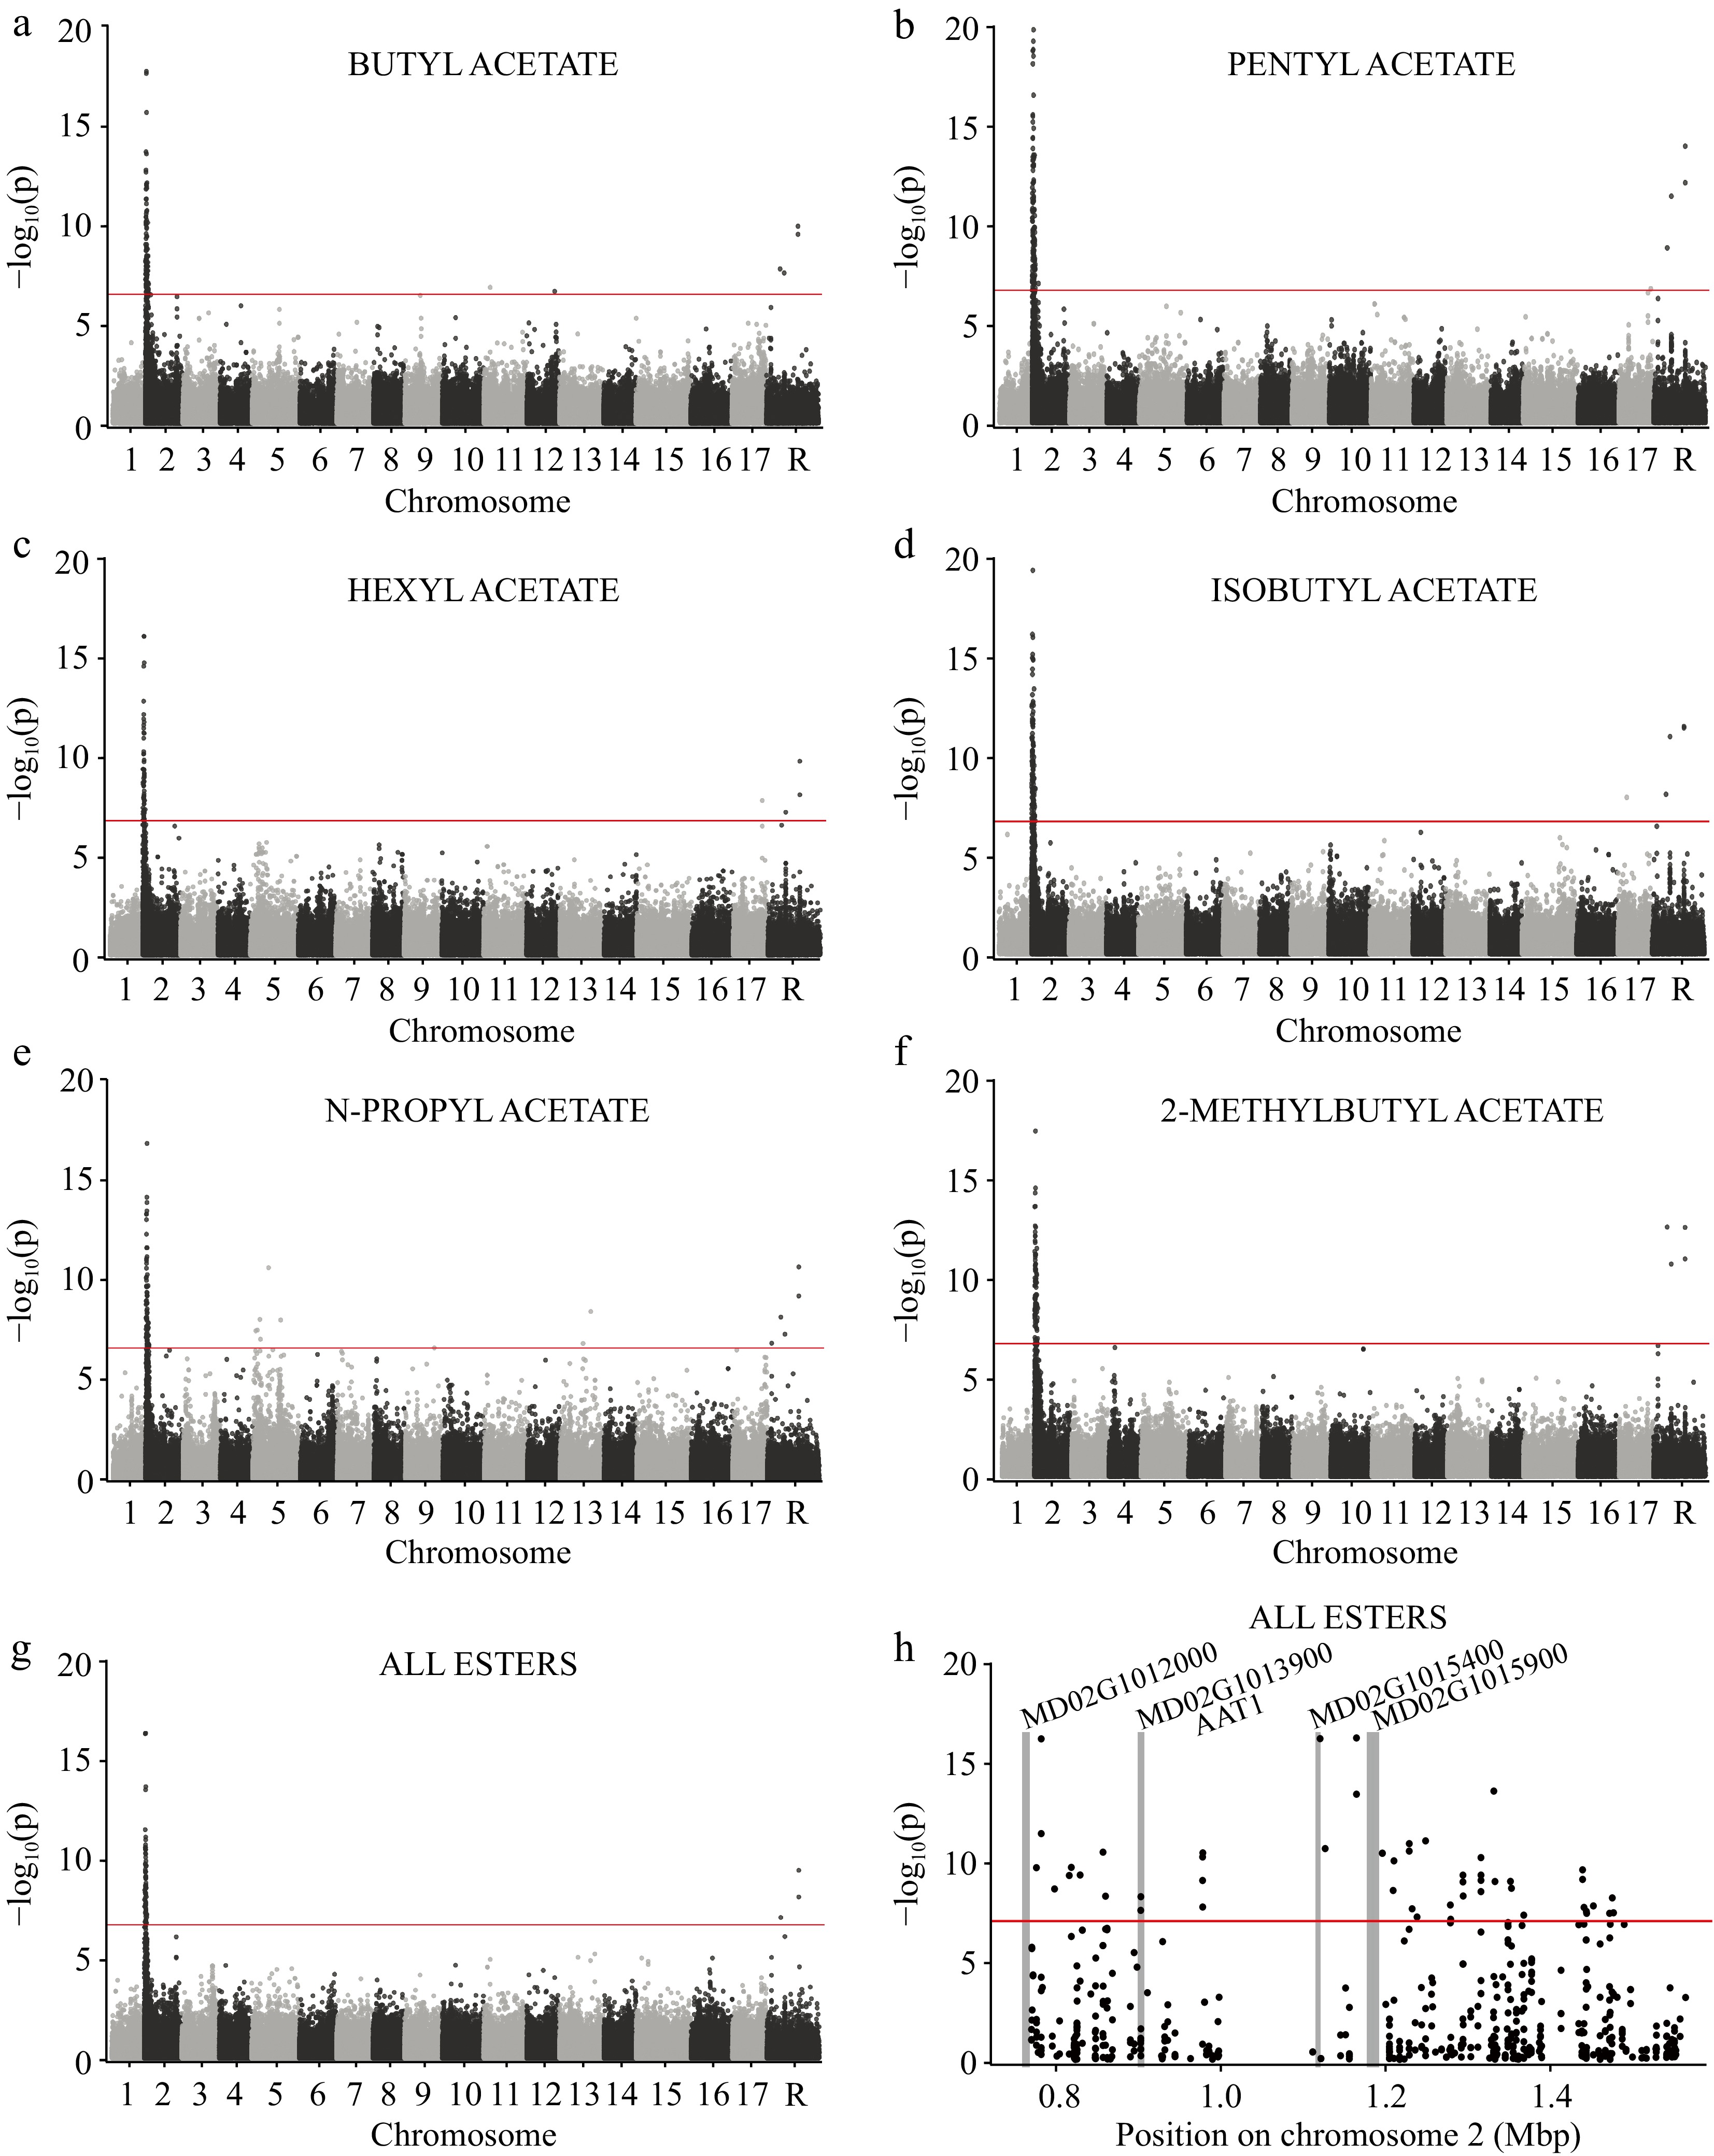
Figure 4.
GWAS of several esters across 515 apple varieties using 250,579 SNPs. Genome-wide manhattan plots are shown for (a) butyl acetate, (b) pentyl acetate, (c) hexyl acetate, (d) isobutyl acetate, (e) n-propyl acetate, (f) 2-methylbutyl acetate, and the (g) sum of all esters. The horizontal red lines represent the significance threshold after correcting for multiple comparisons (see Methods). Chromosome 'R' is composed of contigs that remain unanchored to the reference genome. (h) A manhattan plot showing only the locus of large effect on chromosome 2. The vertical gray bars indicate the locations of annotated genes within the region and gene names appear at the top of each bar.
Figures
(4)
Tables
(0)