-
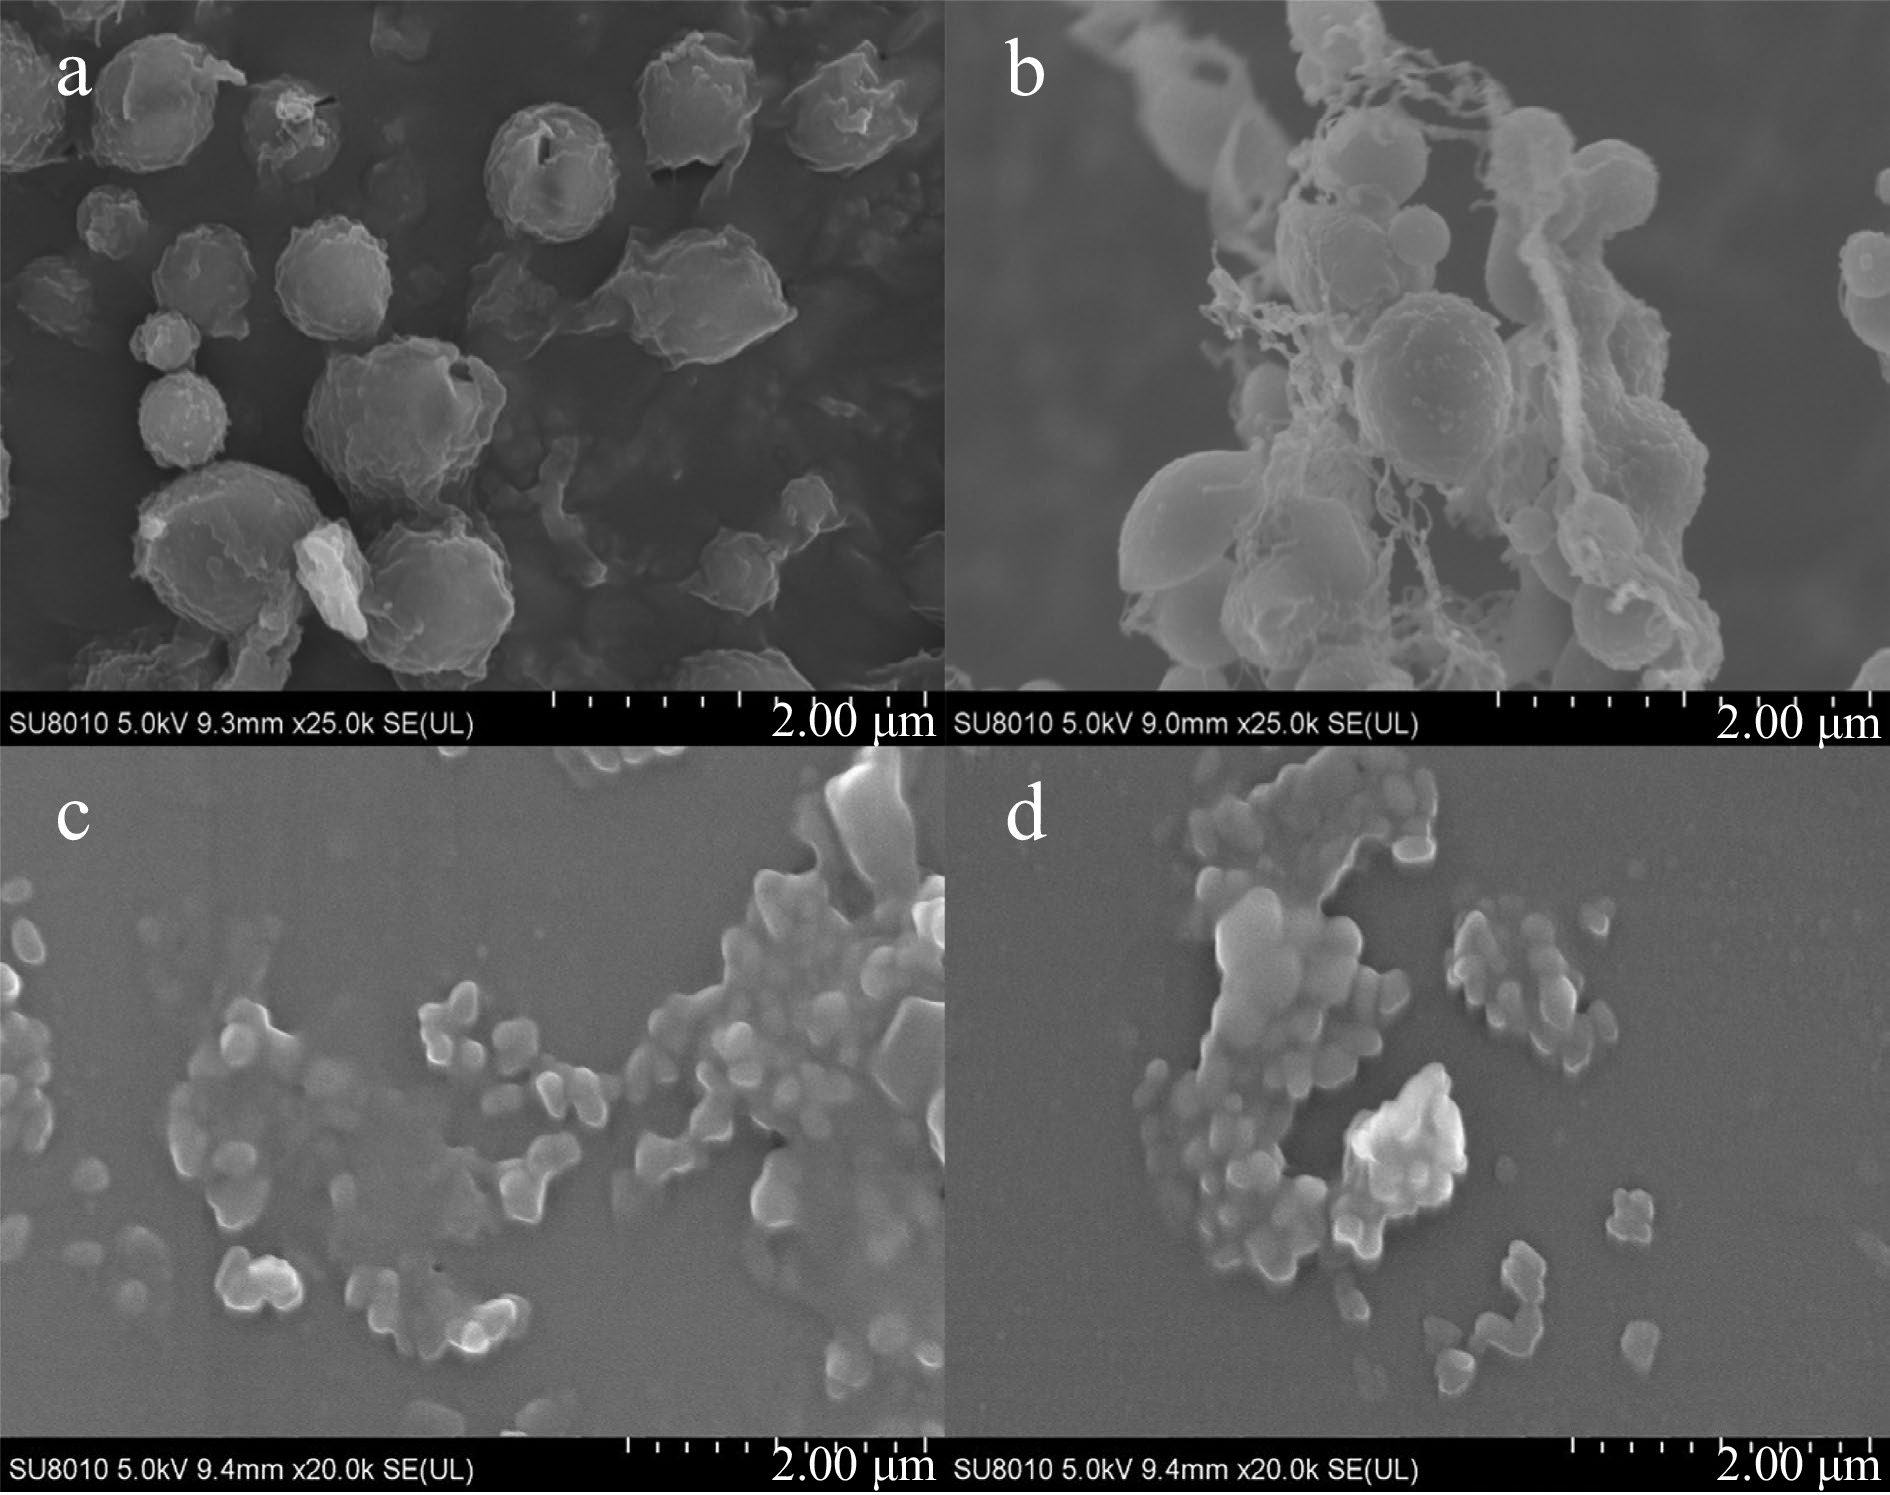
Figure 1.
SEM images of (a) ZPs, (b) ZPPs, (c) SPs and (d) SPPs.
-
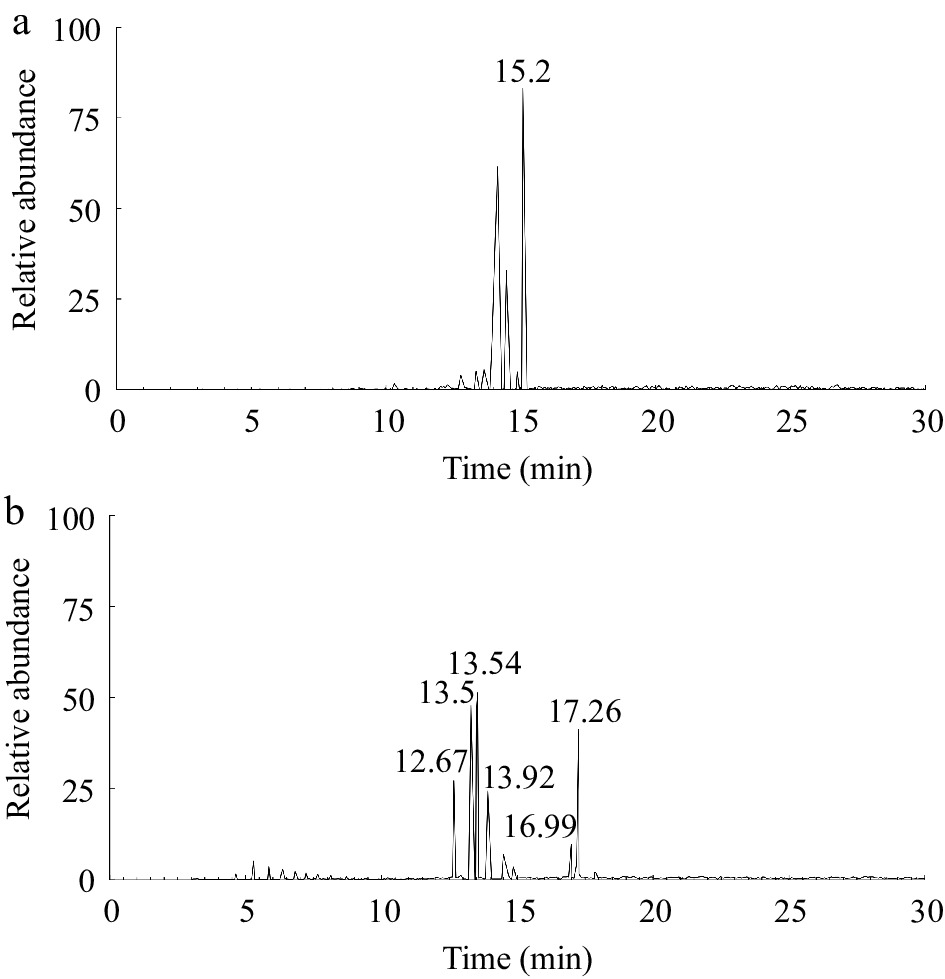
Figure 2.
GC–MS ion chromatograms of (a) stigmasterol and (b) POPs.
-
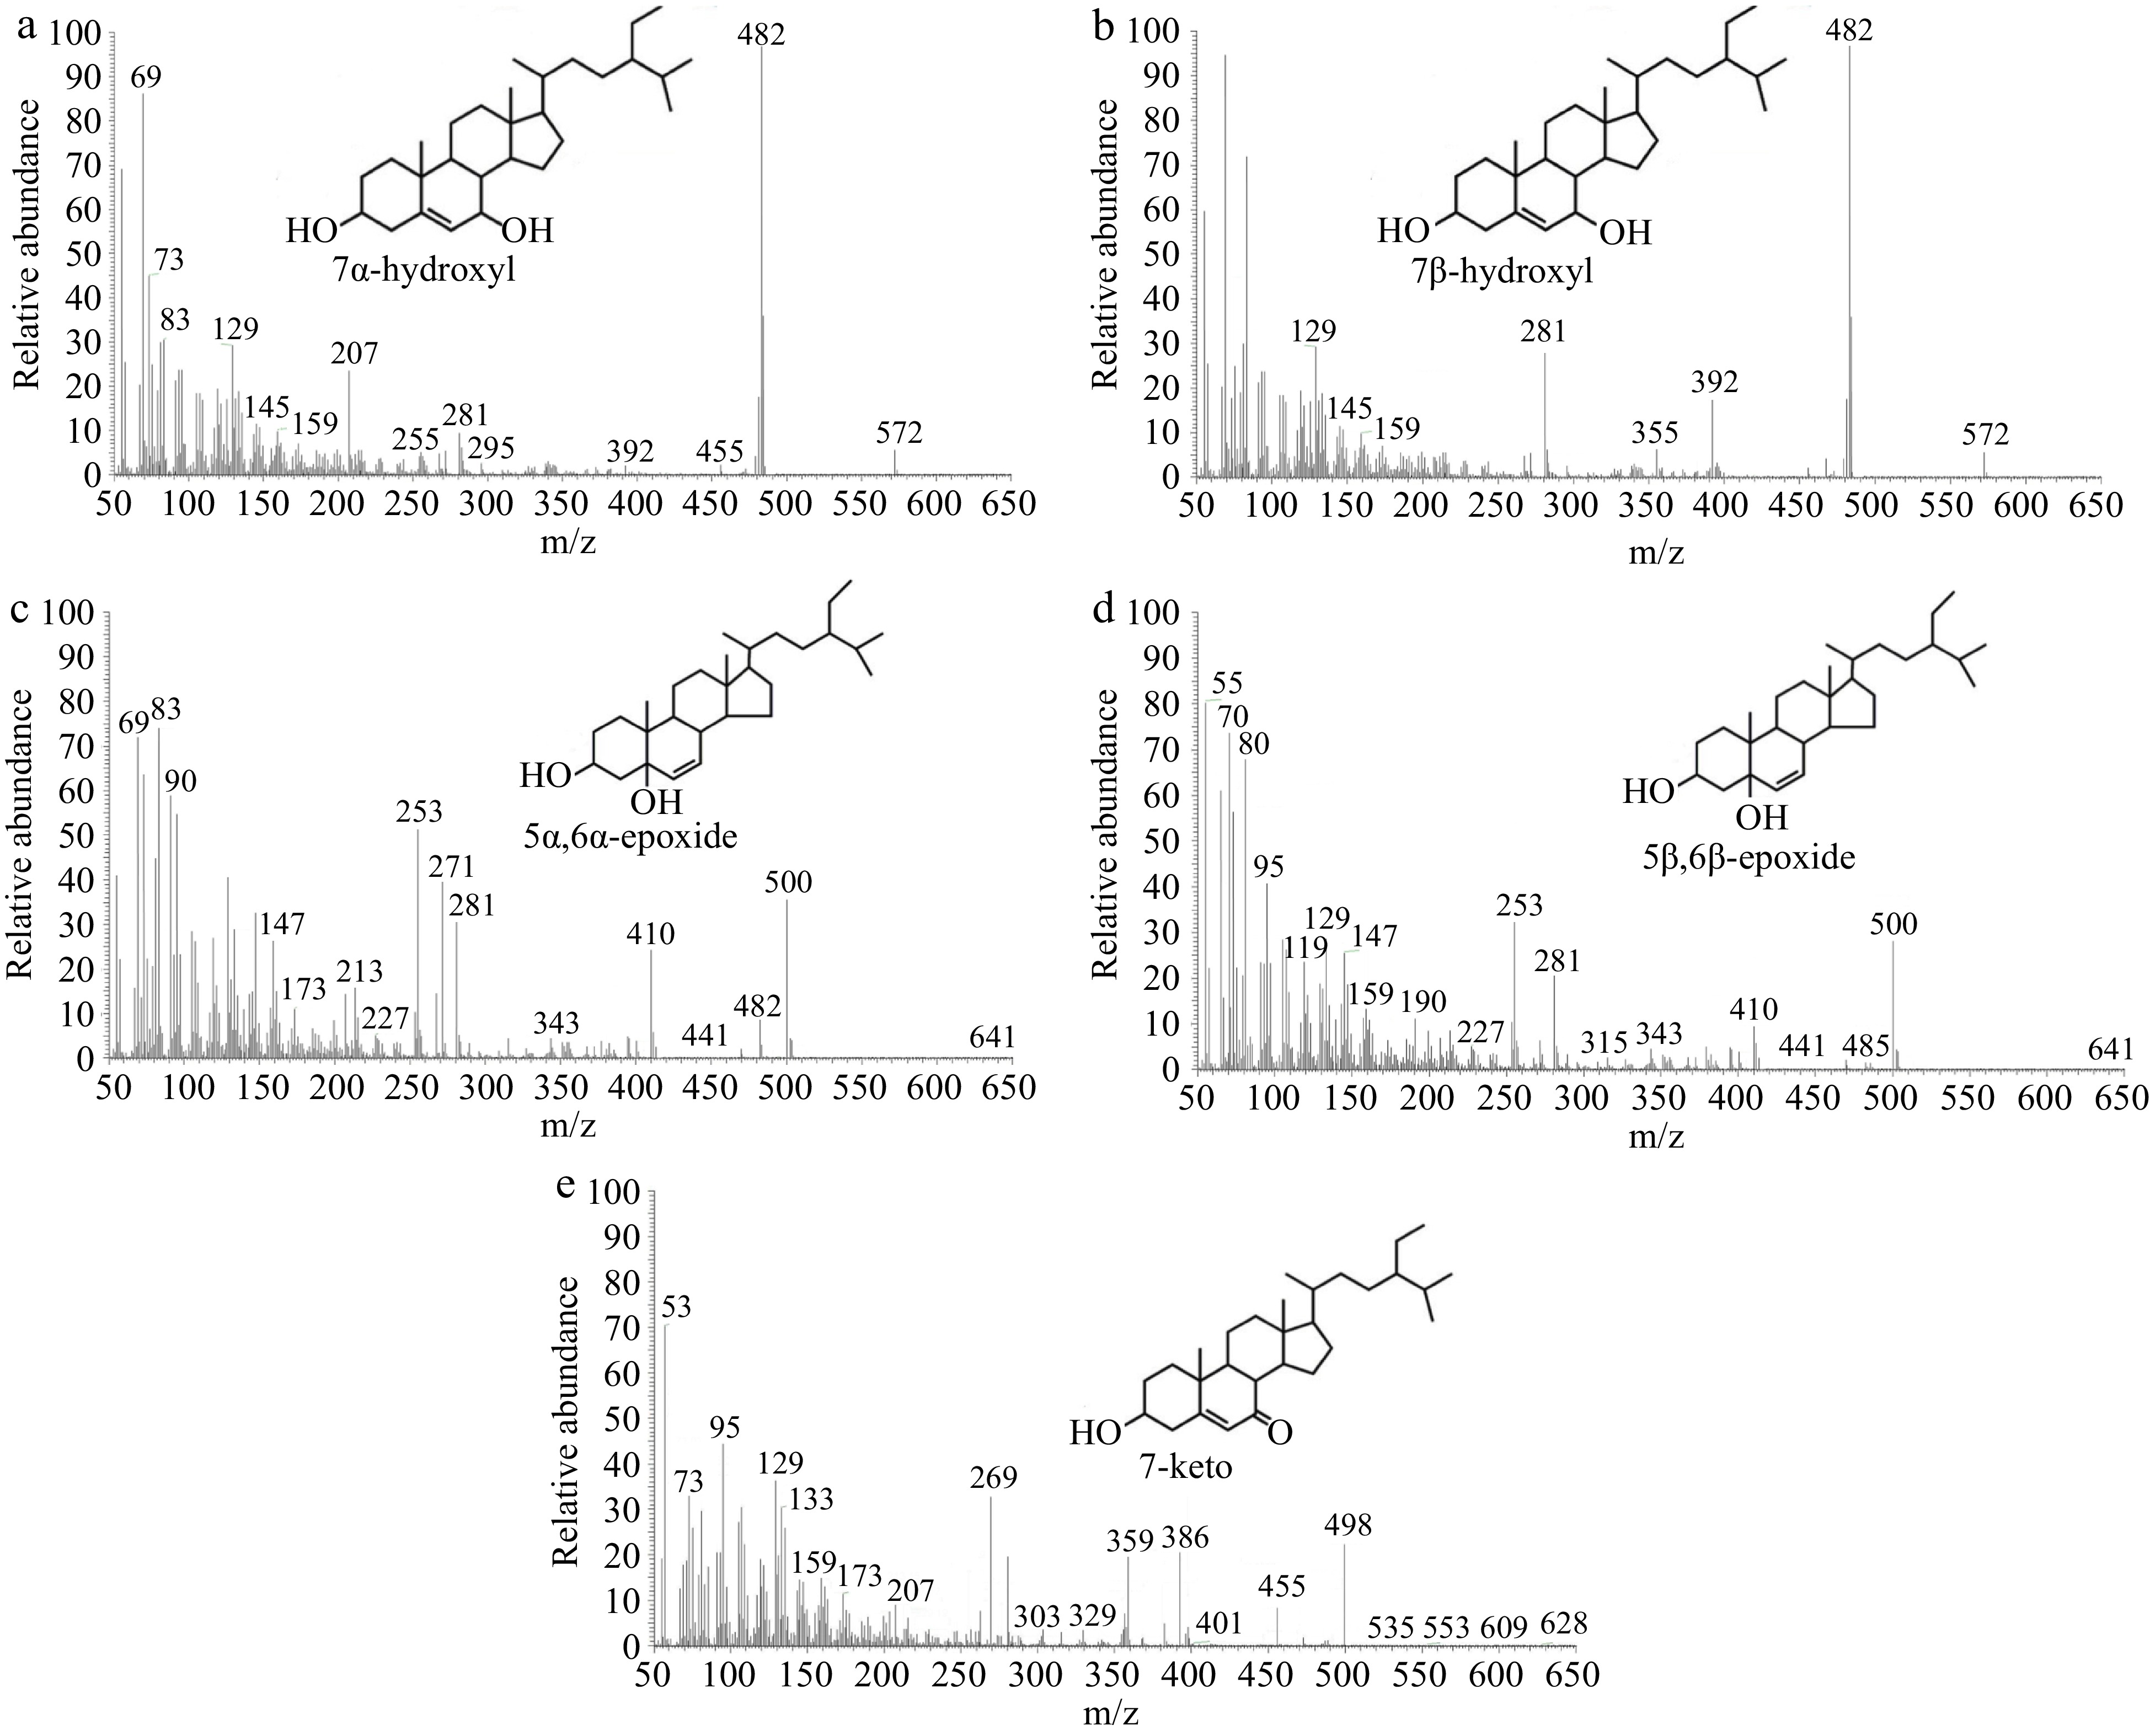
Figure 3.
Mass spectra of (a) 7α -hydroxy, (b) 7β-hydroxy, (c) 5α,6α-epoxy, (d) 5β,6β-epoxy and (e) 7-keto.
-
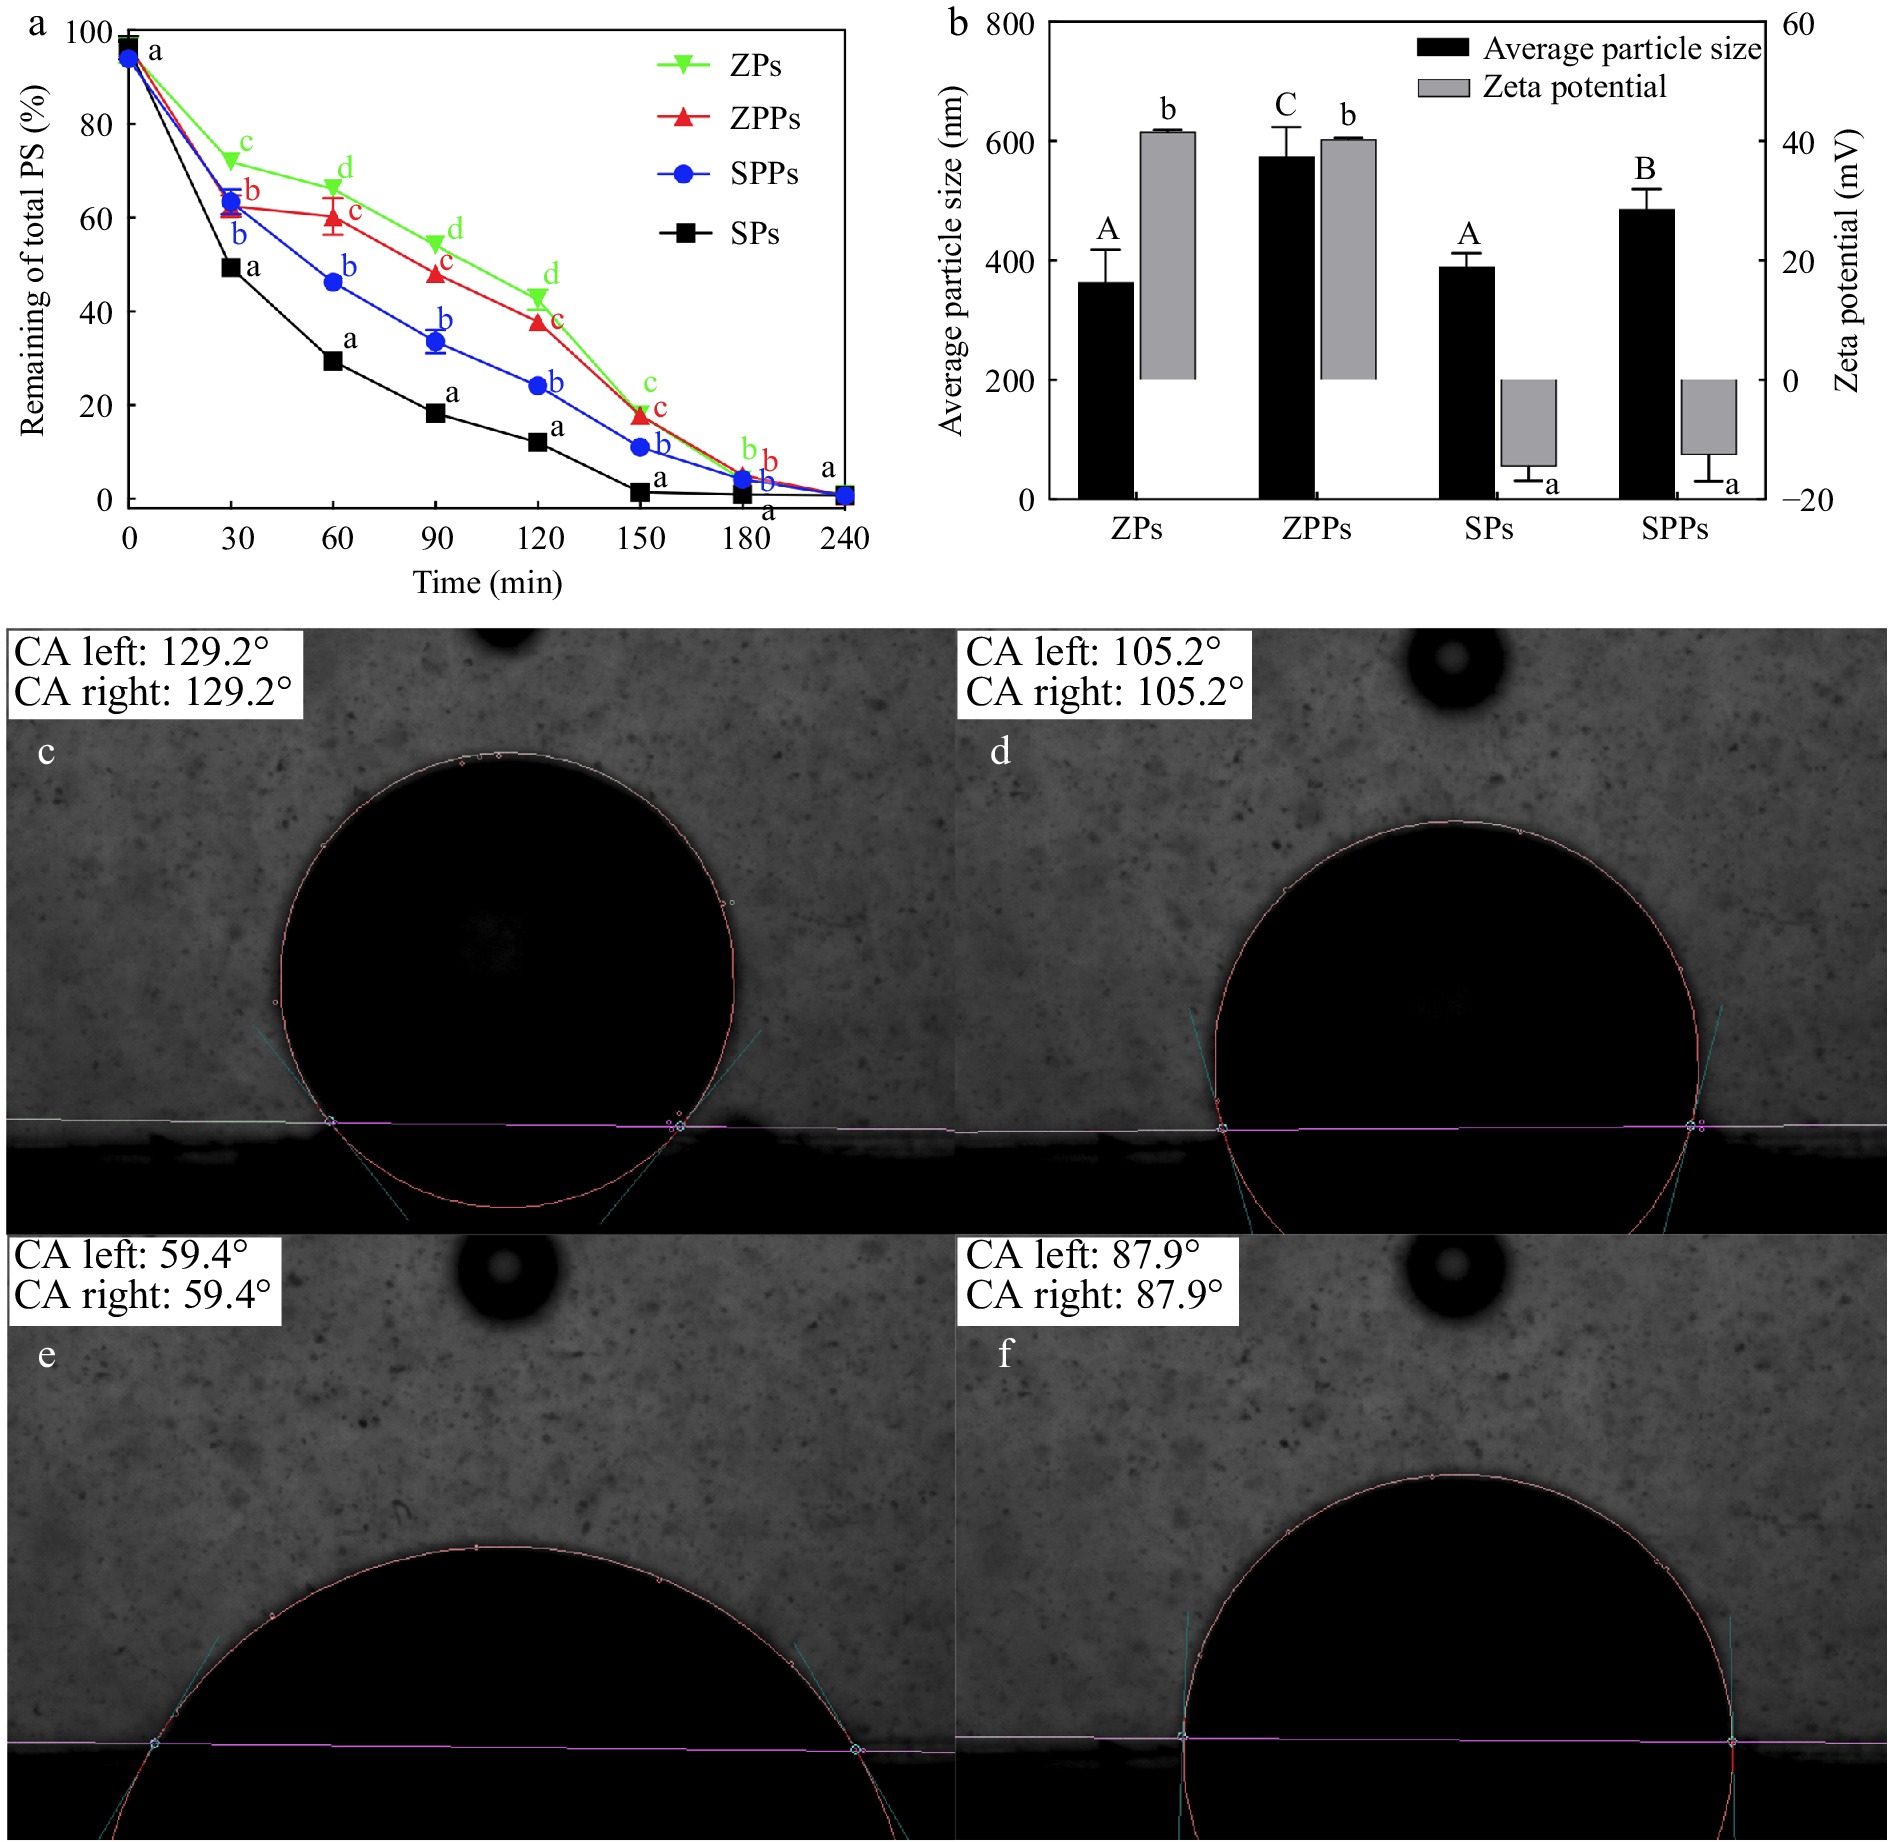
Figure 4.
(a) Remaining percentage of total stigmasterol. (b) Average particle size and zeta-potential of particles. The three-phase contact angle of (c) ZPs, (d) ZPPs, (e) SPs and (f) SPPs.
-
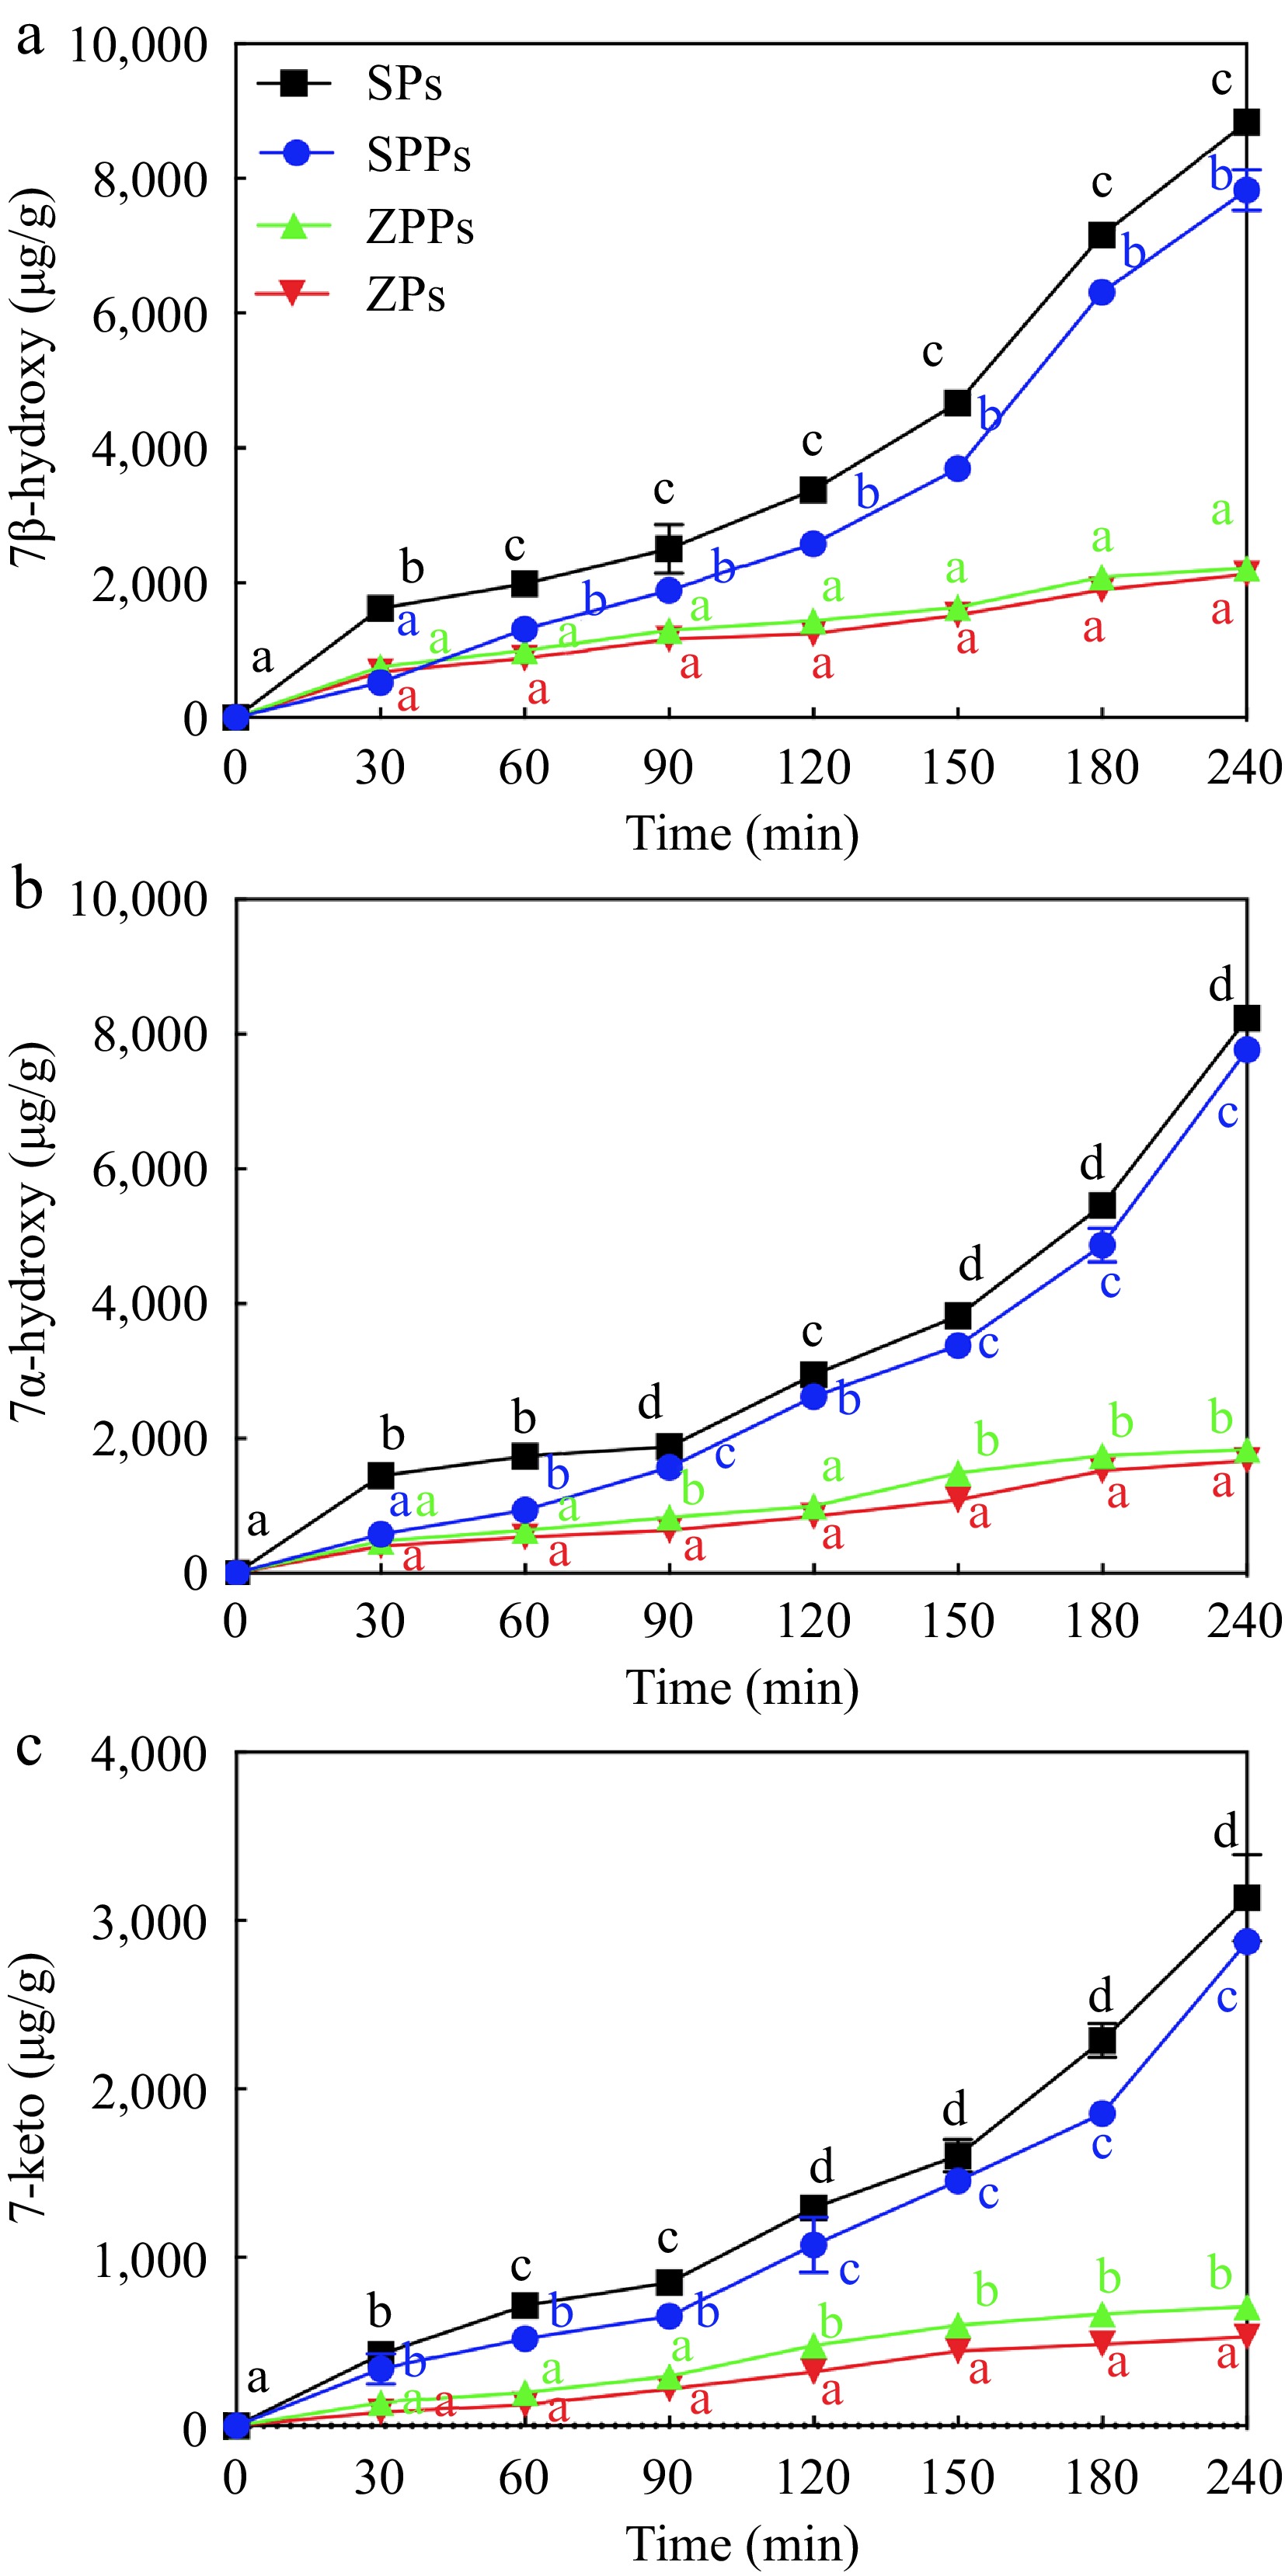
Figure 5.
POPs content derived from (a) 7β-hydroxy, (b) 7α-hydroxy and (c) 7-keto in particles under UV light exposure.
-
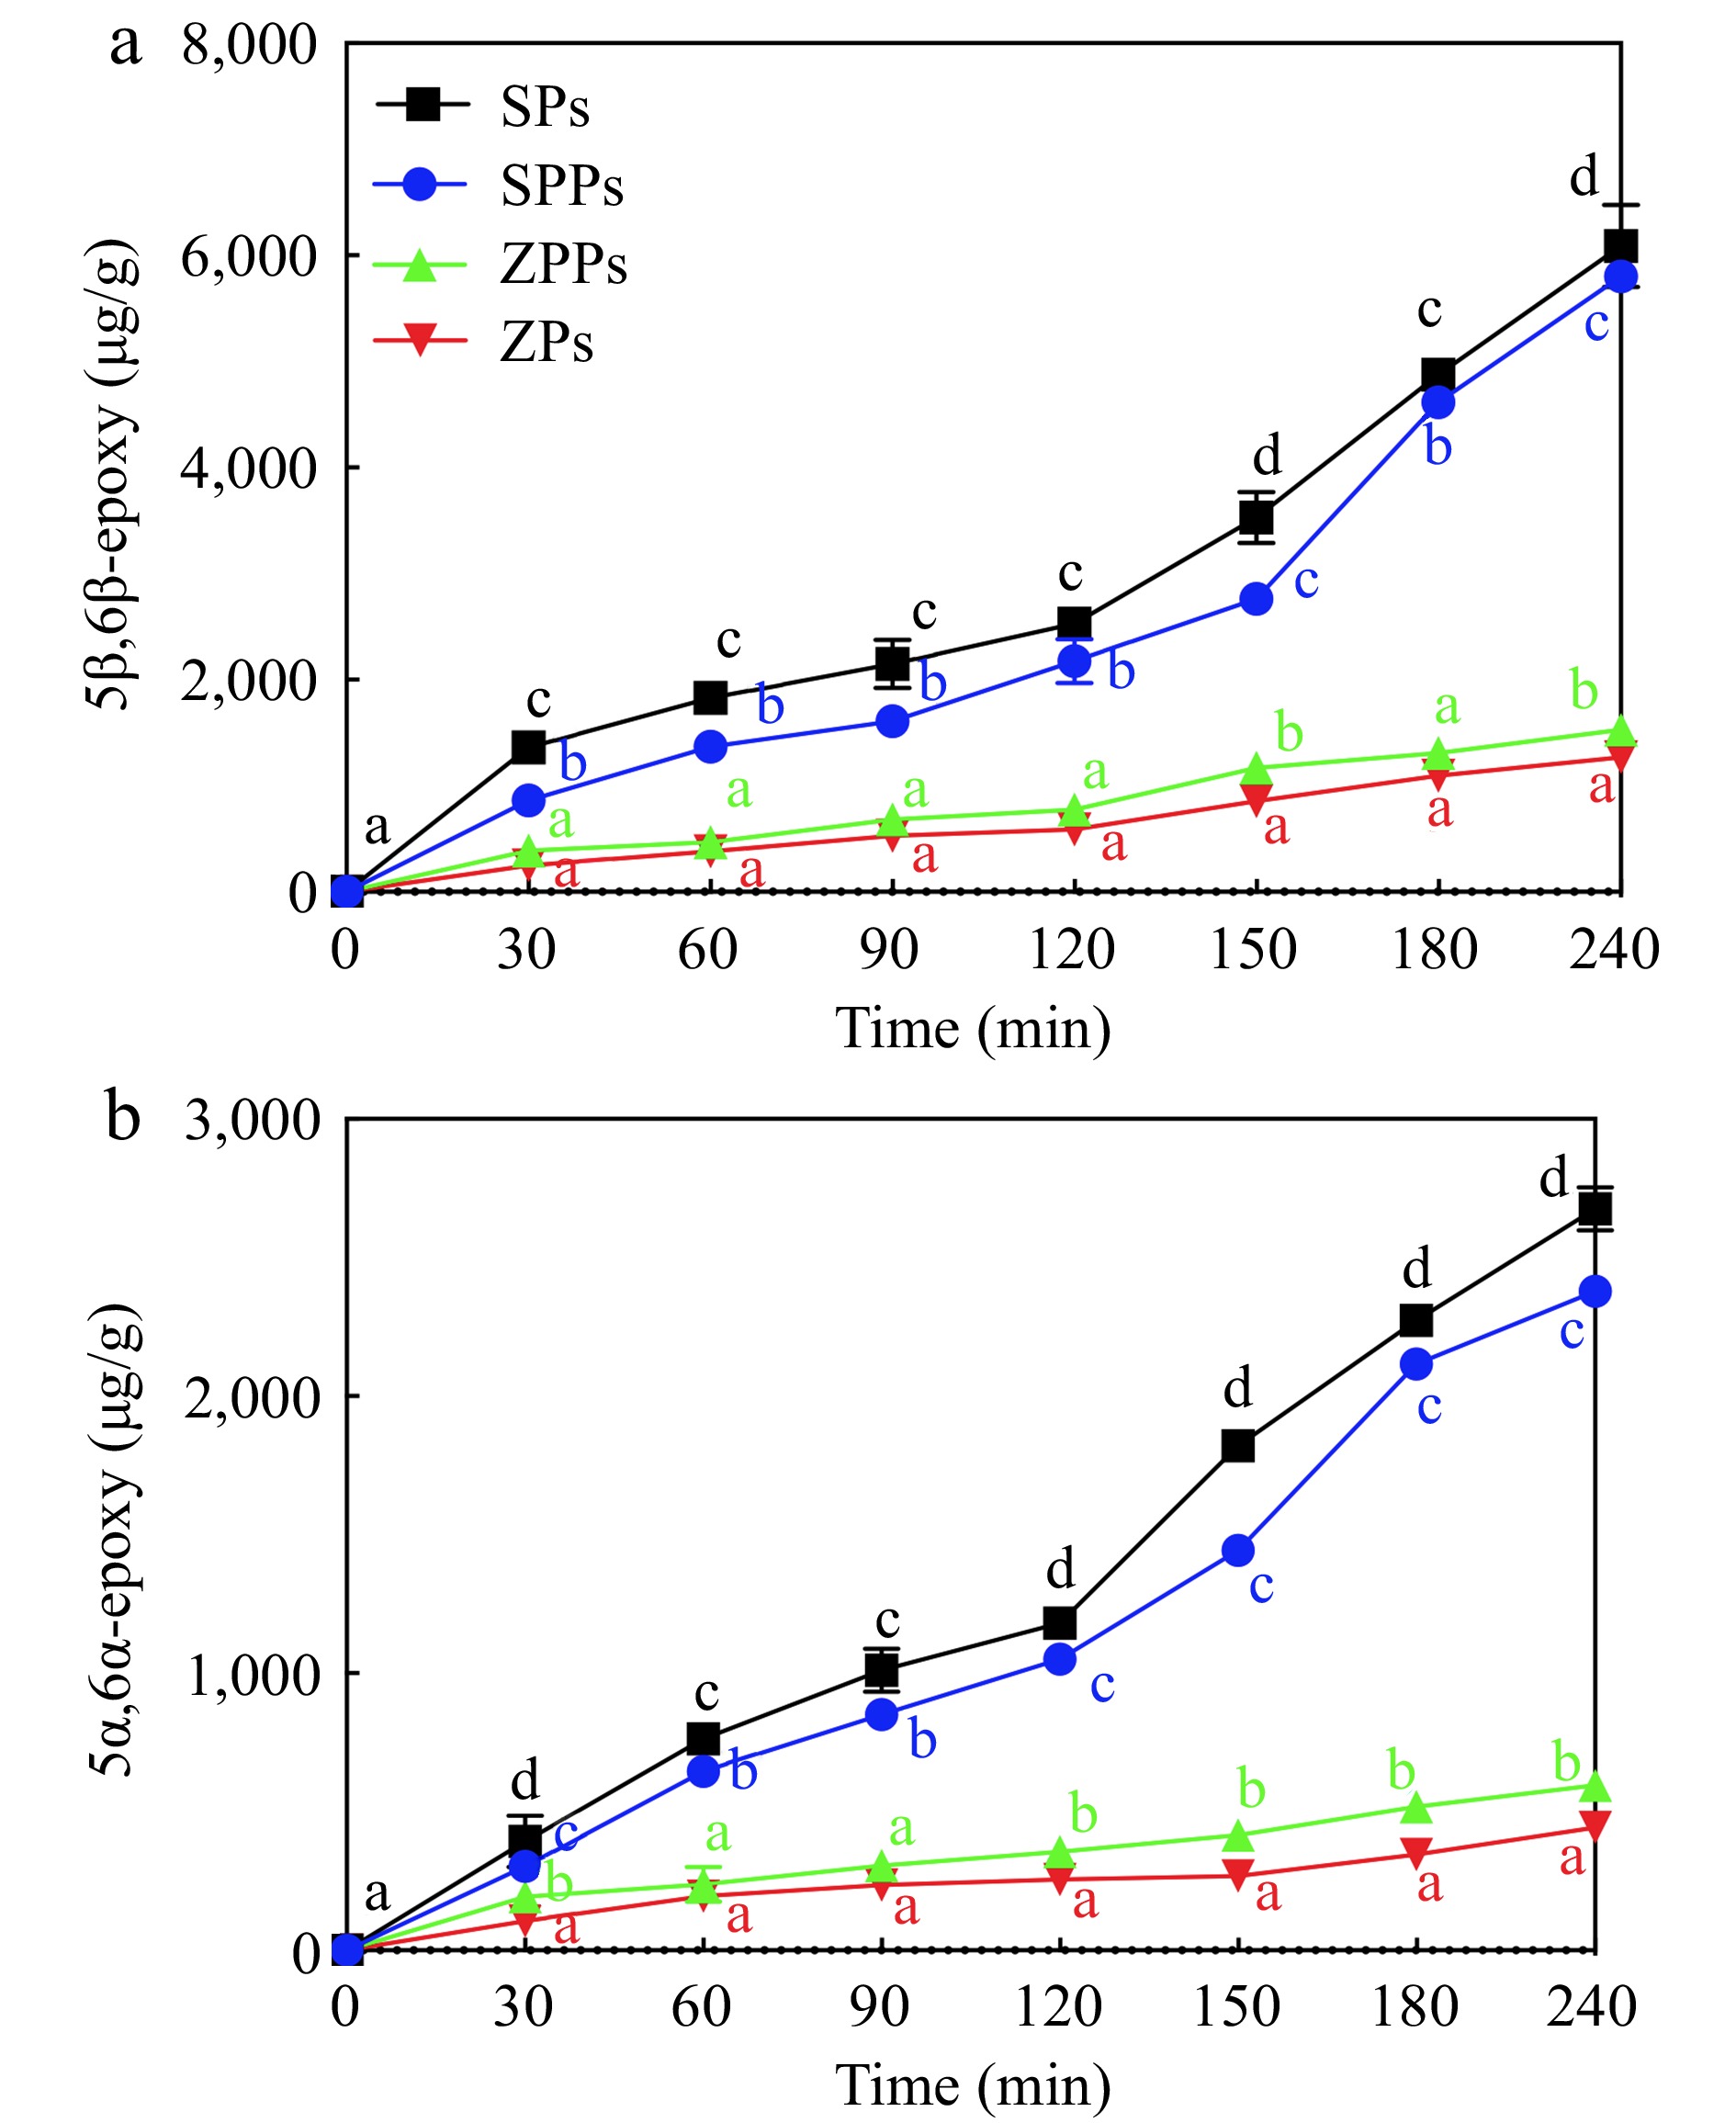
Figure 6.
POPs content derived from (a) 5α,6α-epoxy and (b) 5β,6β-epoxy in particles under UV light exposure.
Figures
(6)
Tables
(0)