-
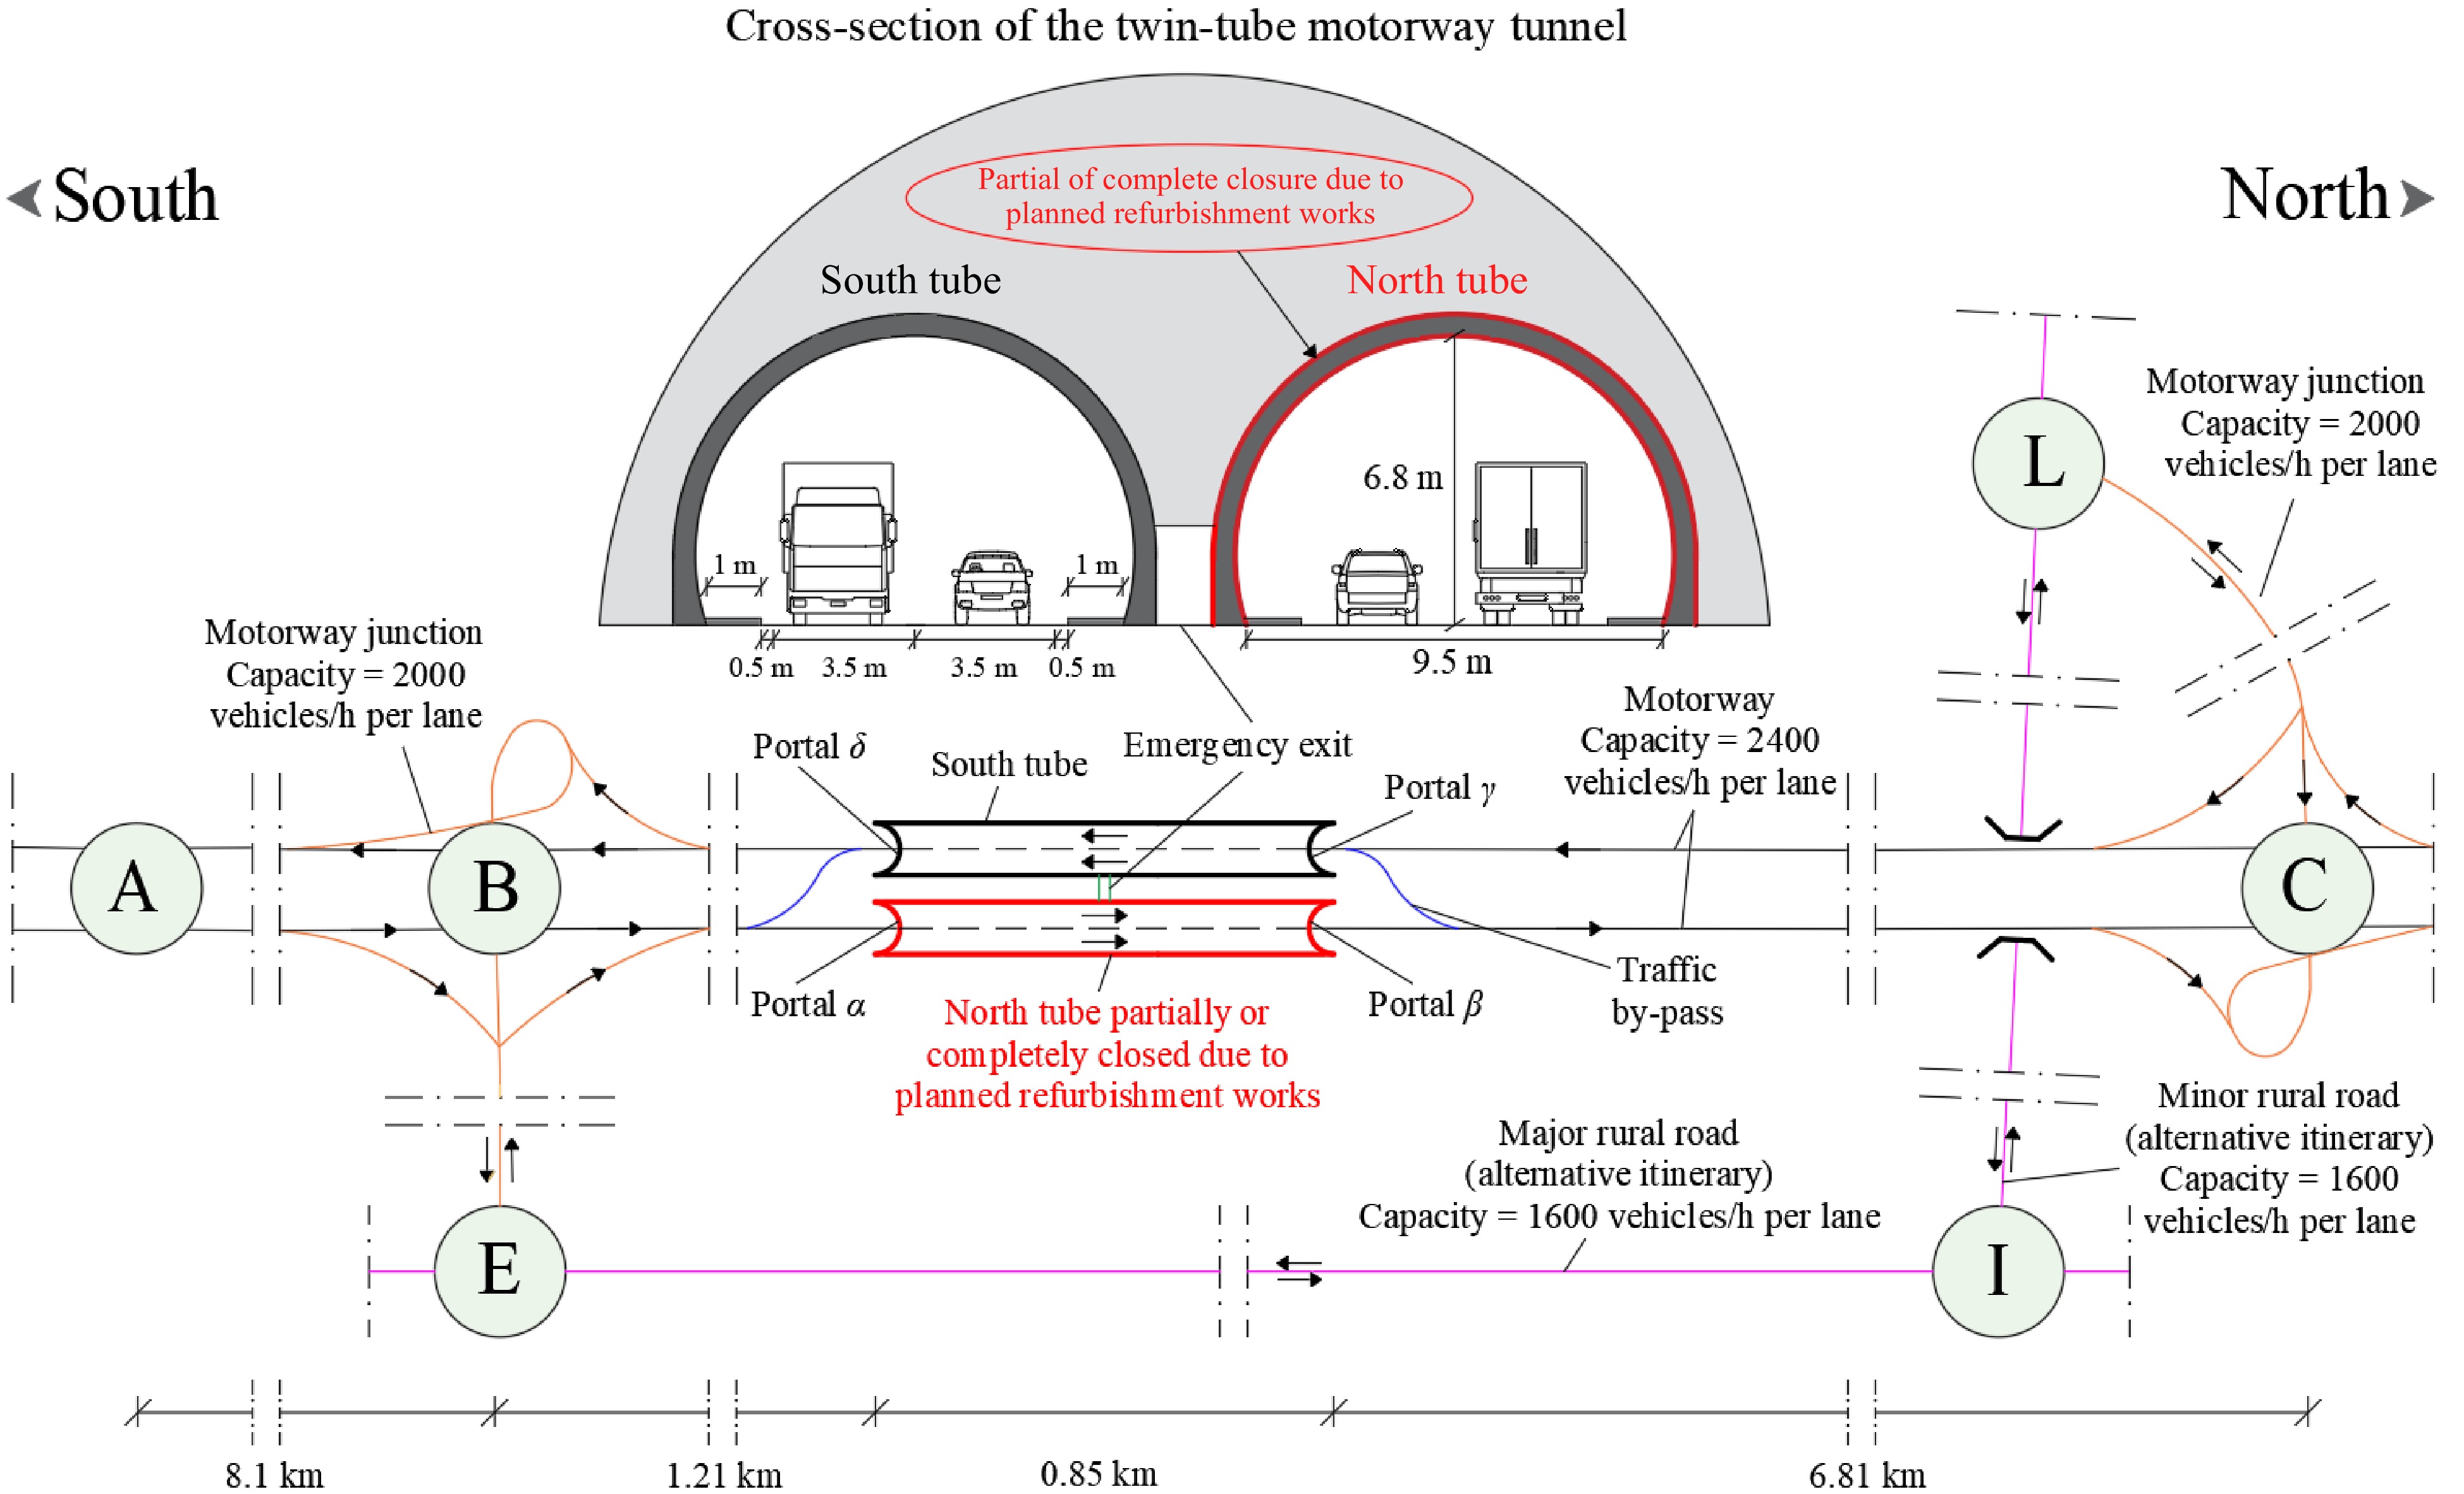
Figure 1.
Graphical depiction of the road network representing the study area and the cross-section of the twin-tube motorway tunnel investigated in this study.
-
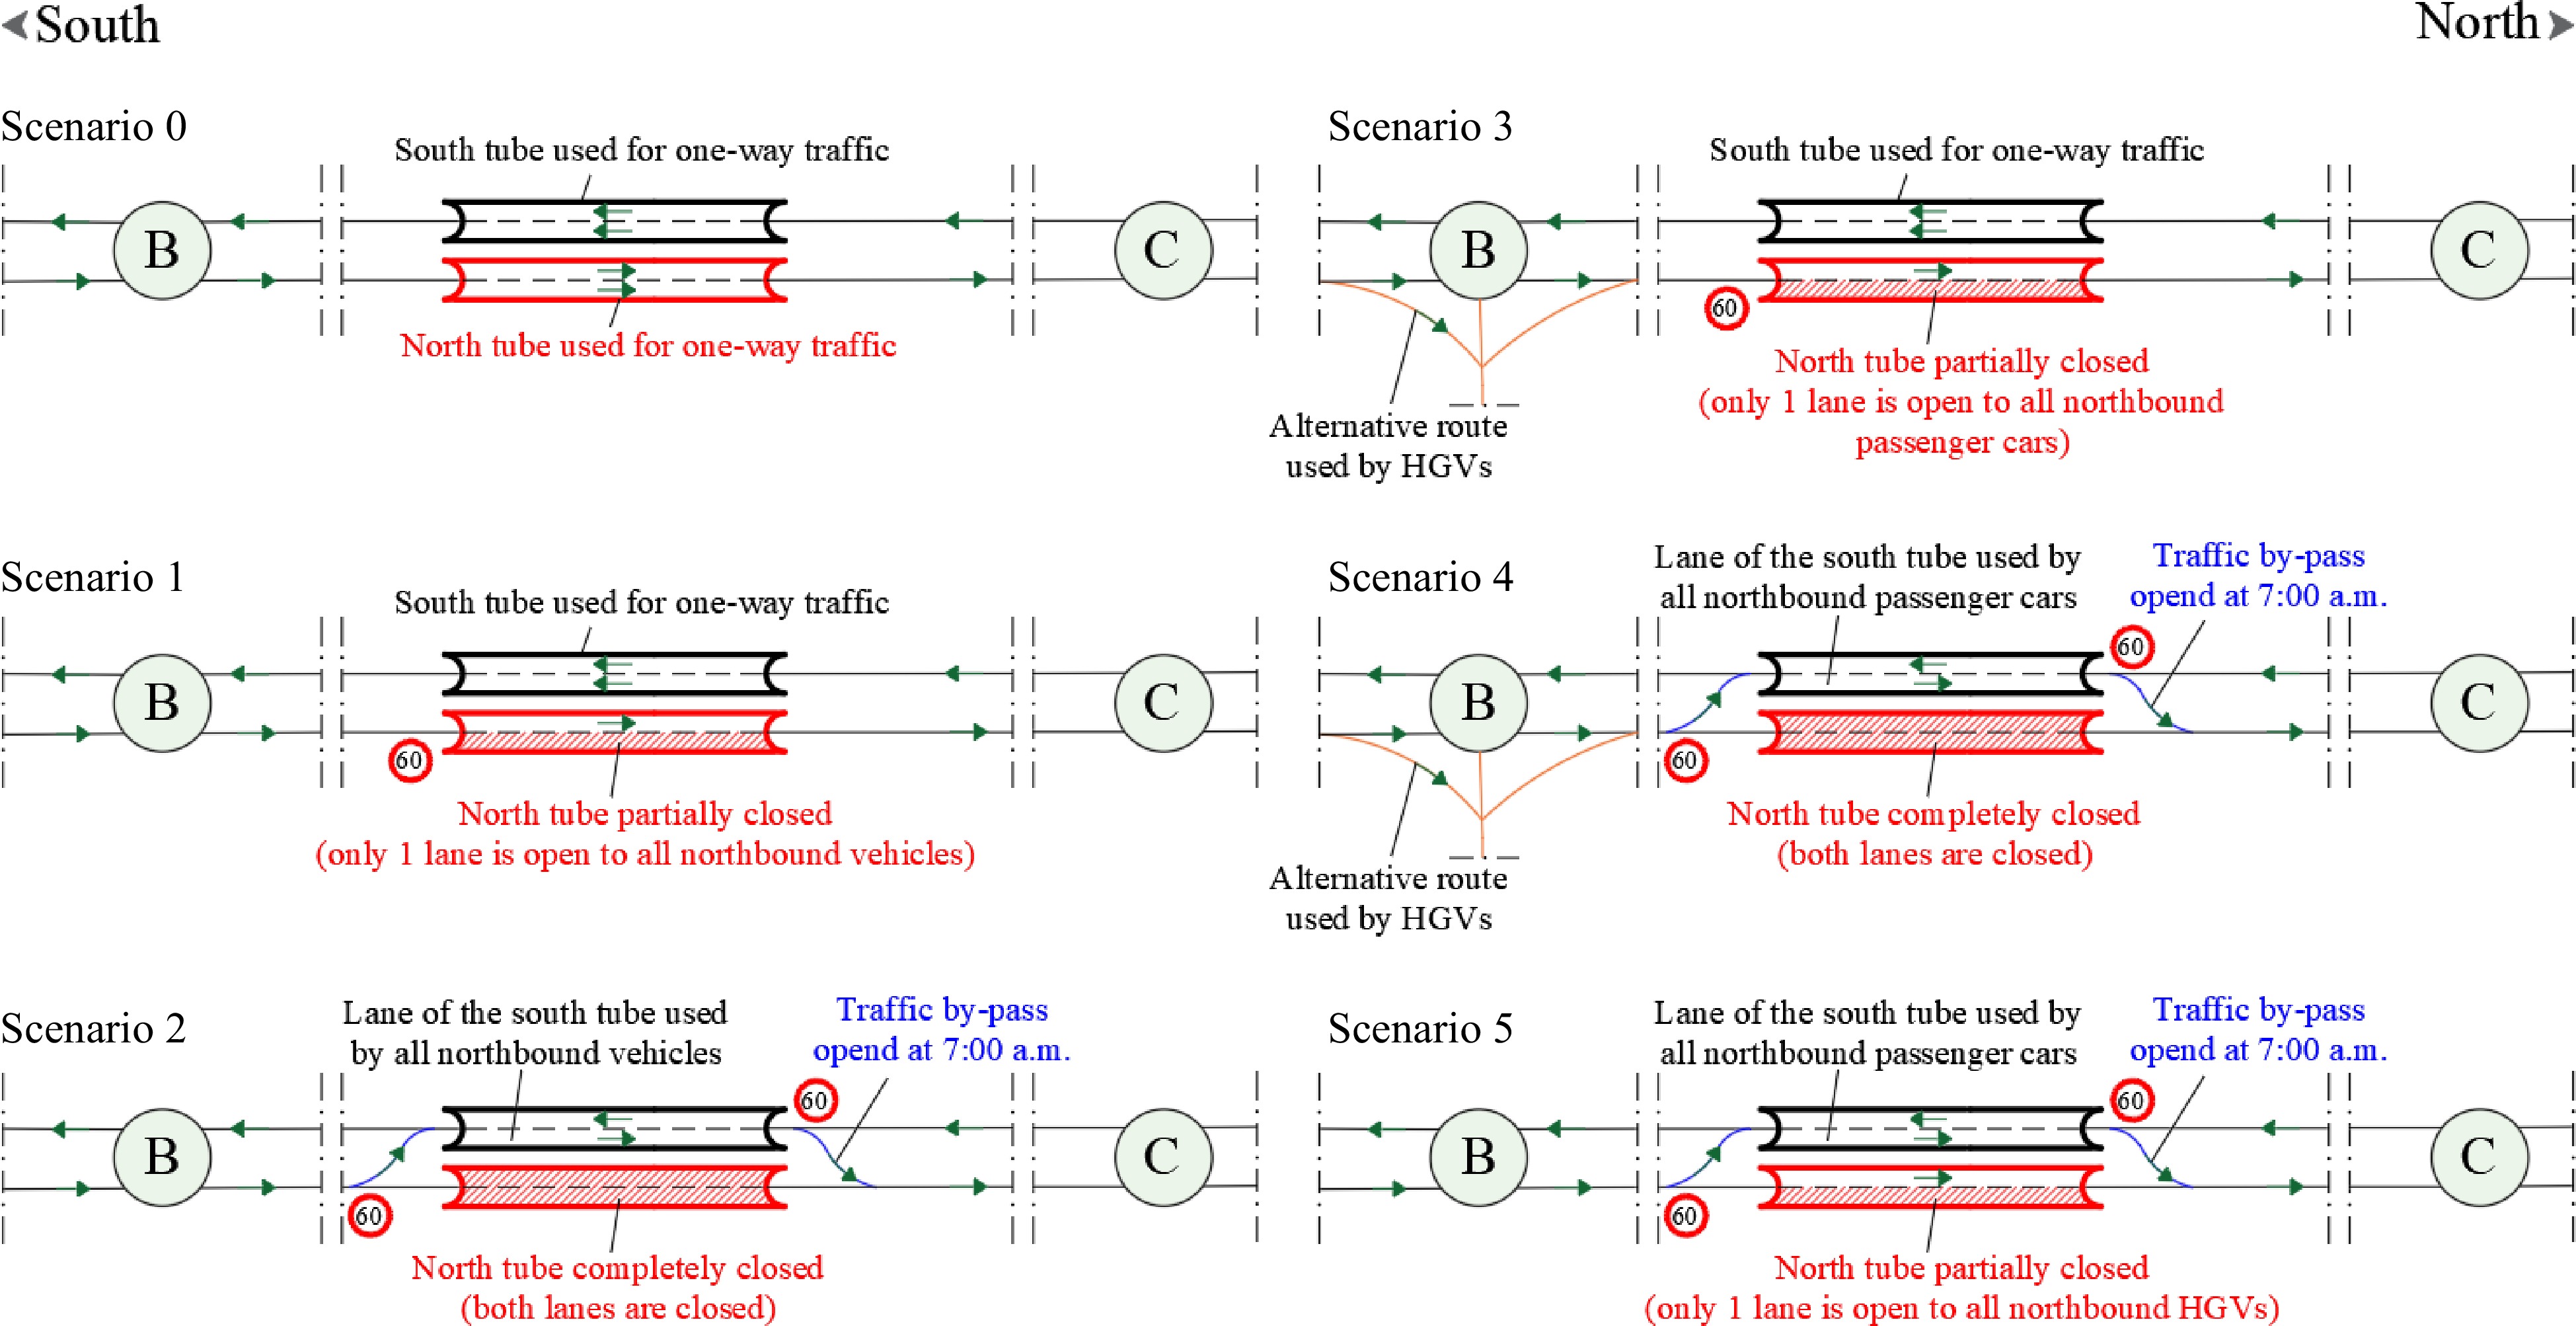
Figure 2.
Graphical description of the scenarios investigated. Scenario 0 in which the north tube is not yet under refurbishment works. Scenario 1 involves the partial closure of the north tube. Scenario 2 includes the complete closure of the north tube and the use of the south tube for two-way traffic. Scenario 3 differs from the corresponding Scenario 1 for the activation of an alternative route along which only HGVs directed towards the north are diverted. Scenario 4 differs from the corresponding Scenario 2 for the re-routing of only northbound HGVs along an alternative itinerary. Scenario 5 involves the partial closure of the north tube with its remaining undisrupted lane used only by HGVs directed towards the north, while northbound passenger cars use the south tube affected by bi-directional traffic.
-
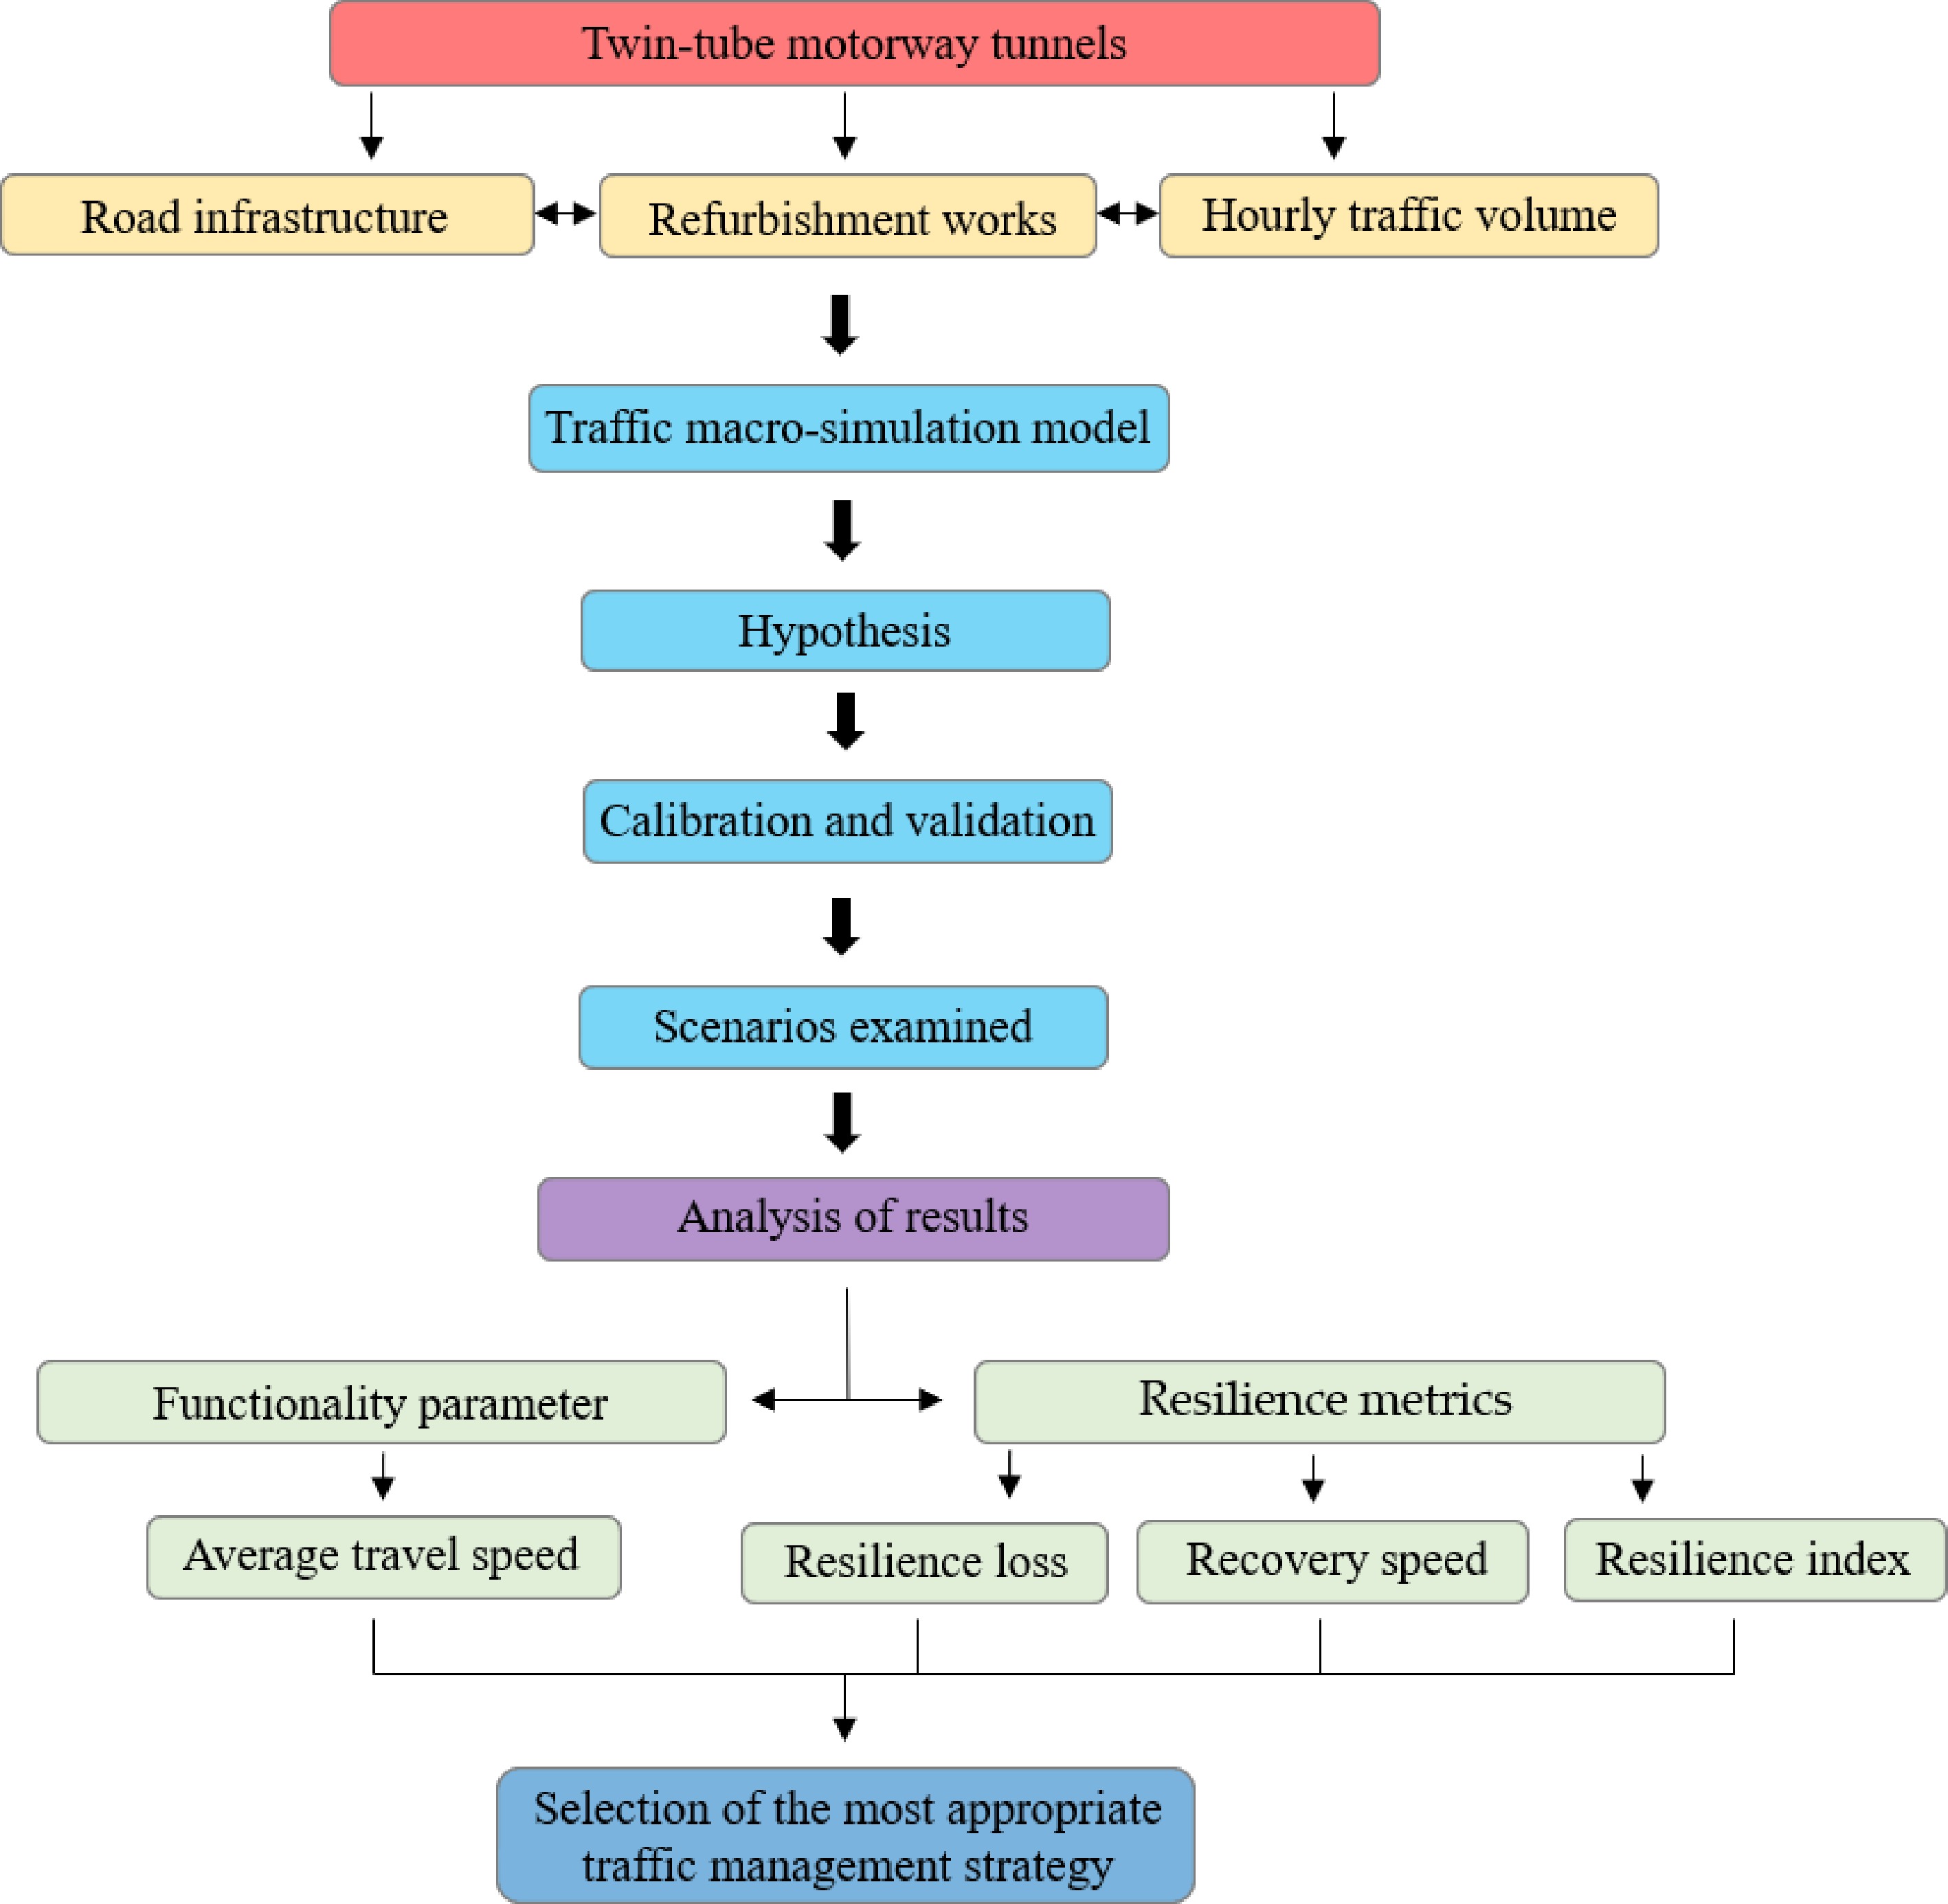
Figure 3.
Flow chart of the methodology.
-
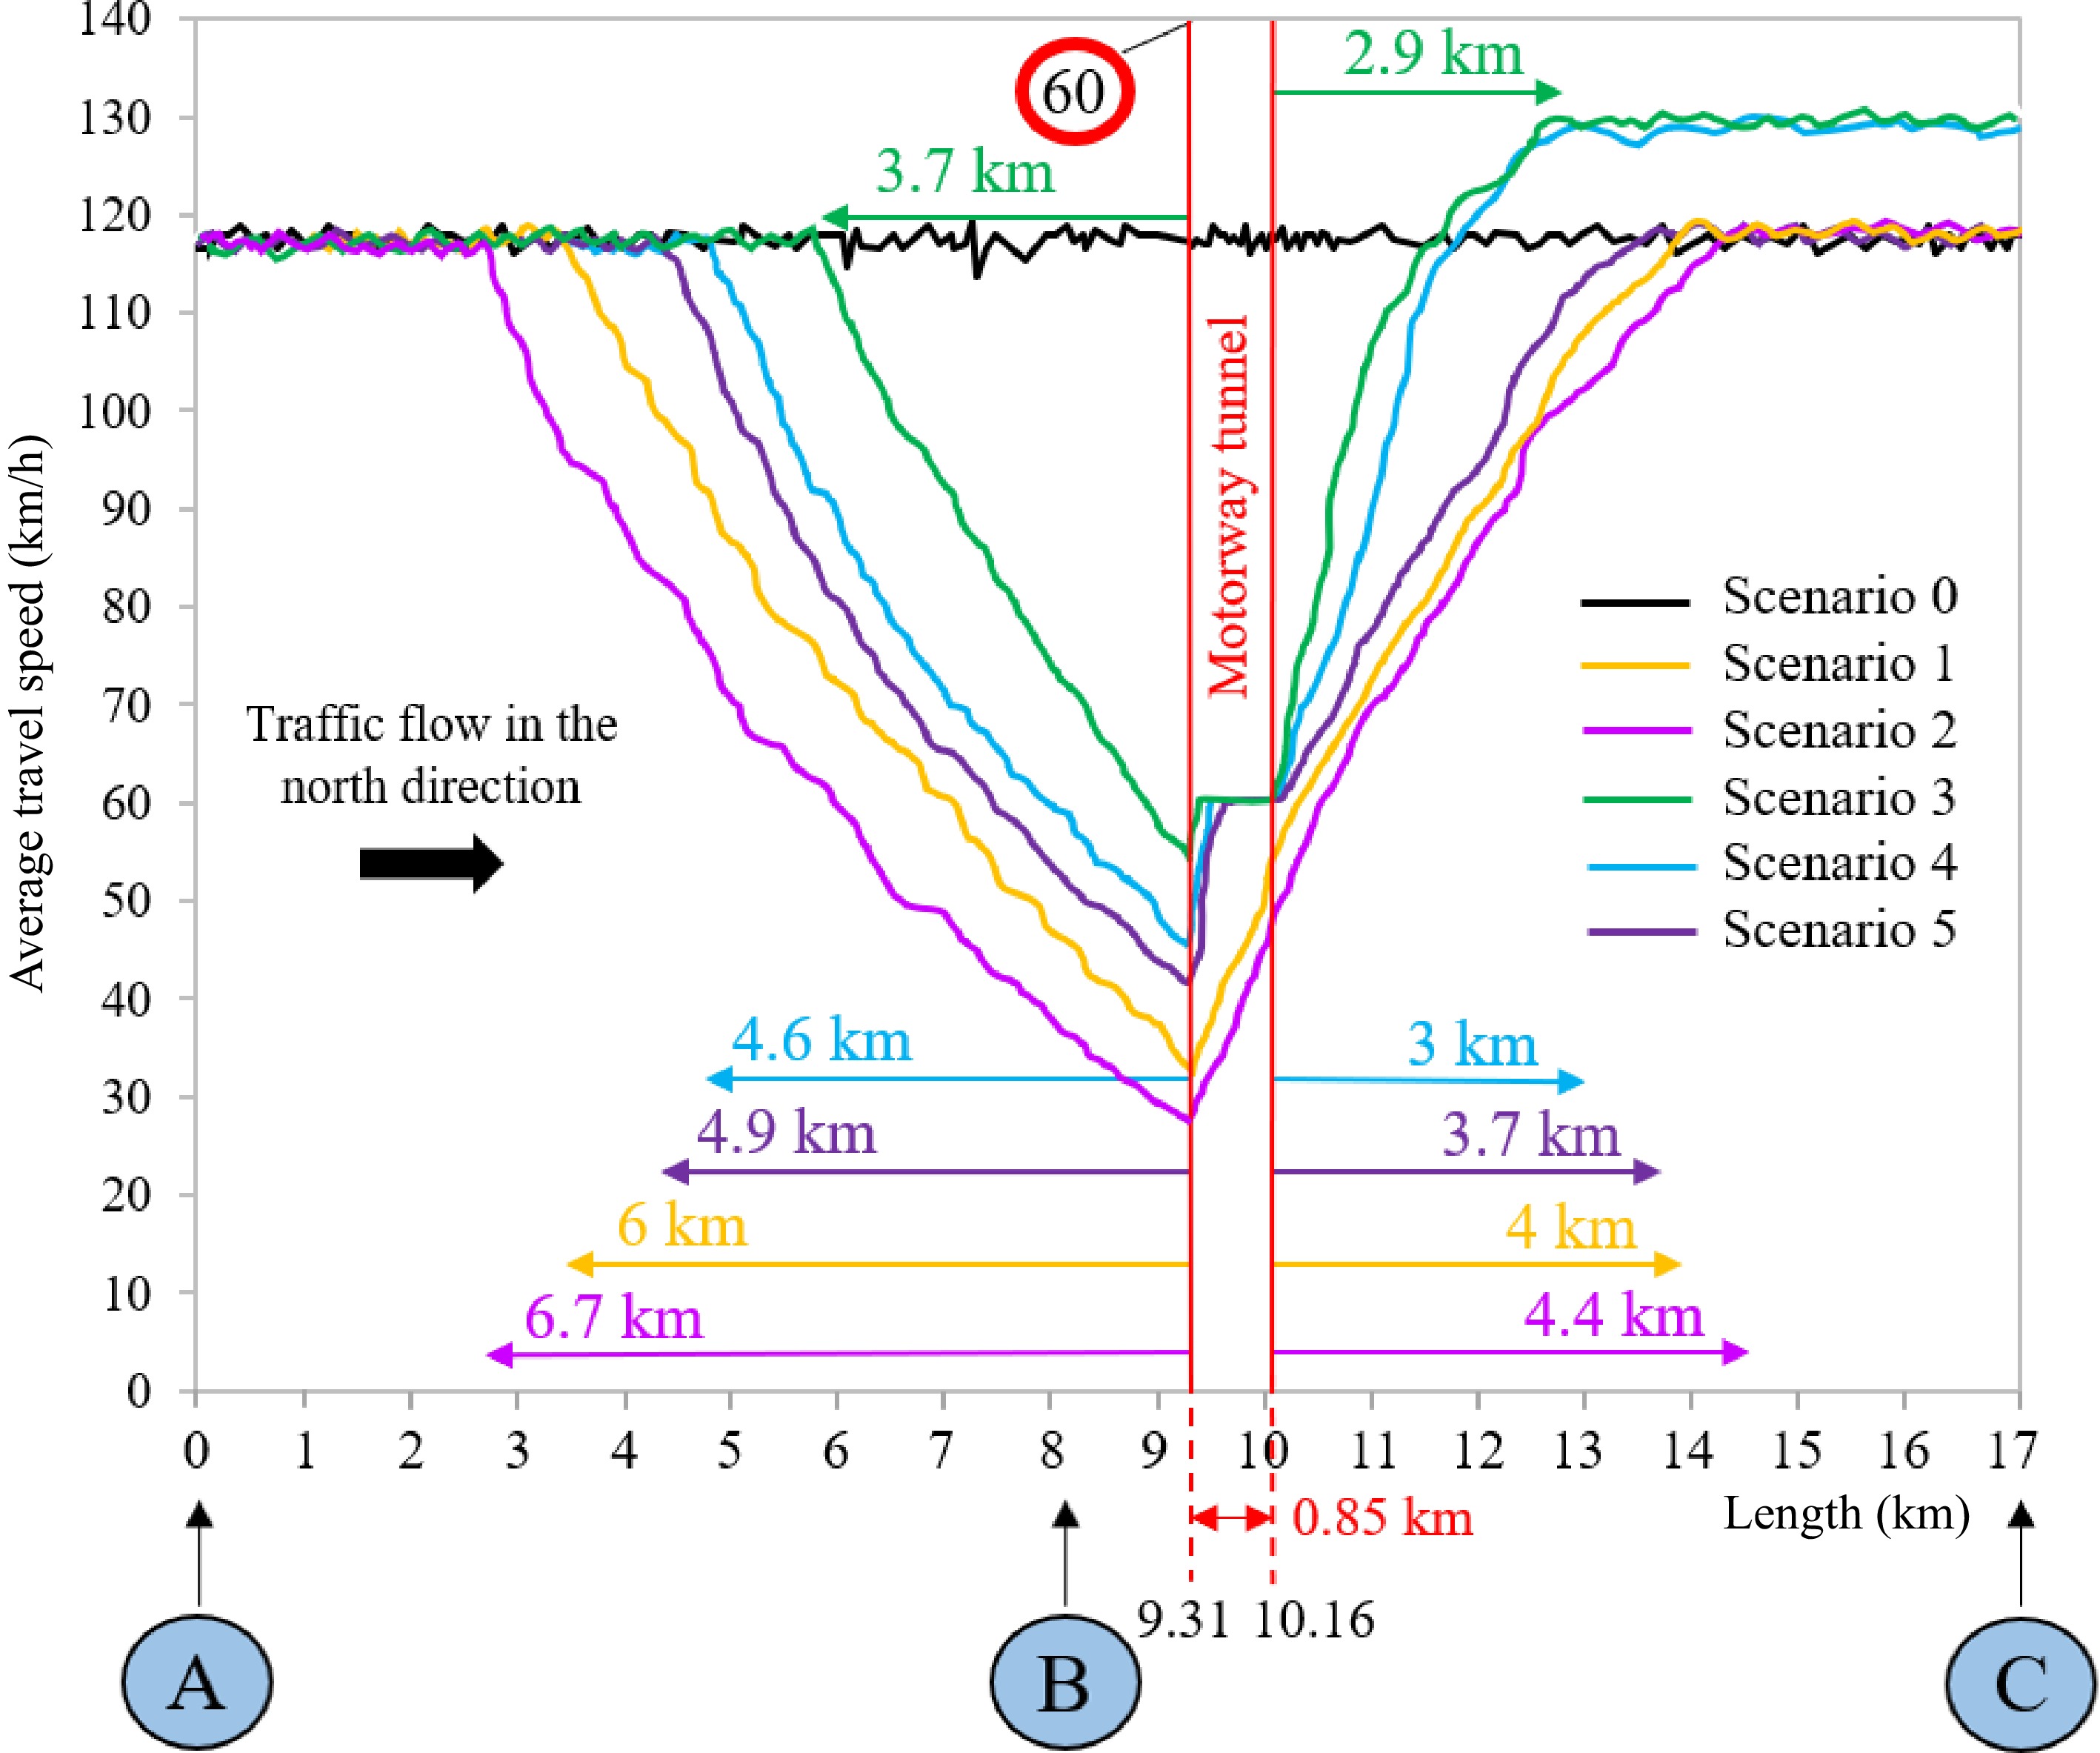
Figure 4.
Longitudinal spatial distributions of the average travel speed of traffic flow along the motorway in the north direction (i.e., from the Nodes A to C) for the analysis period of 6 h. Scenario 0 in which the north tube is not yet under refurbishment works. Scenario 1 involves the partial closure of the north tube. Scenario 2 includes the complete closure of the north tube and the use of the south tube for two-way traffic. Scenario 3 differs from the corresponding Scenario 1 for the activation of an alternative route along which only HGVs directed towards the north are diverted. Scenario 4 differs from the corresponding Scenario 2 for the re-routing of only northbound HGVs along an alternative itinerary. Scenario 5 involves the partial closure of the north tube with its remaining undisrupted lane used only by HGVs directed towards the north, while northbound passenger cars use the south tube affected by bi-directional traffic.
-
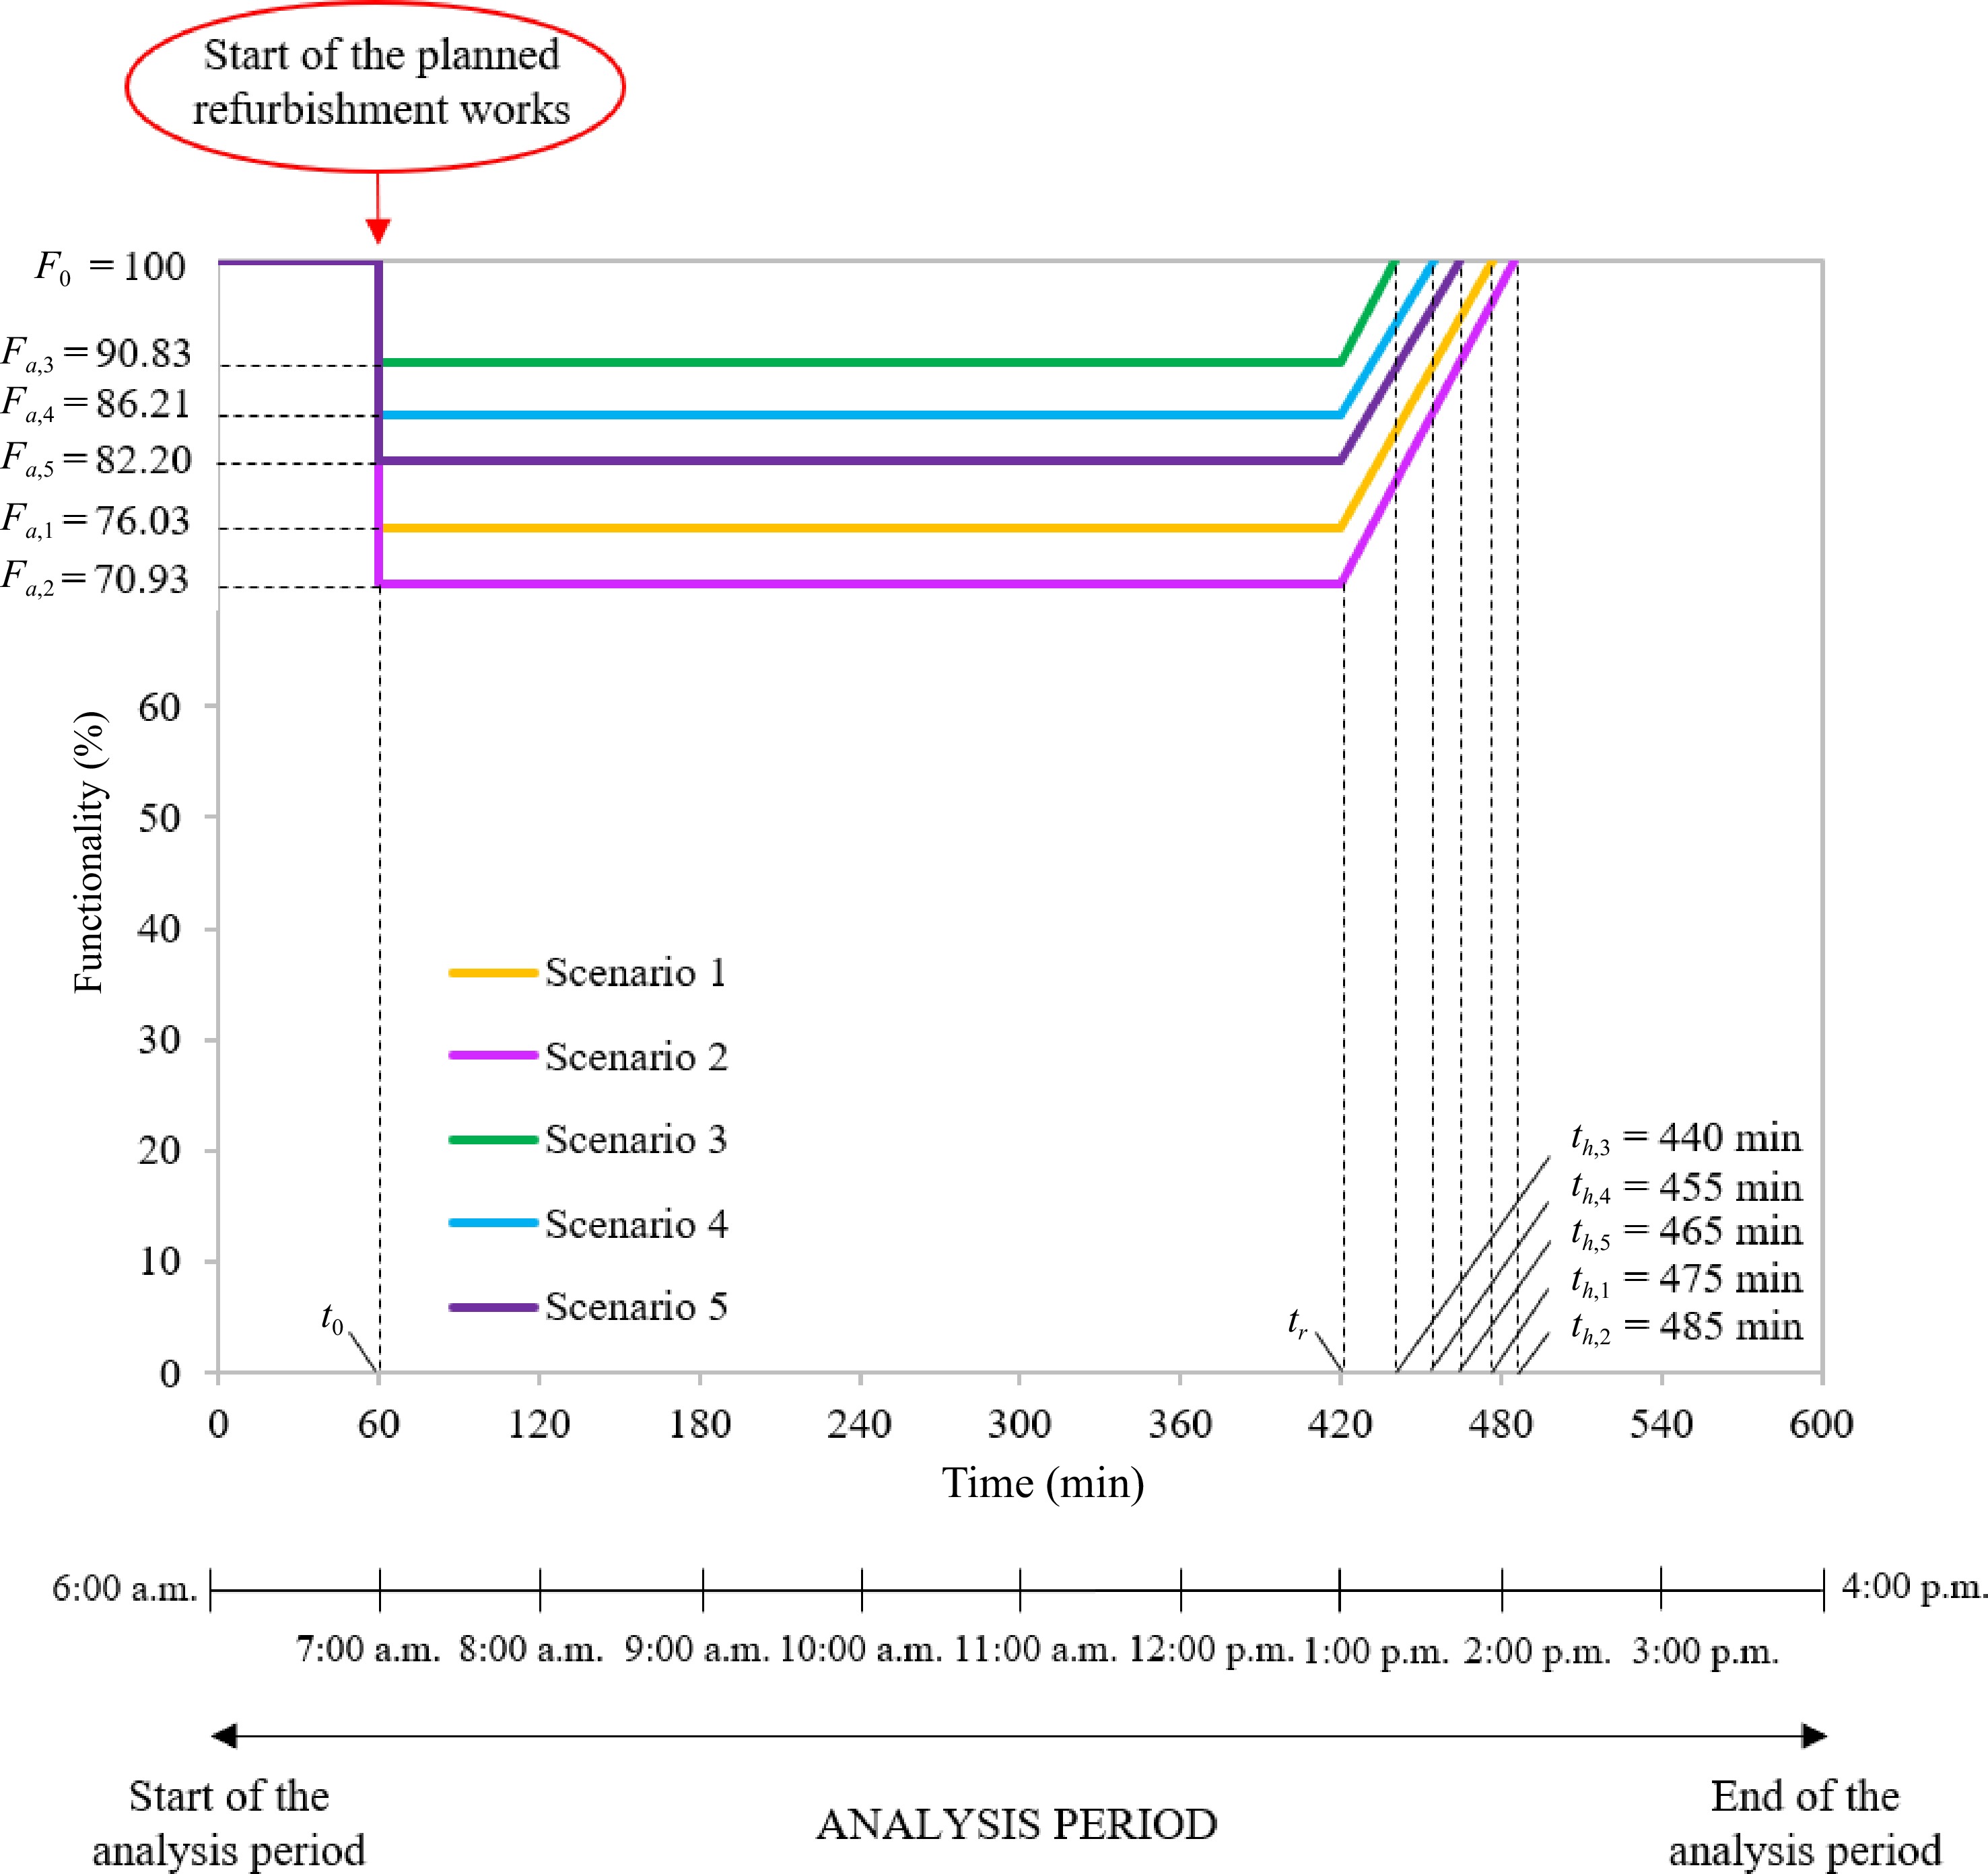
Figure 5.
Functionality curve over time of the tunnel system under each scenario investigated. Scenario 1 involves the partial closure of the north tube. Scenario 2 includes the complete closure of the north tube and the use of the south tube for two-way traffic. Scenario 3 differs from the corresponding Scenario 1 for the activation of an alternative route along which only HGVs directed towards the north are diverted. Scenario 4 differs from the corresponding Scenario 2 for the re-routing of only northbound HGVs along an alternative itinerary. Scenario 5 involves the partial closure of the north tube with its remaining undisrupted lane used only by HGVs directed towards the north, while northbound passenger cars use the south tube affected by bi-directional traffic.
-
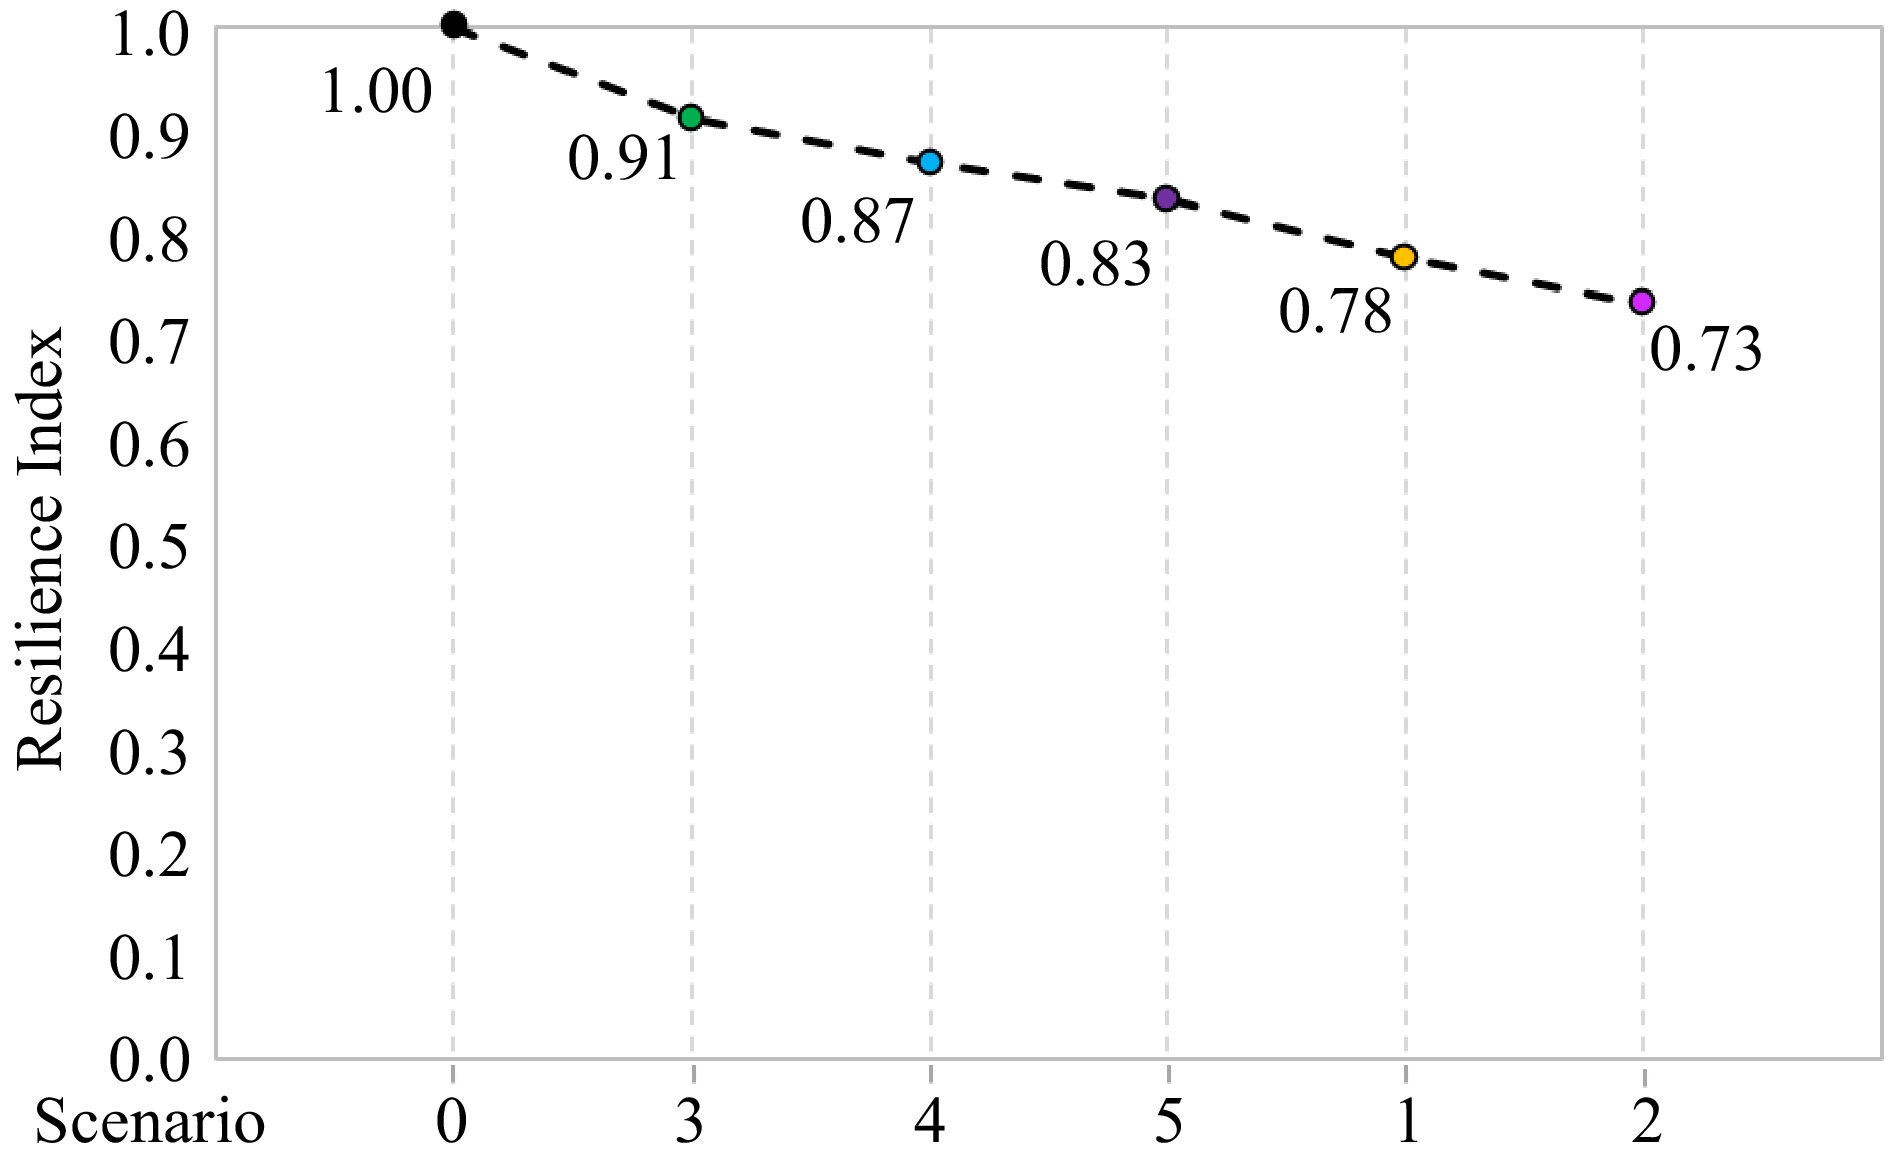
Figure 6.
Resilience index of the tunnel system under each scenario investigated. Scenario 0 in which the north tube is not yet under refurbishment work. Scenario 1 involves the partial closure of the north tube. Scenario 2 includes the complete closure of the north tube and the use of the south tube for two-way traffic. Scenario 3 differs from the corresponding Scenario 1 for the activation of an alternative route along which only HGVs directed towards the north are diverted. Scenario 4 differs from the corresponding Scenario 2 for the re-routing of only northbound HGVs along an alternative itinerary. Scenario 5 involves the partial closure of the north tube with its remaining undisrupted lane used only by HGVs directed towards the north, while northbound passenger cars use the south tube affected by bi-directional traffic.
-
Year Author (s) Disruptive
eventIs resilience investigated? Scope 2011 Frangopol and Bocchini[6] Random YES To use the concept of resilience as an optimization criterion for the rehabilitation of a transportation network subject to an earthquake. 2012 Huerne et al.[7] Planned NO To set up a theoretical framework that can define the relationships between road maintenance characteristics and costs, traffic effects, and traffic hindrance for road works. 2017 Kaviani et al.[8] Random YES To develop a new approach to improve the resilience of regional road networks during the recovery period following a natural disaster. 2017 Sudarsana & Sanjaya[9] Planned NO To evaluate the increase in the travel time of vehicles during the execution of a road maintenance project. 2017 Yang et al.[10] Planned NO To present a road maintenance planning model that can be used to balance out maintenance cost and road user cost. 2018 Liao et al.[11] Random YES To propose a resilience optimization model for transportation networks under unpredictable disasters. 2018 Amini et al.[12] Random YES To evaluate the impacts of diverting traffic in real-time on the resilience of a road network affected by the closure of a link caused by an incidental event. 2019 Kilanitis & Sextos[13] Random YES To extend an existing framework to evaluate the seismic risk and resilience of road networks in earthquake-prone areas. 2020 Yang et al.[14] Planned NO To assess the additional delays along the network due to road maintenance by using the network-level traffic flow model. 2021 Sun et al.[5] Planned NO To propose a stochastic bi-objective integer programming model for minimizing the total cost and CO2 emissions of tunnel maintenance over the entire planning horizon. 2021 Shrestha et al.[15] Random or Planned NO To set up a new methodology for assessing the performance of rural road networks when a link in the network is disrupted due to random or planned disruptive events. 2021 Borghetti et al.[16] Random YES To study the impacts of emergency teams equipped with a micronized water system on the resilience of a road tunnel in the event of a fire. 2021 Zhao[17] Random YES To propose a genetic algorithm to identify the best strategy for recovering the resilience of a road network after a disaster. 2022 Torti et al.[18] Planned NO To introduce a methodology for assessing the socio-economic effects of closure for maintenance of one or more infrastructures of a large and complex road network. 2022 Caliendo et al.[19] Random YES To assess the resilience of a twin-tube road tunnel affected by a traffic accident in a tube and the efficiency of various recovery measures. 2022 Caliendo et al.[20] Random YES To perform a simultaneous analysis of the resilience and user safety of a road tunnel in the case of a fire. 2022 Tao et al.[21] Random YES To analyze the resilience degradation due to traffic accidents and develop relevant resilience optimization strategies. Table 1.
Summary of the literature review.
-
Direction of travel Hourly traffic volumes [vehicles/h per lane] Motorway Major rural road Motorway junctions A→B B→C A←B B←C E⇔I B→E L→C B←E L←C Two peak hours: 7:00 a.m. – 9:00 a.m. 1,099 (275) 1,100 (275) 1,039 (260) 1,038 (260) 776 (19) 499 (100) 571 (114) 504 (101) 550 (110) Four off-peak hours: 9:00 a.m. – 1:00 p.m. 275 (69) 275 (69) 260 (65) 260 (65) 194 (5) 125 (25) 143 (29) 126 (25) 259 (52) Table 2.
Hourly traffic volumes during the two peak hours (i.e., from 7:00 a.m. to 9:00 a.m.) and four off-peak hours (i.e., from 9:00 a.m. to 1:00 p.m.) along the different road sections within the study area. In brackets is the number of heavy vehicles, which includes buses and HGVs, in the total traffic. The arrows indicate the direction of travel.
Figures
(6)
Tables
(2)