-
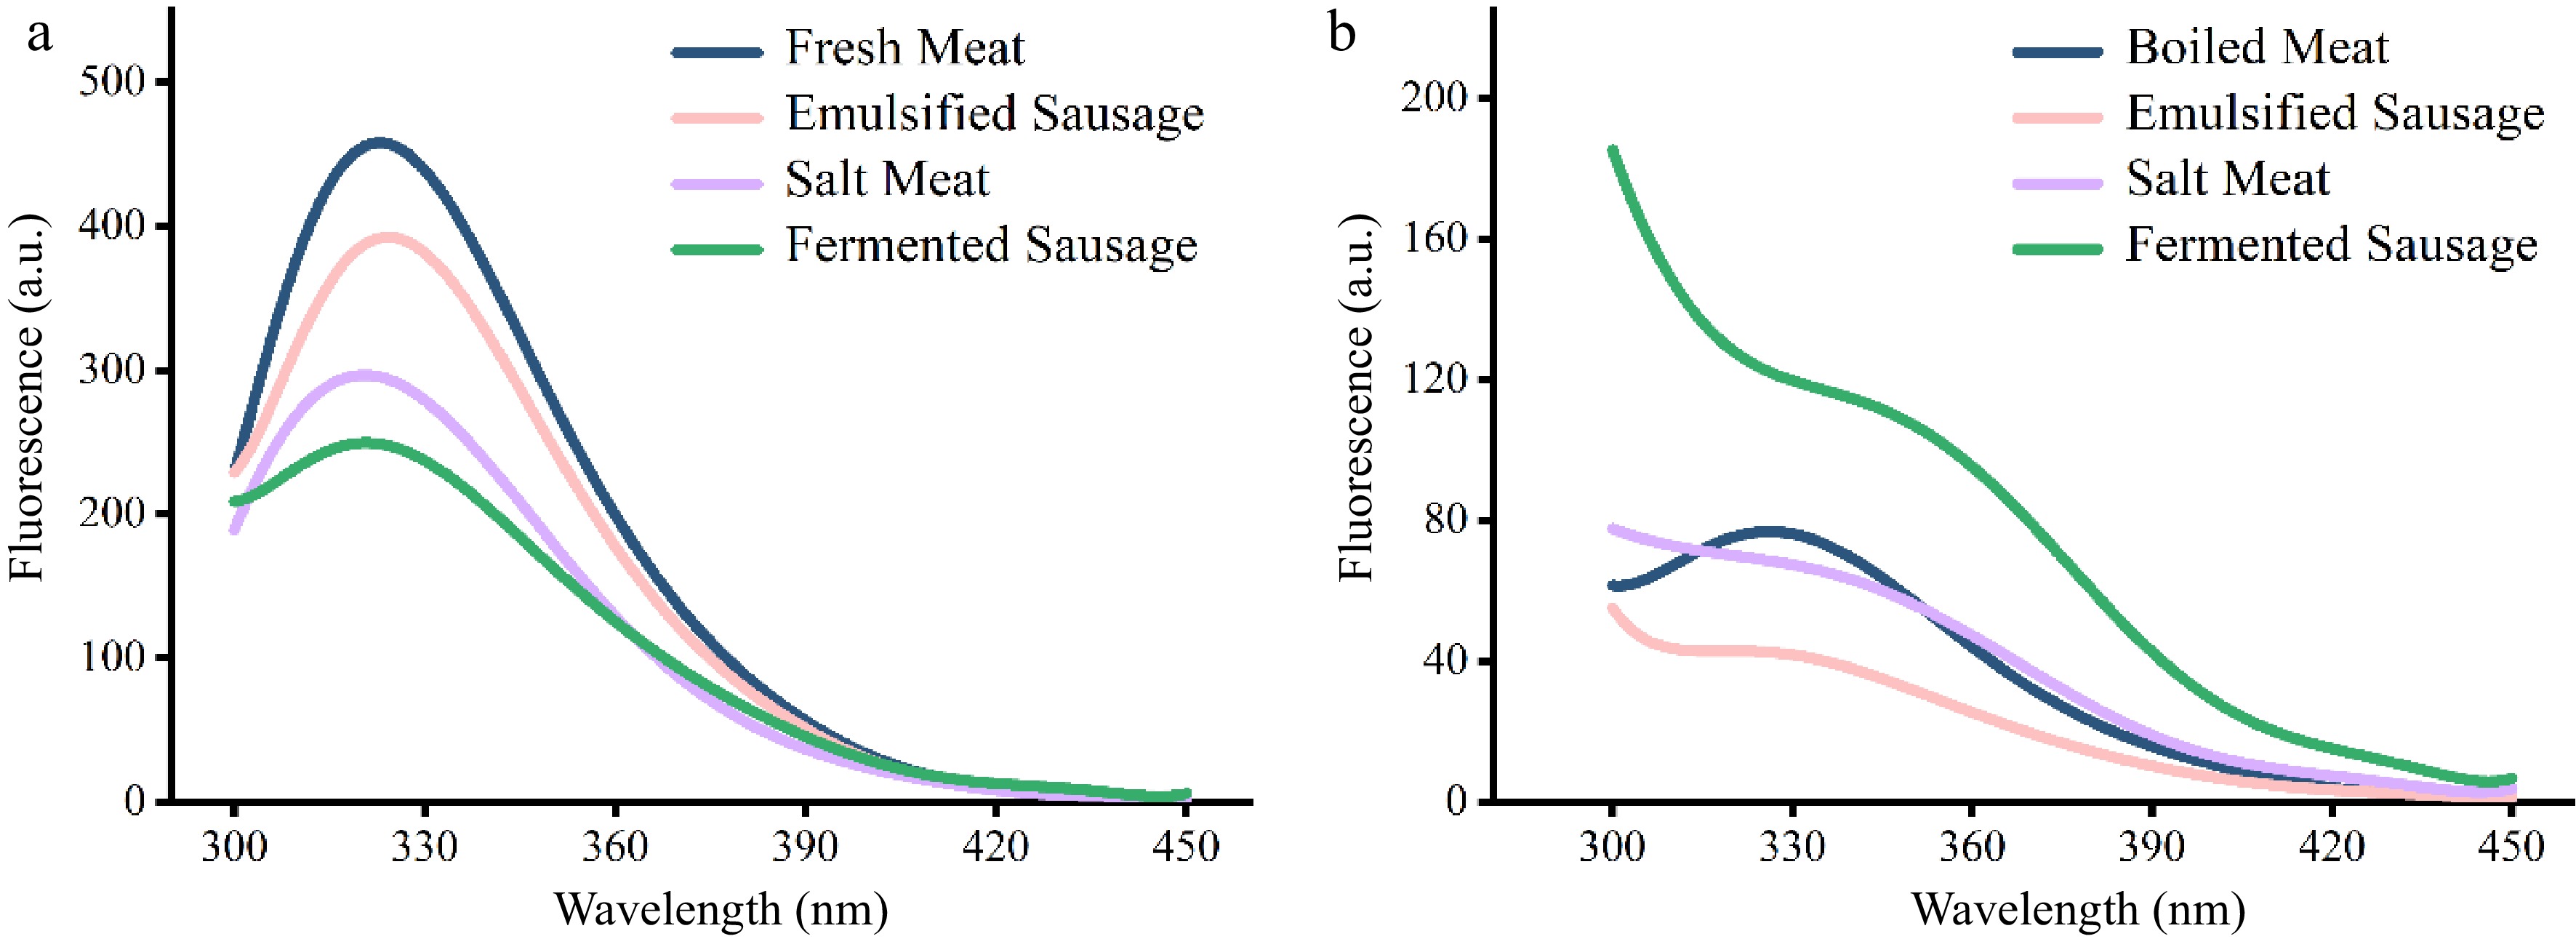
Figure 1.
Fluorescence spectroscopic analysis of proteins in different meat products. (a) Unheated. (b) After heating.
-

Figure 2.
CD spectral analysis of proteins in different meat products. (a) Sarcoplasmic protein. (b) Myofibrillar protein.
-
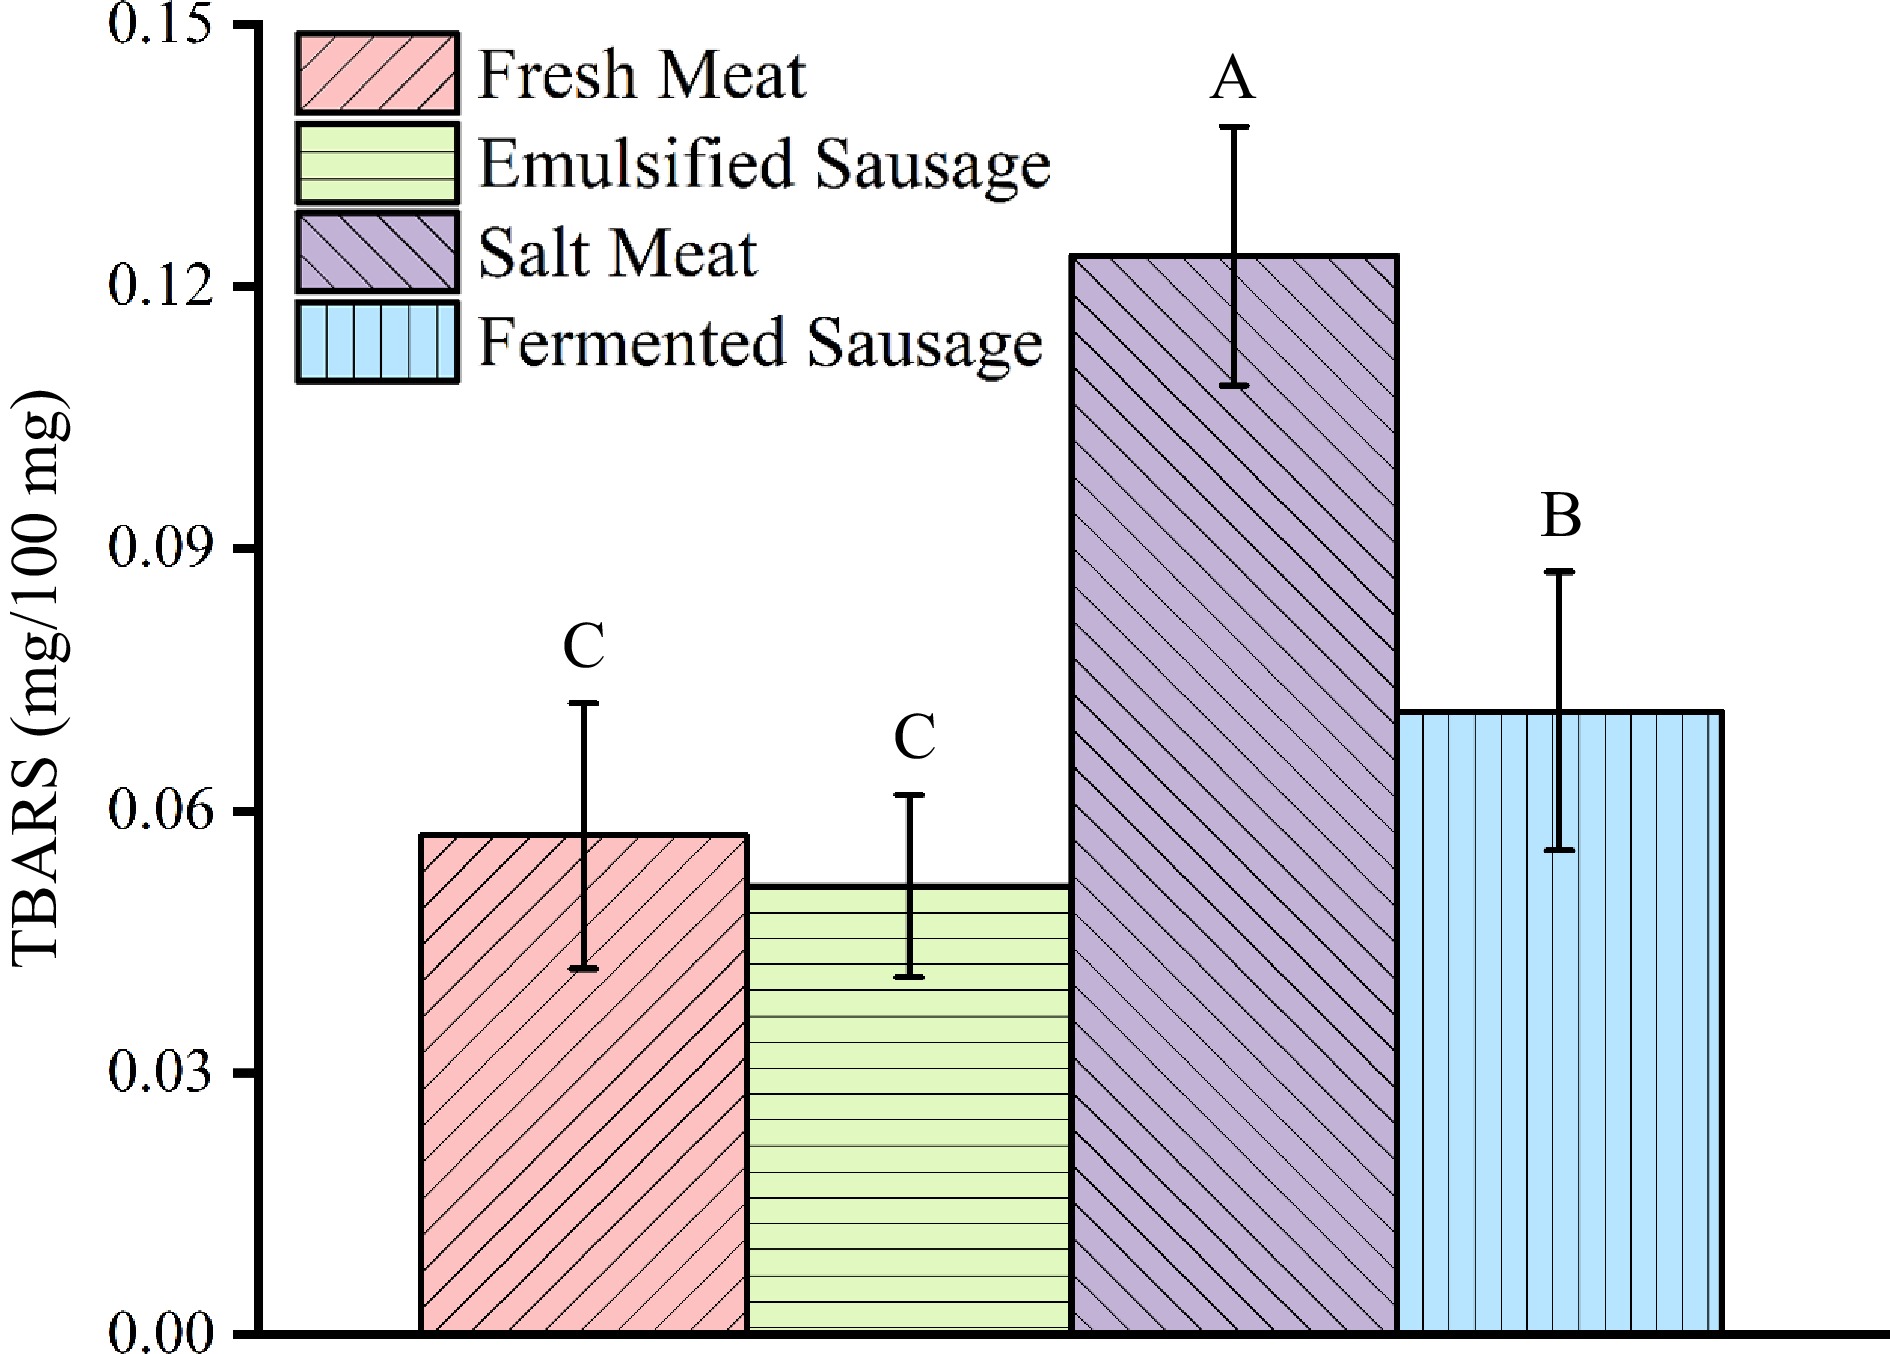
Figure 3.
TBARS content in different meat products.
-

Figure 4.
ζ-potential of four meat products during simulated digestion. (a) ζ-potential of the stomach phase. (b) ζ-potential of the small intestine phase.
-
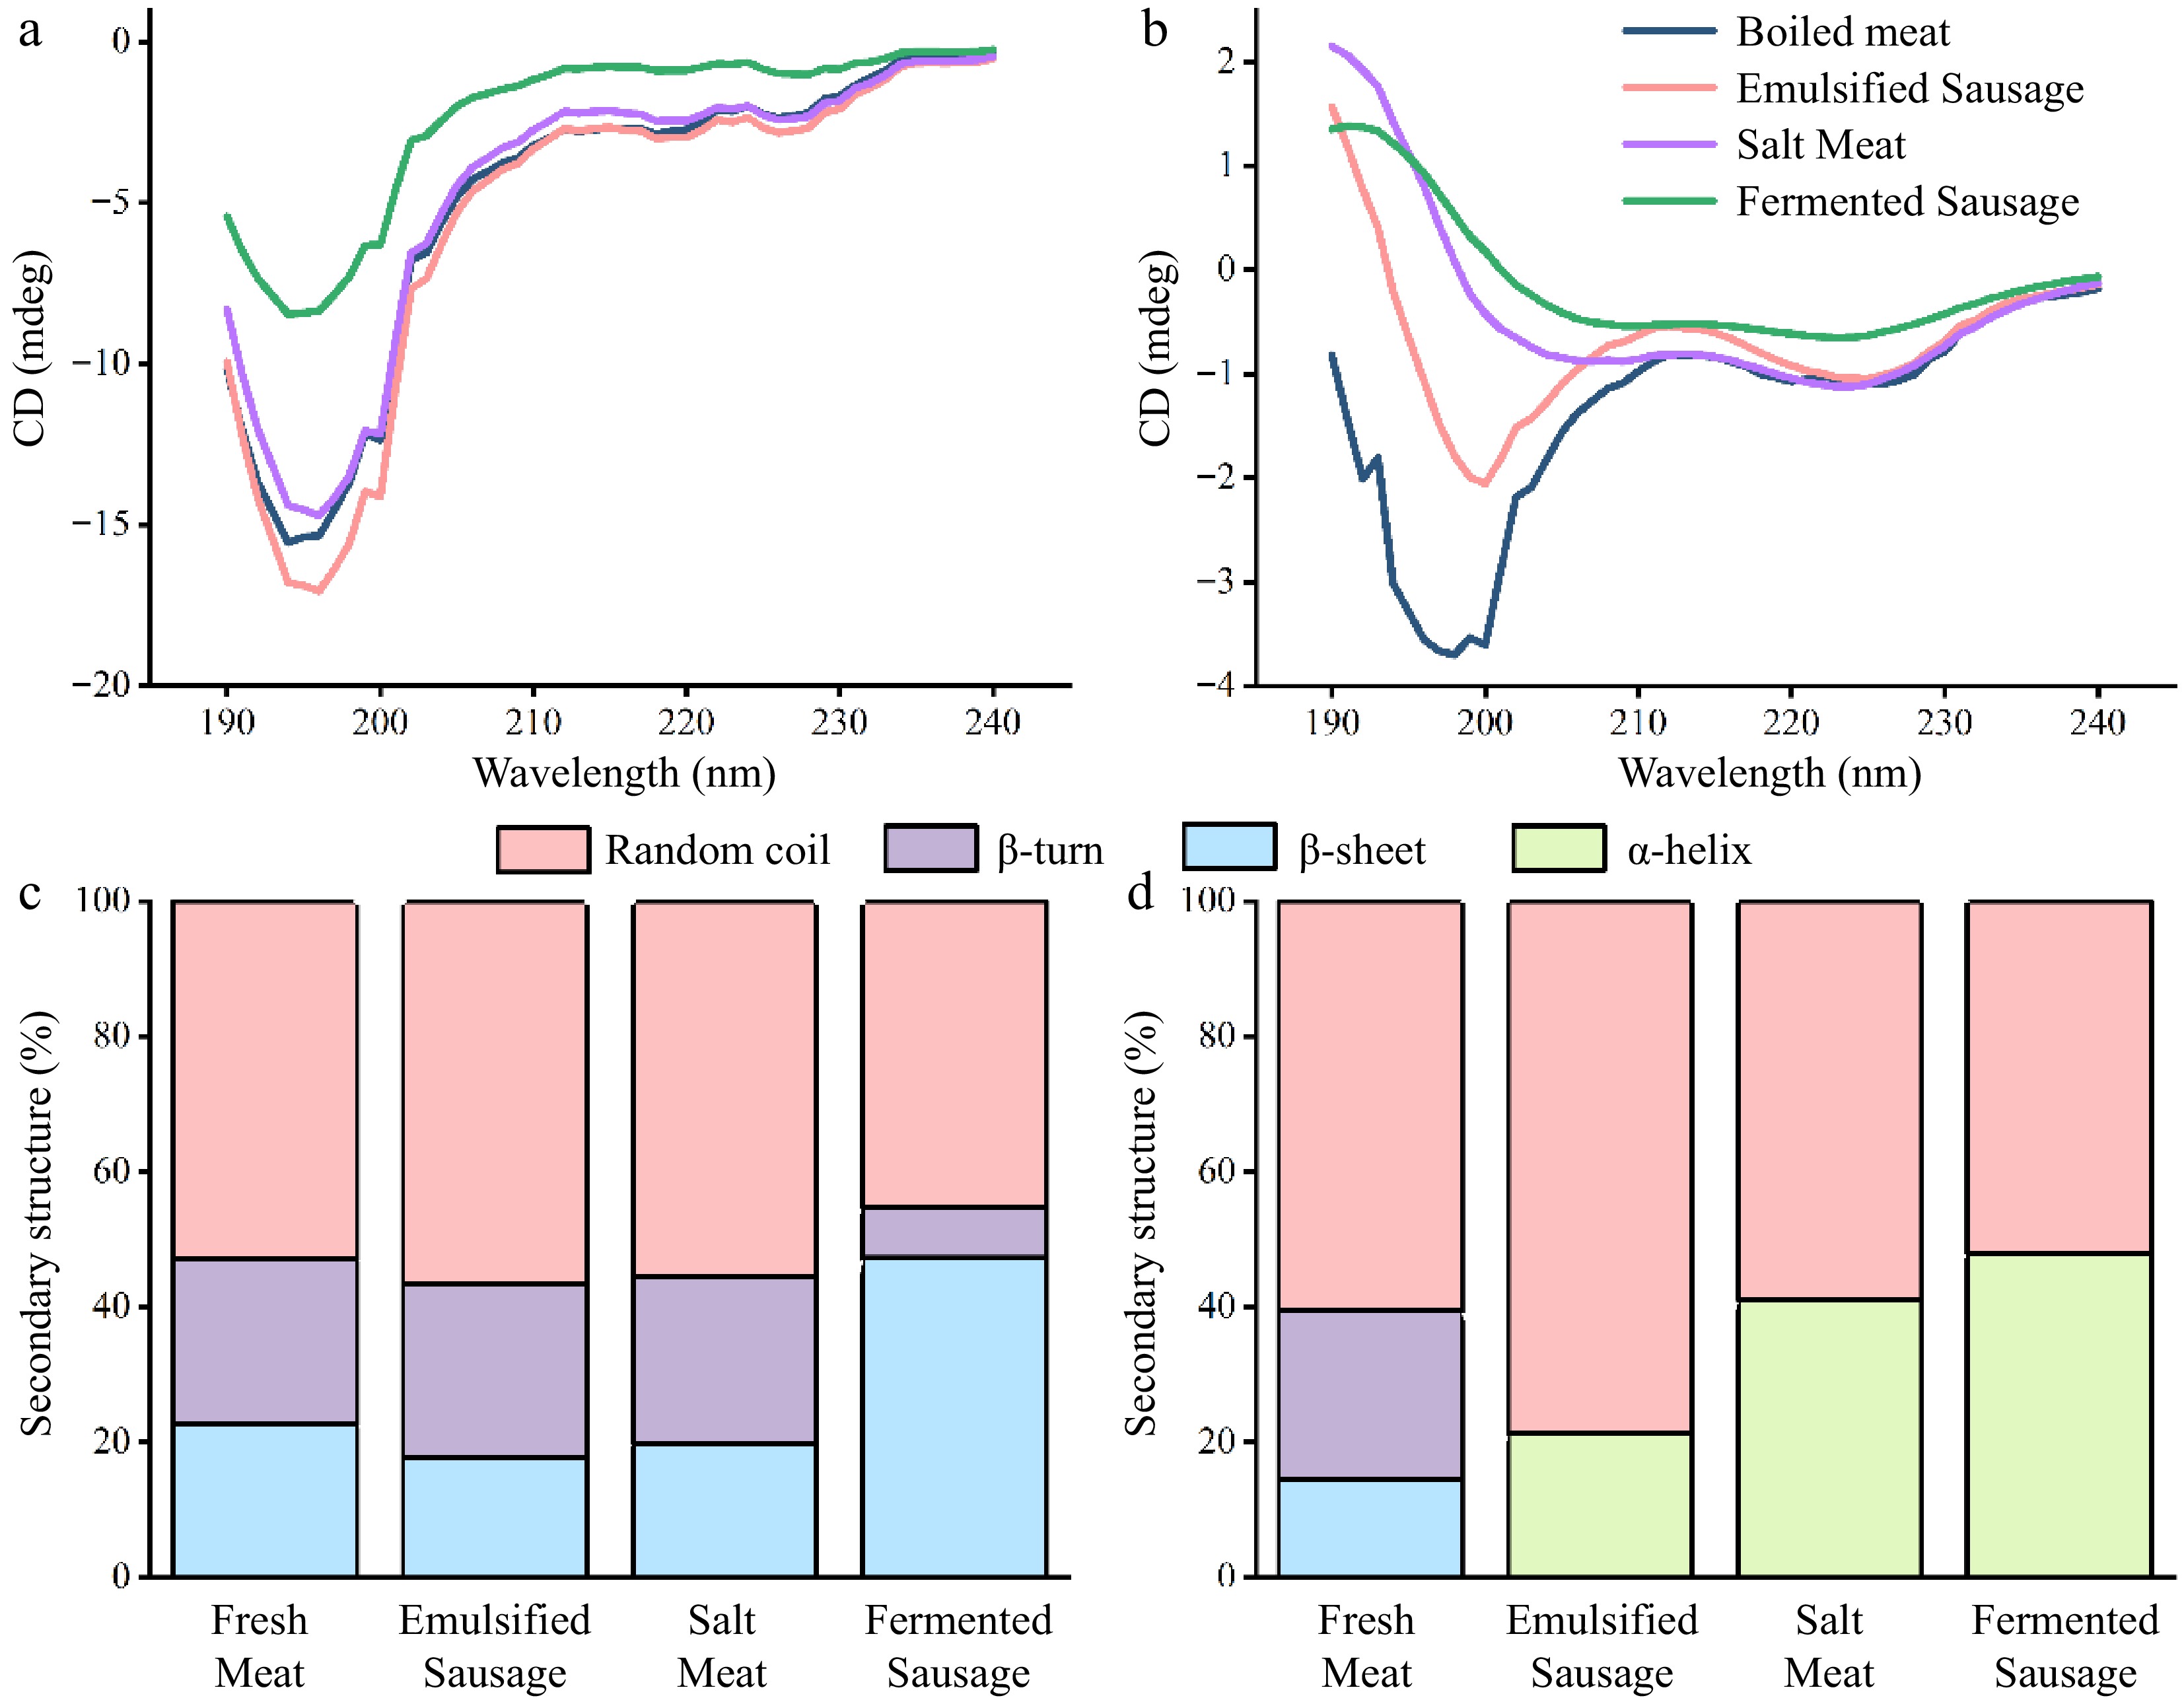
Figure 5.
The changes of protein secondary structure in different meat products were evaluated by CD spectroscopy. (a) CD profile of sarcoplasmic protein. (b) CD profile of myofibrillar protein. (c) Secondary structure content of sarcoplasmic protein. (d) Secondary structure content of myofibrillar protein.
-
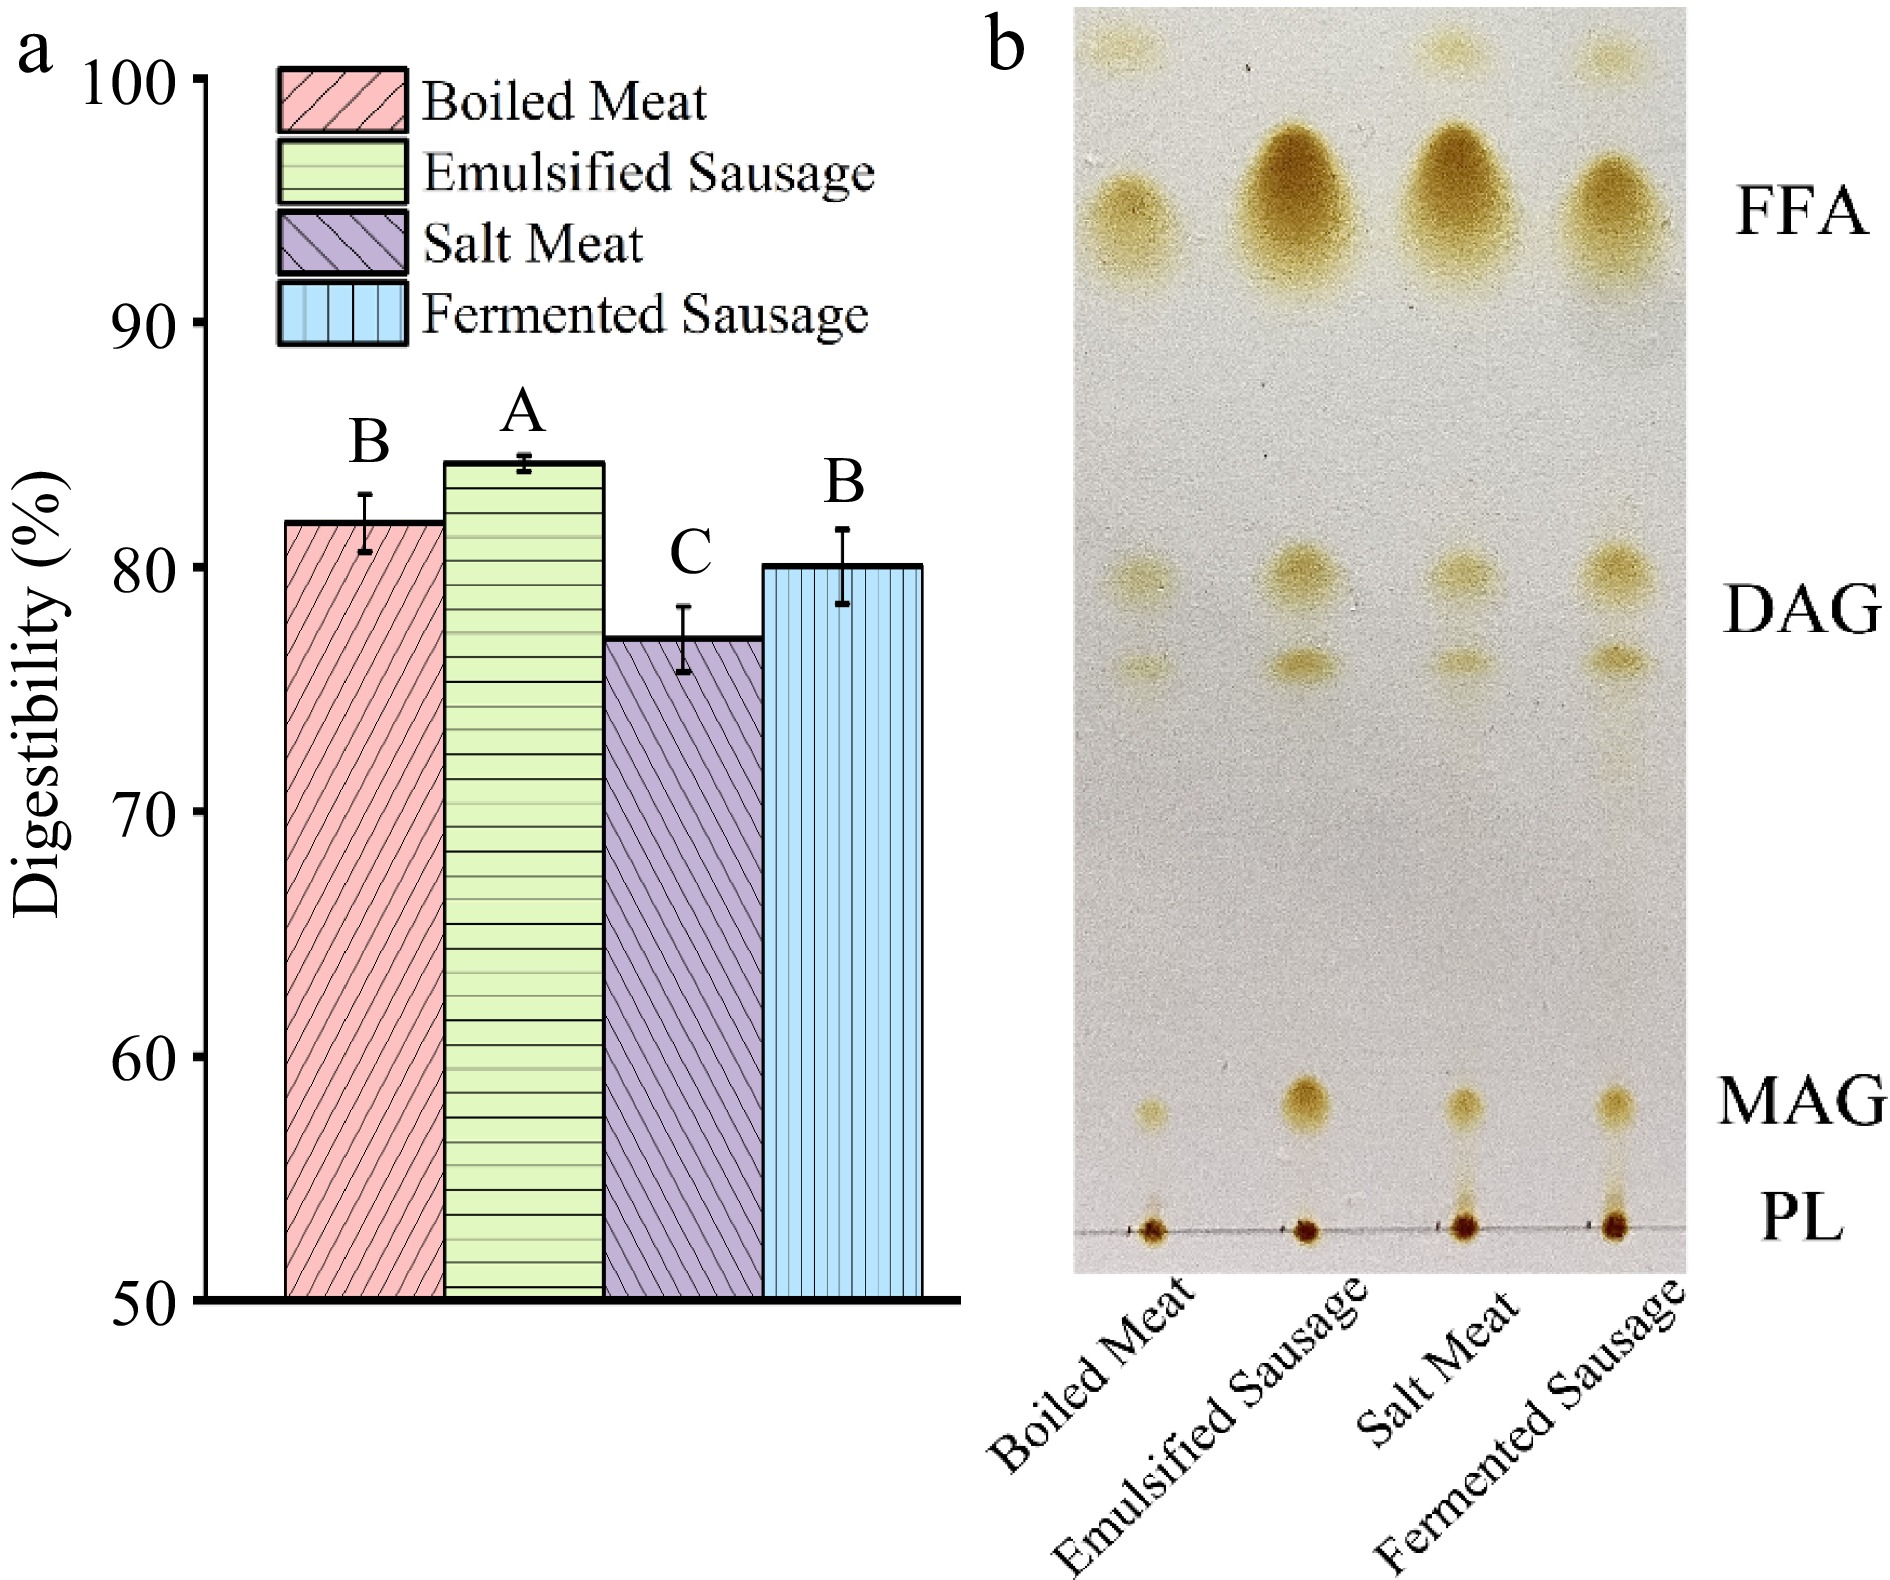
Figure 6.
Digestive characteristics of protein and fat in four meat products in vitro GIT digestive environment. (a) Intestinal digestibility of protein. (b) TLC analysis of lipids in the small intestinal phase.
-
Chemicals Final salt concentration
in SSF (mM)Final salt concentration
in SGF (mM)Final salt concentration
in SIF (mM)KCl 15.1 6.9 6.8 KH2PO4 3.7 0.9 0.8 NaHCO3 13.6 25 85 NaCl − 47.2 38.4 MgCl2(H2O)6 0.15 0.12 0.33 (NH4)2CO3 0.06 0.5 − HCl 1.1 15.6 8.4 Table 1.
Chemical composition of simulated digestive fluids in each stage of GIT model.
Figures
(6)
Tables
(1)