-
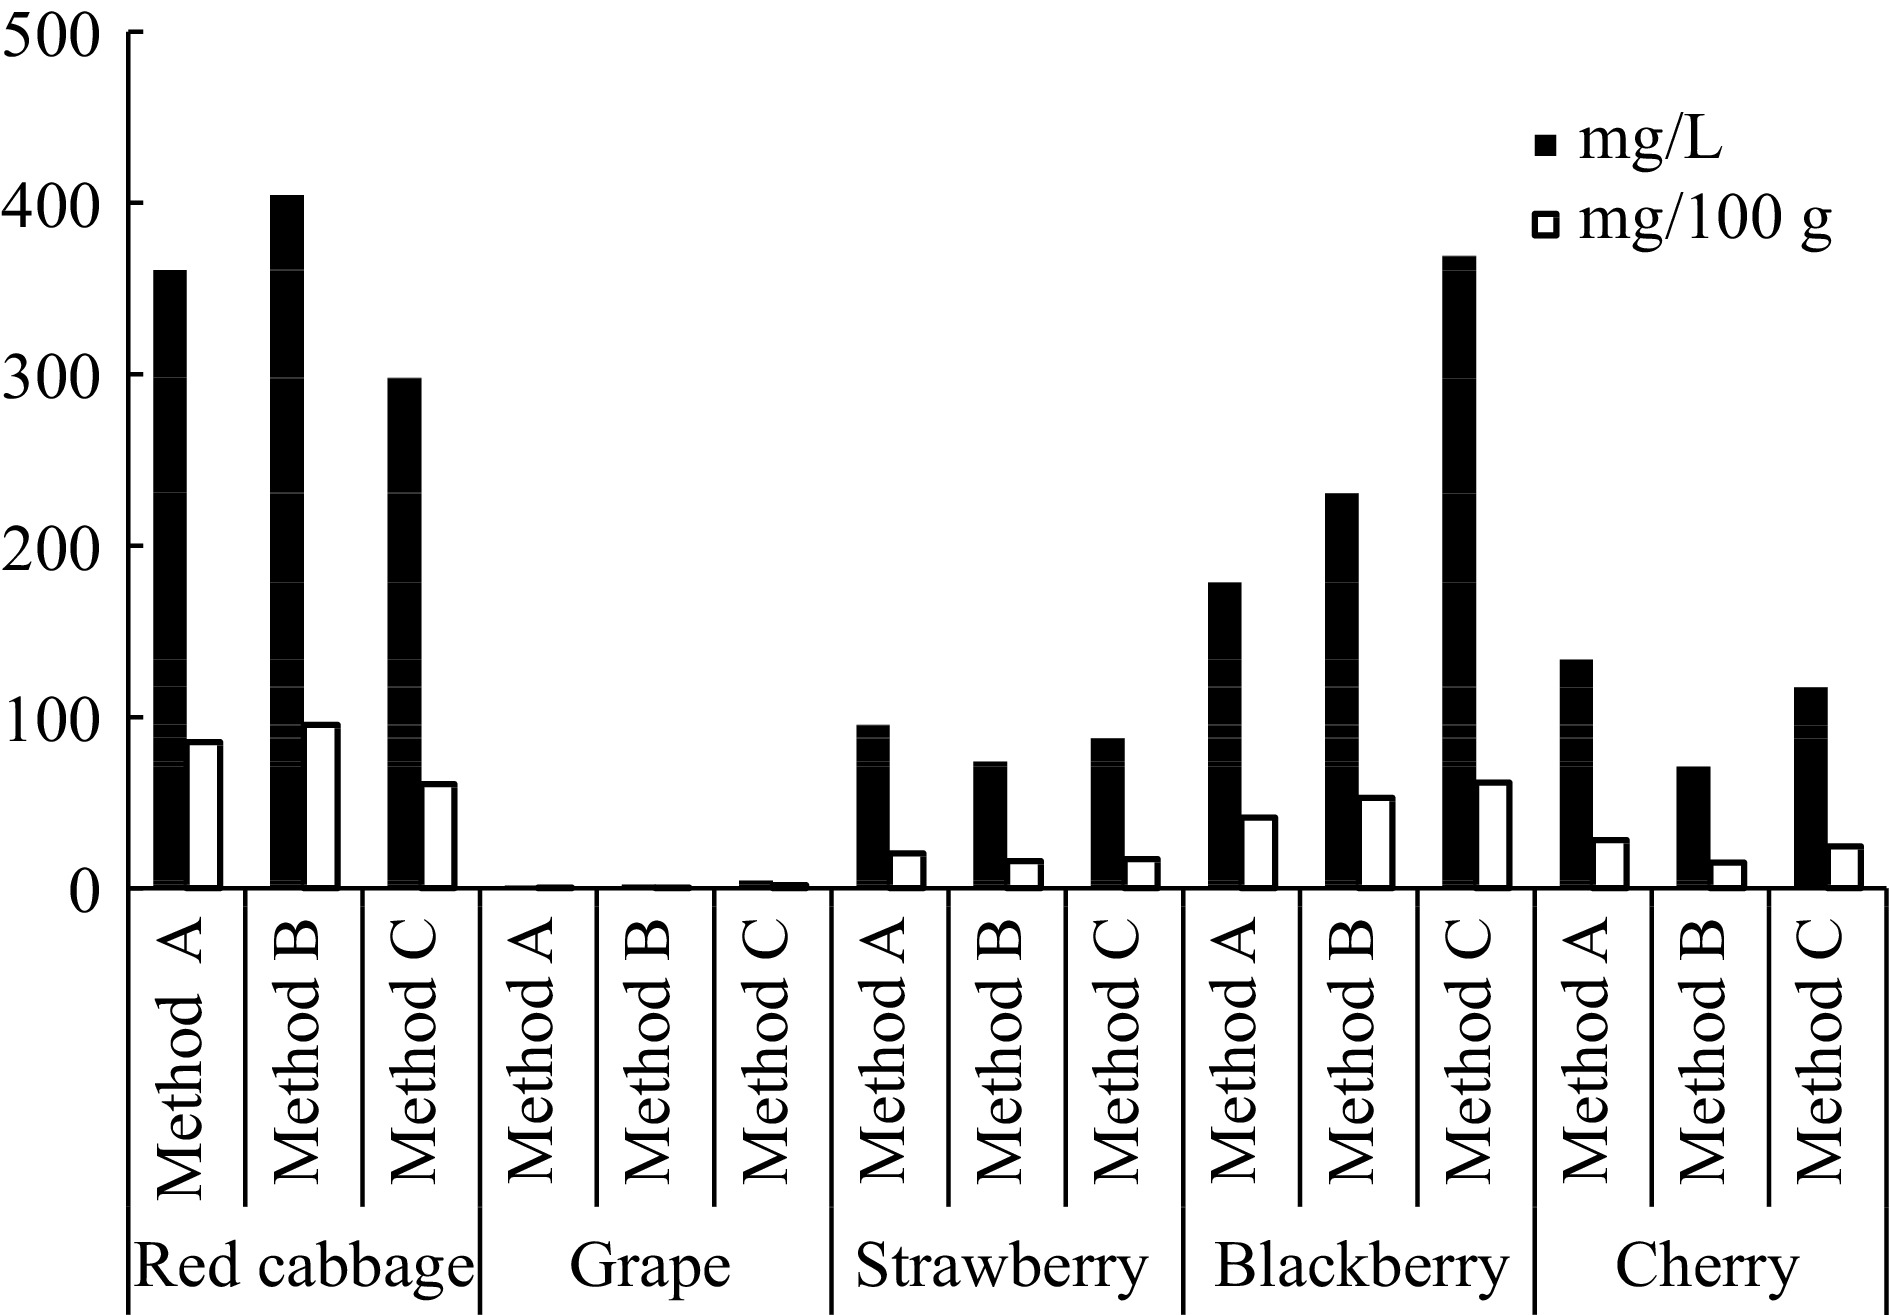
Figure 1.
Anthocyanin contents extracted from different sources.
-
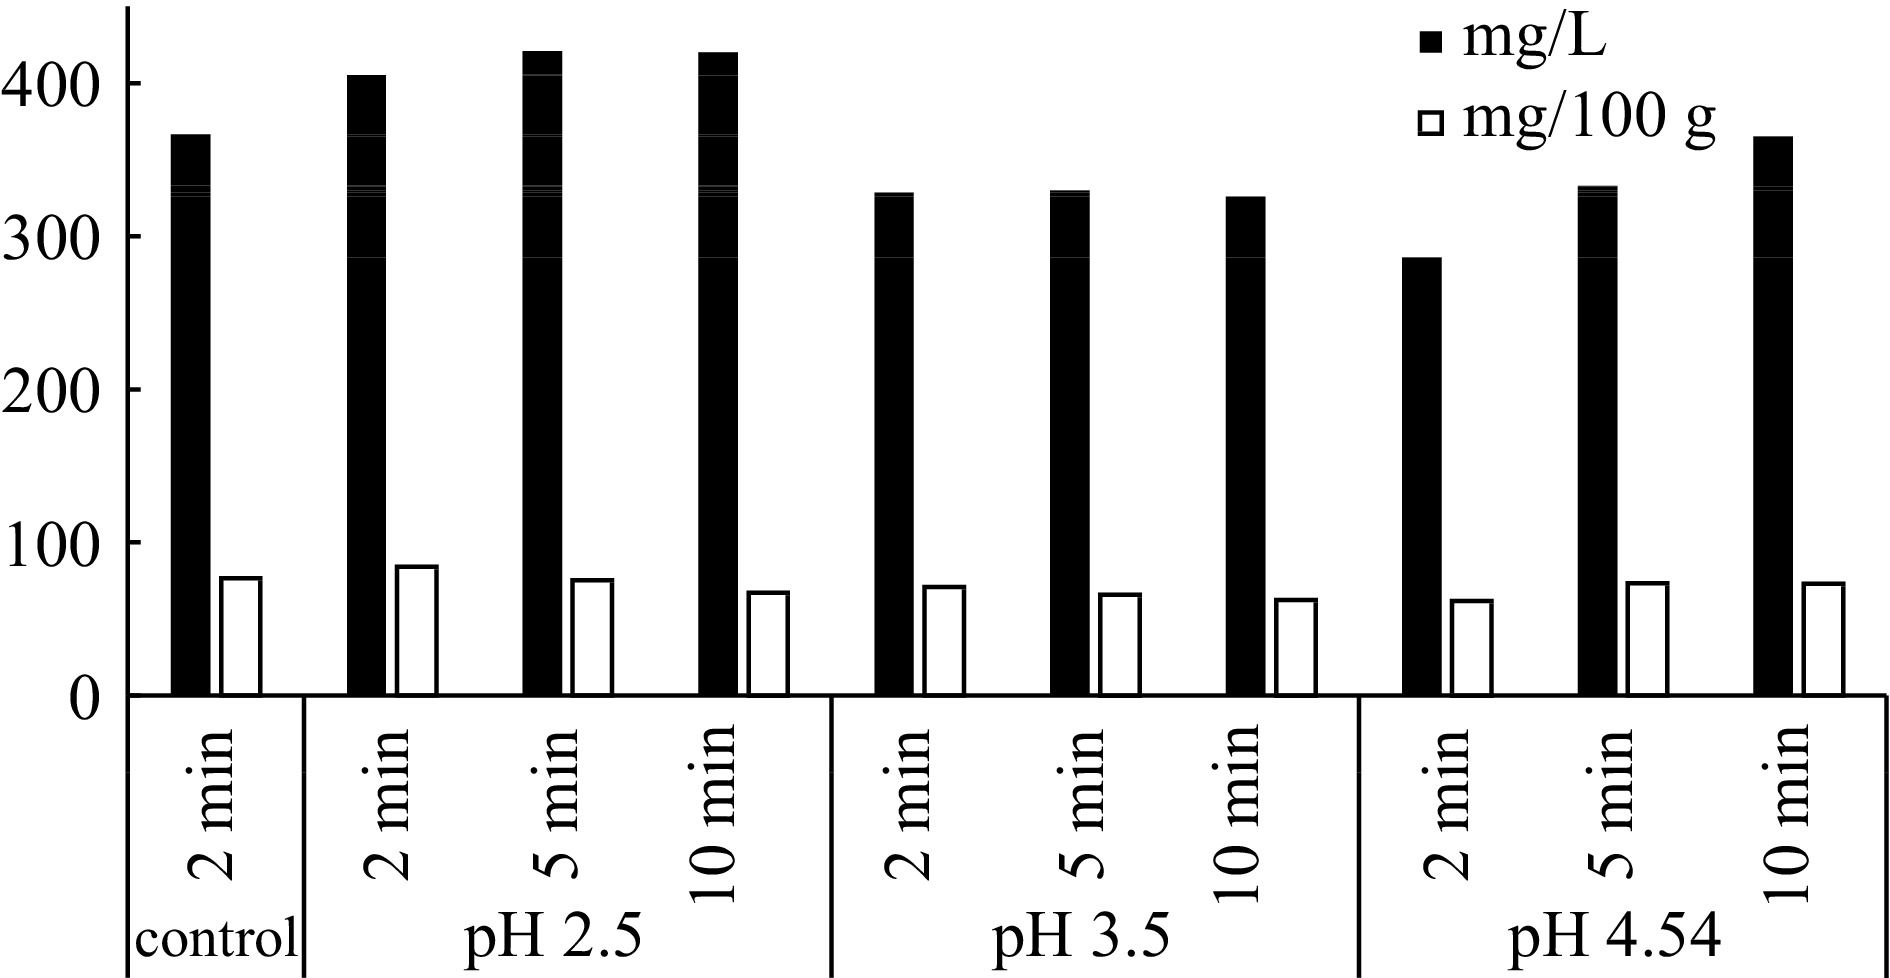
Figure 2.
Anthocyanin contents of extracts prepared by Methods A and B.
-
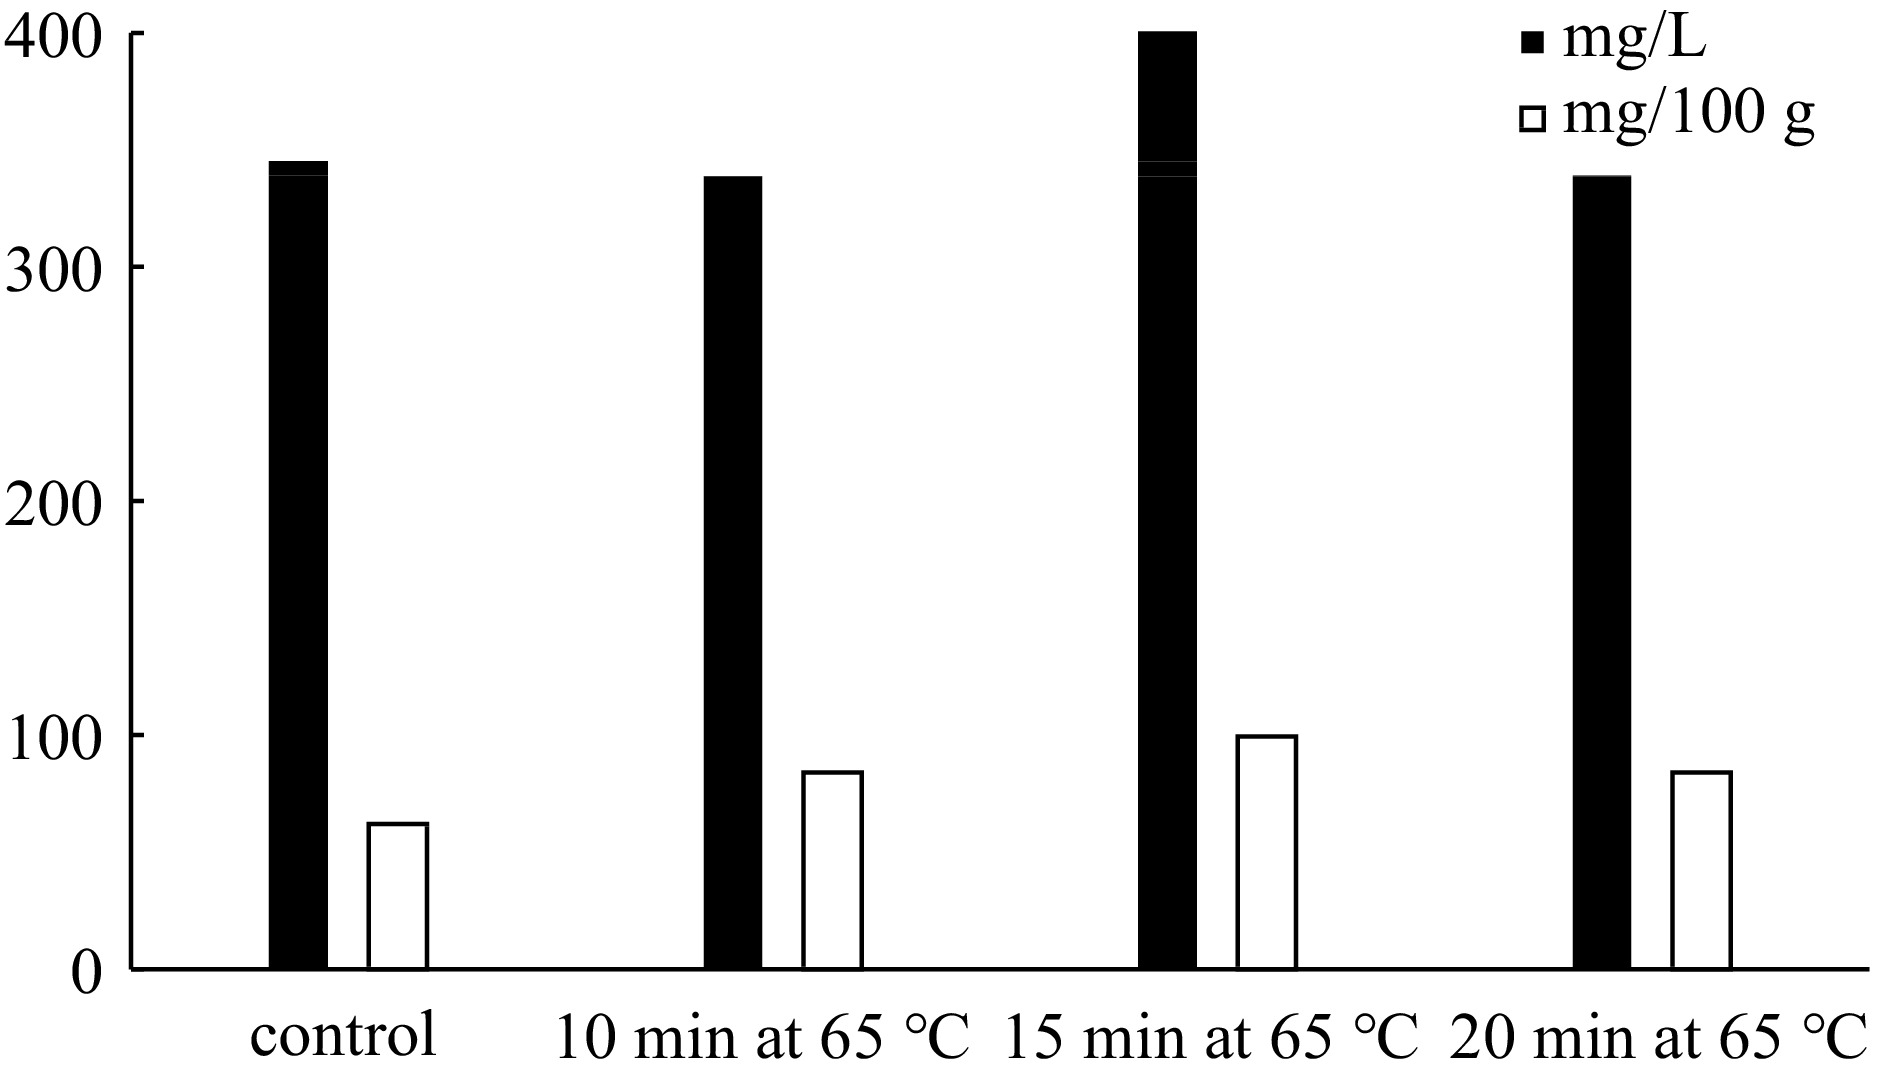
Figure 3.
Anthocyanin content of extracts prepared by Method C.
-
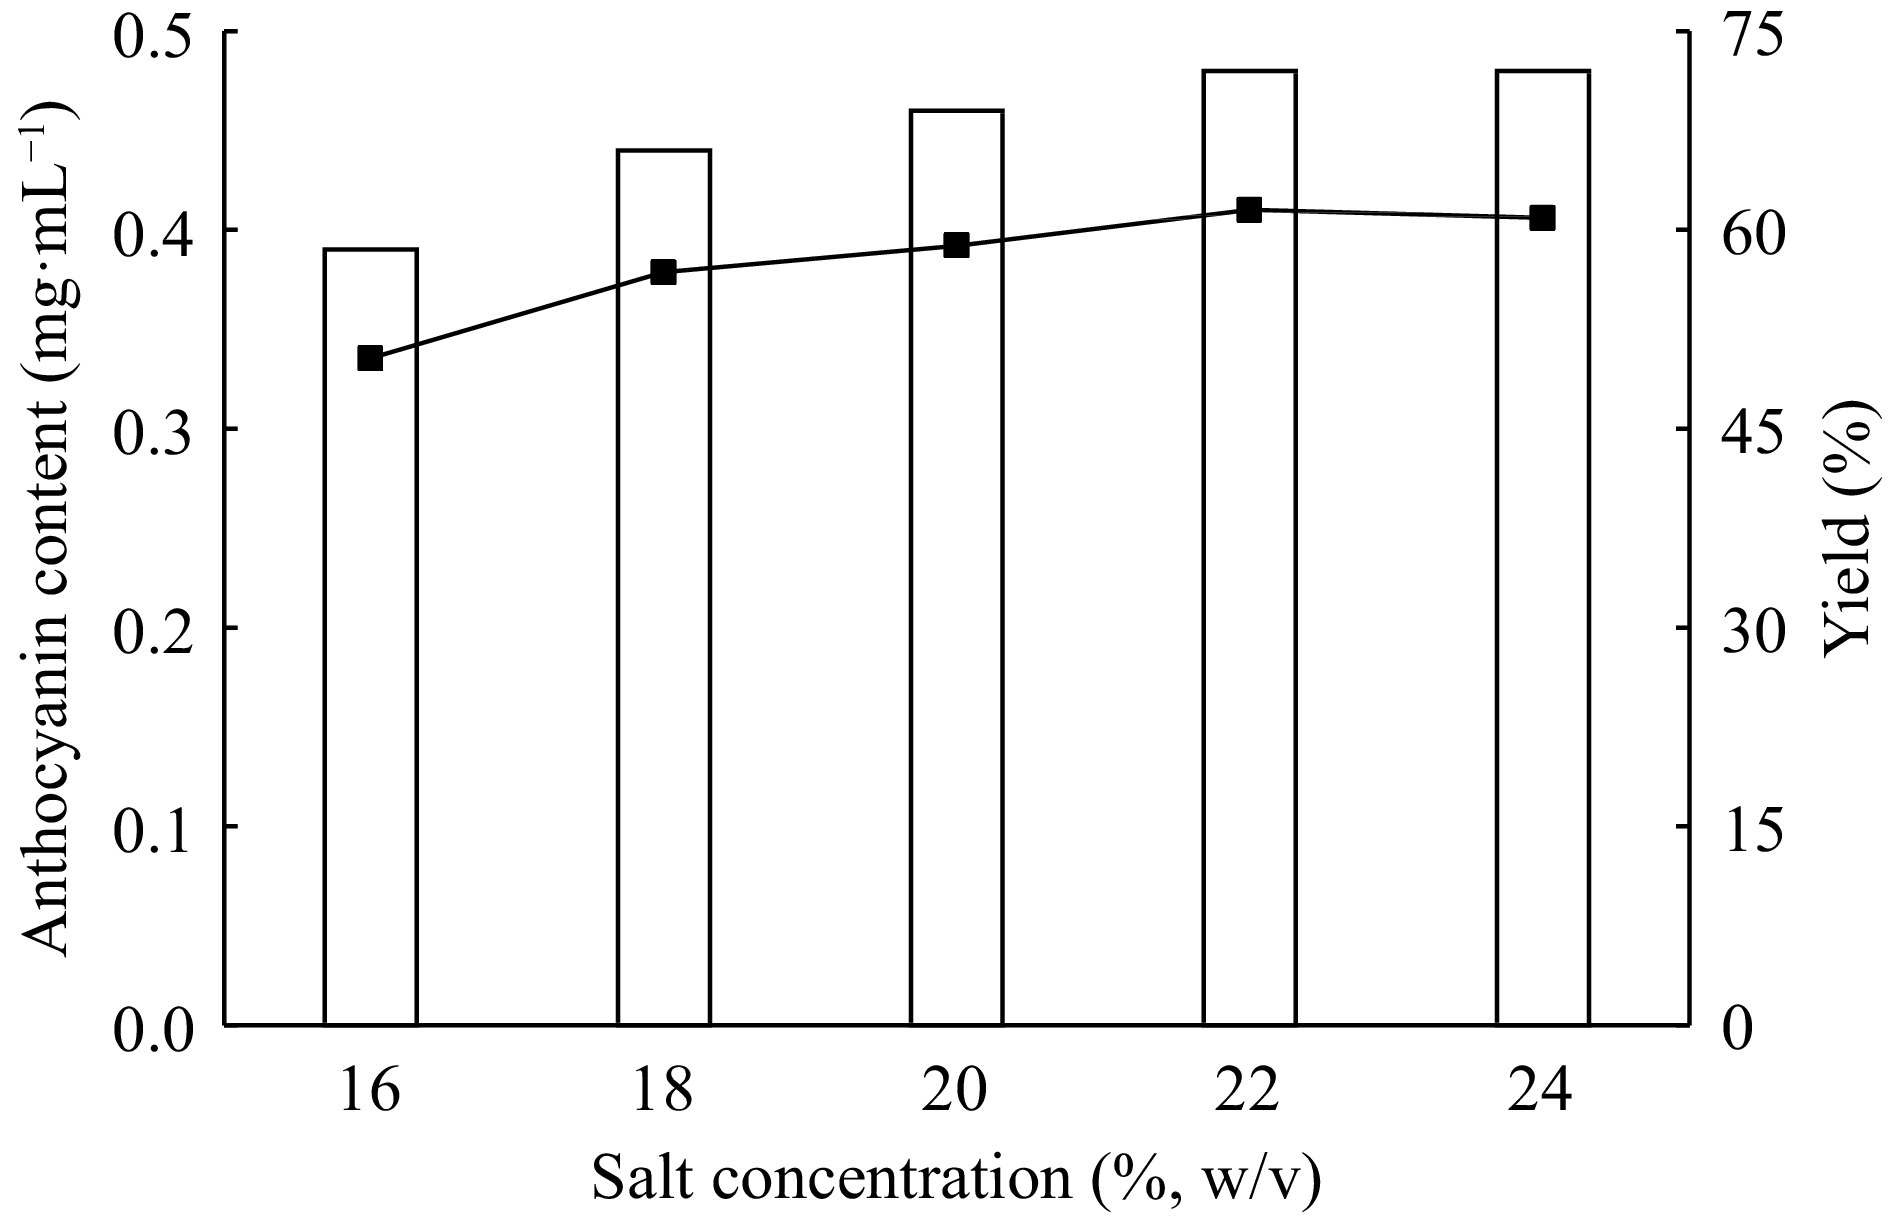
Figure 4.
Effect of salt concentration on extraction and purification of red cabbage anthocyanins by ATPE.
-
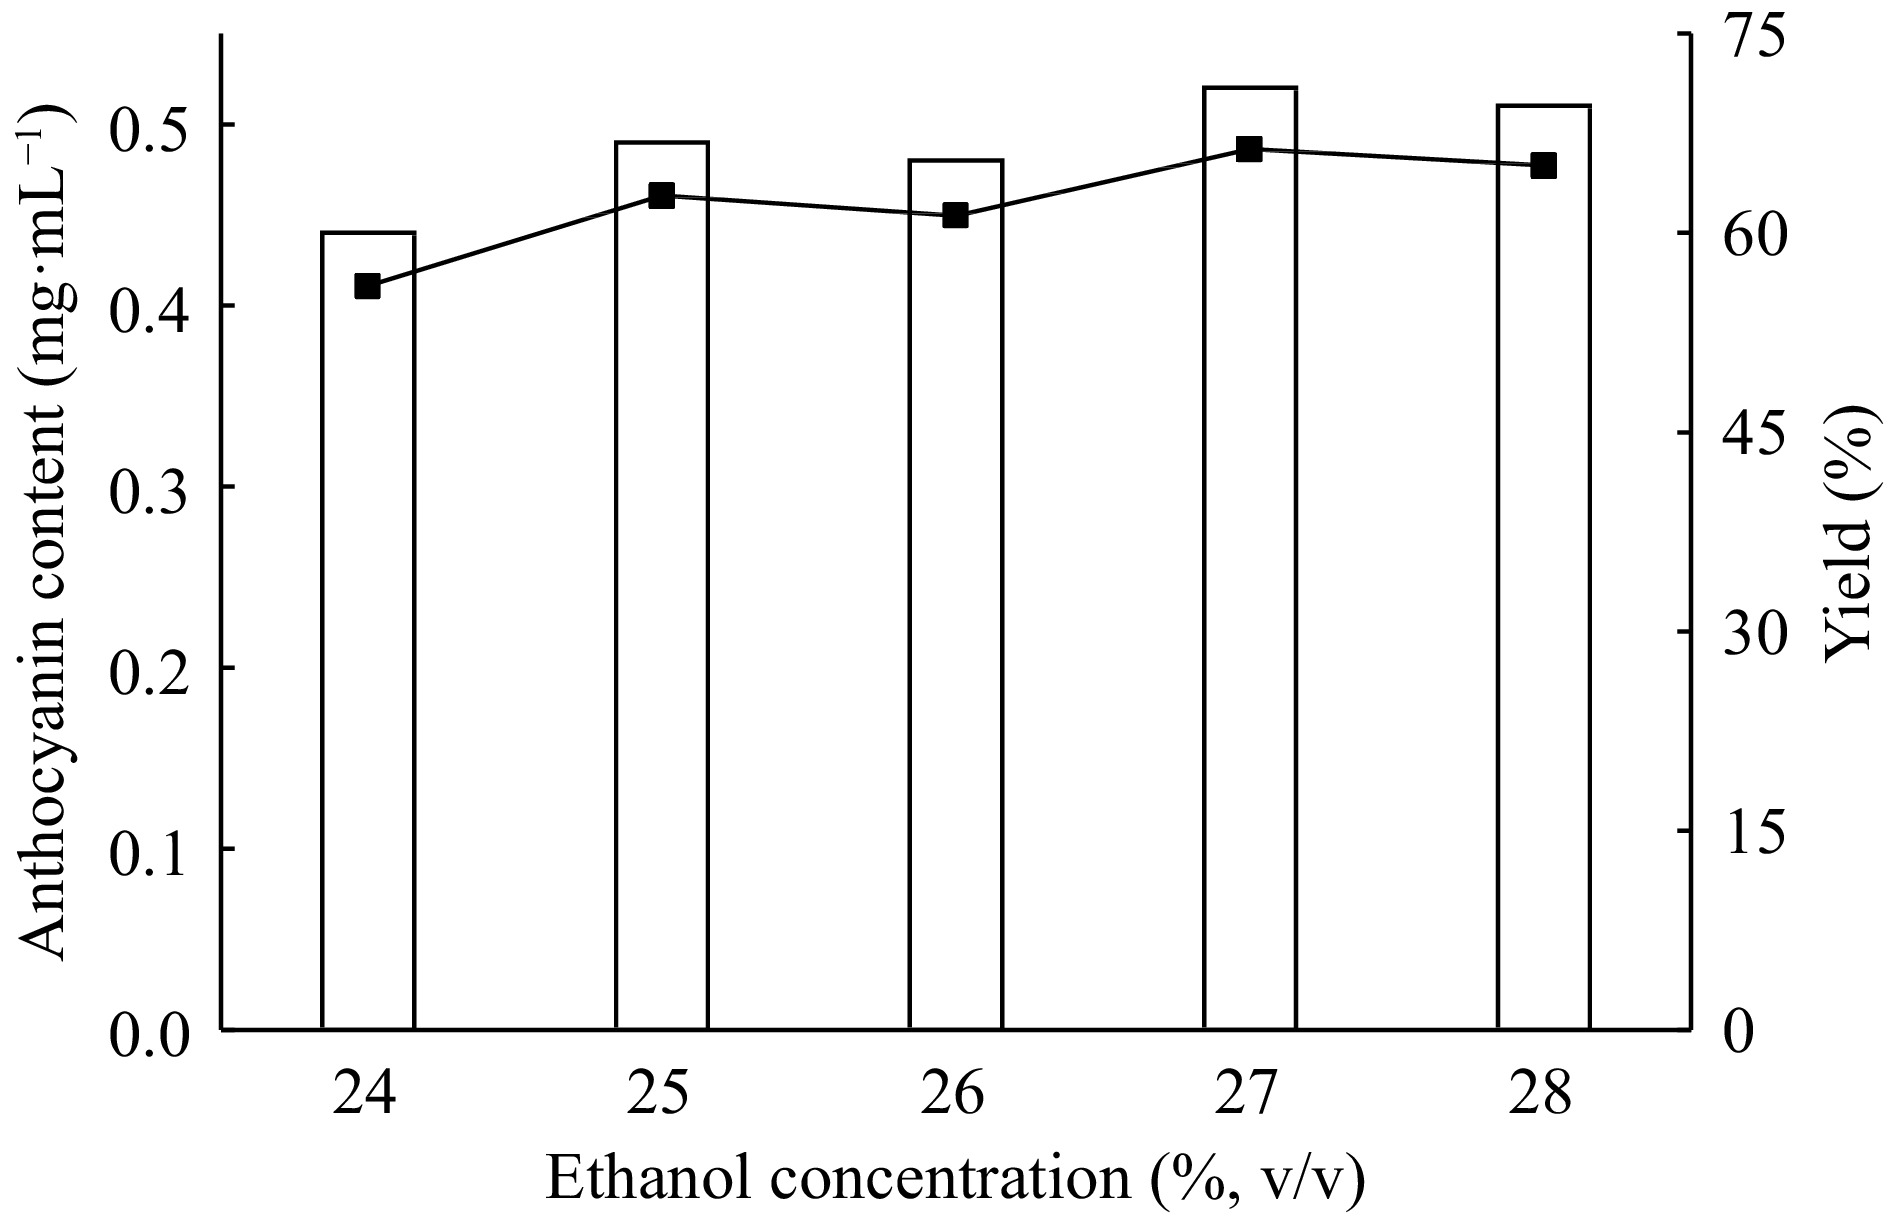
Figure 5.
Effect of ethanol concentration on the extraction and purification of red cabbage anthocyanins by ATPE.
-
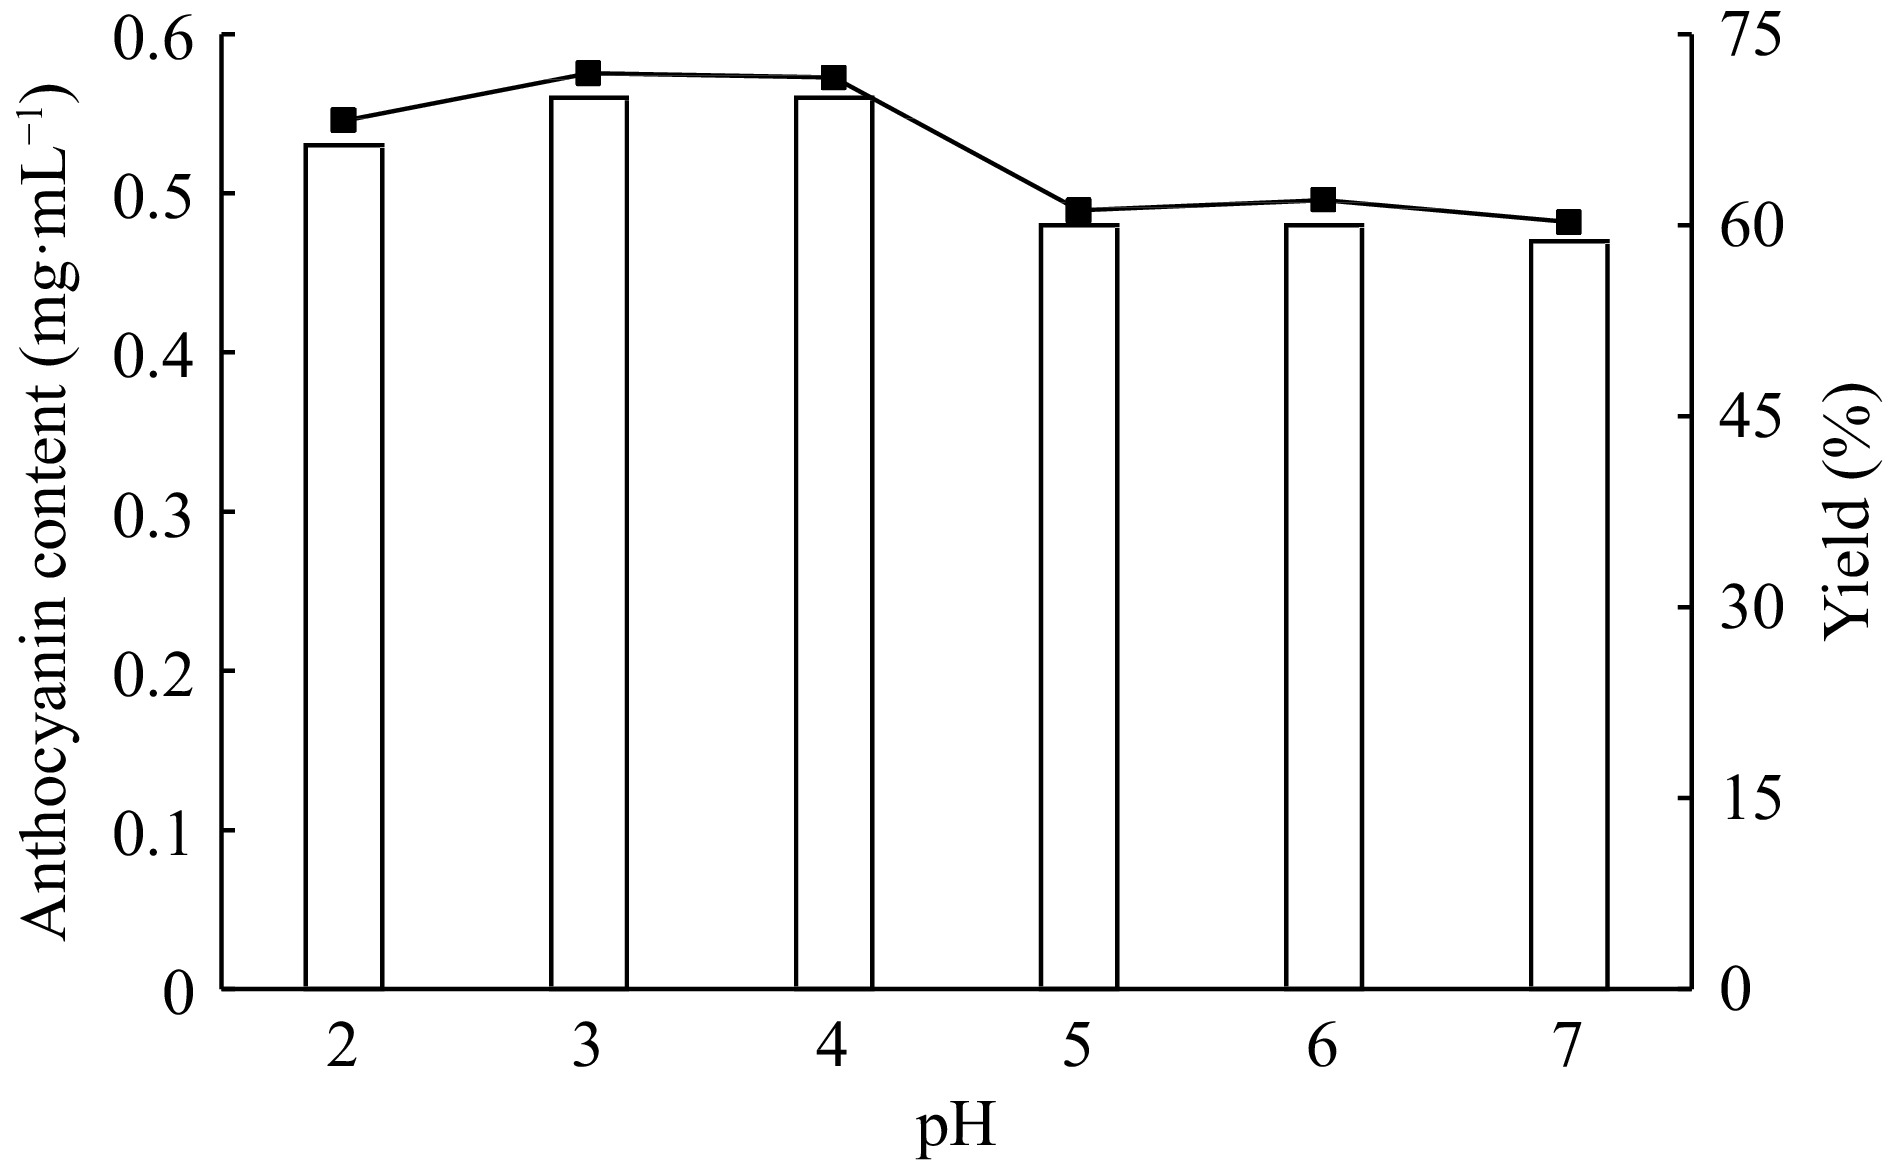
Figure 6.
Effect of pH on the extraction and purification of red cabbage anthocyanins by ATPE.
-
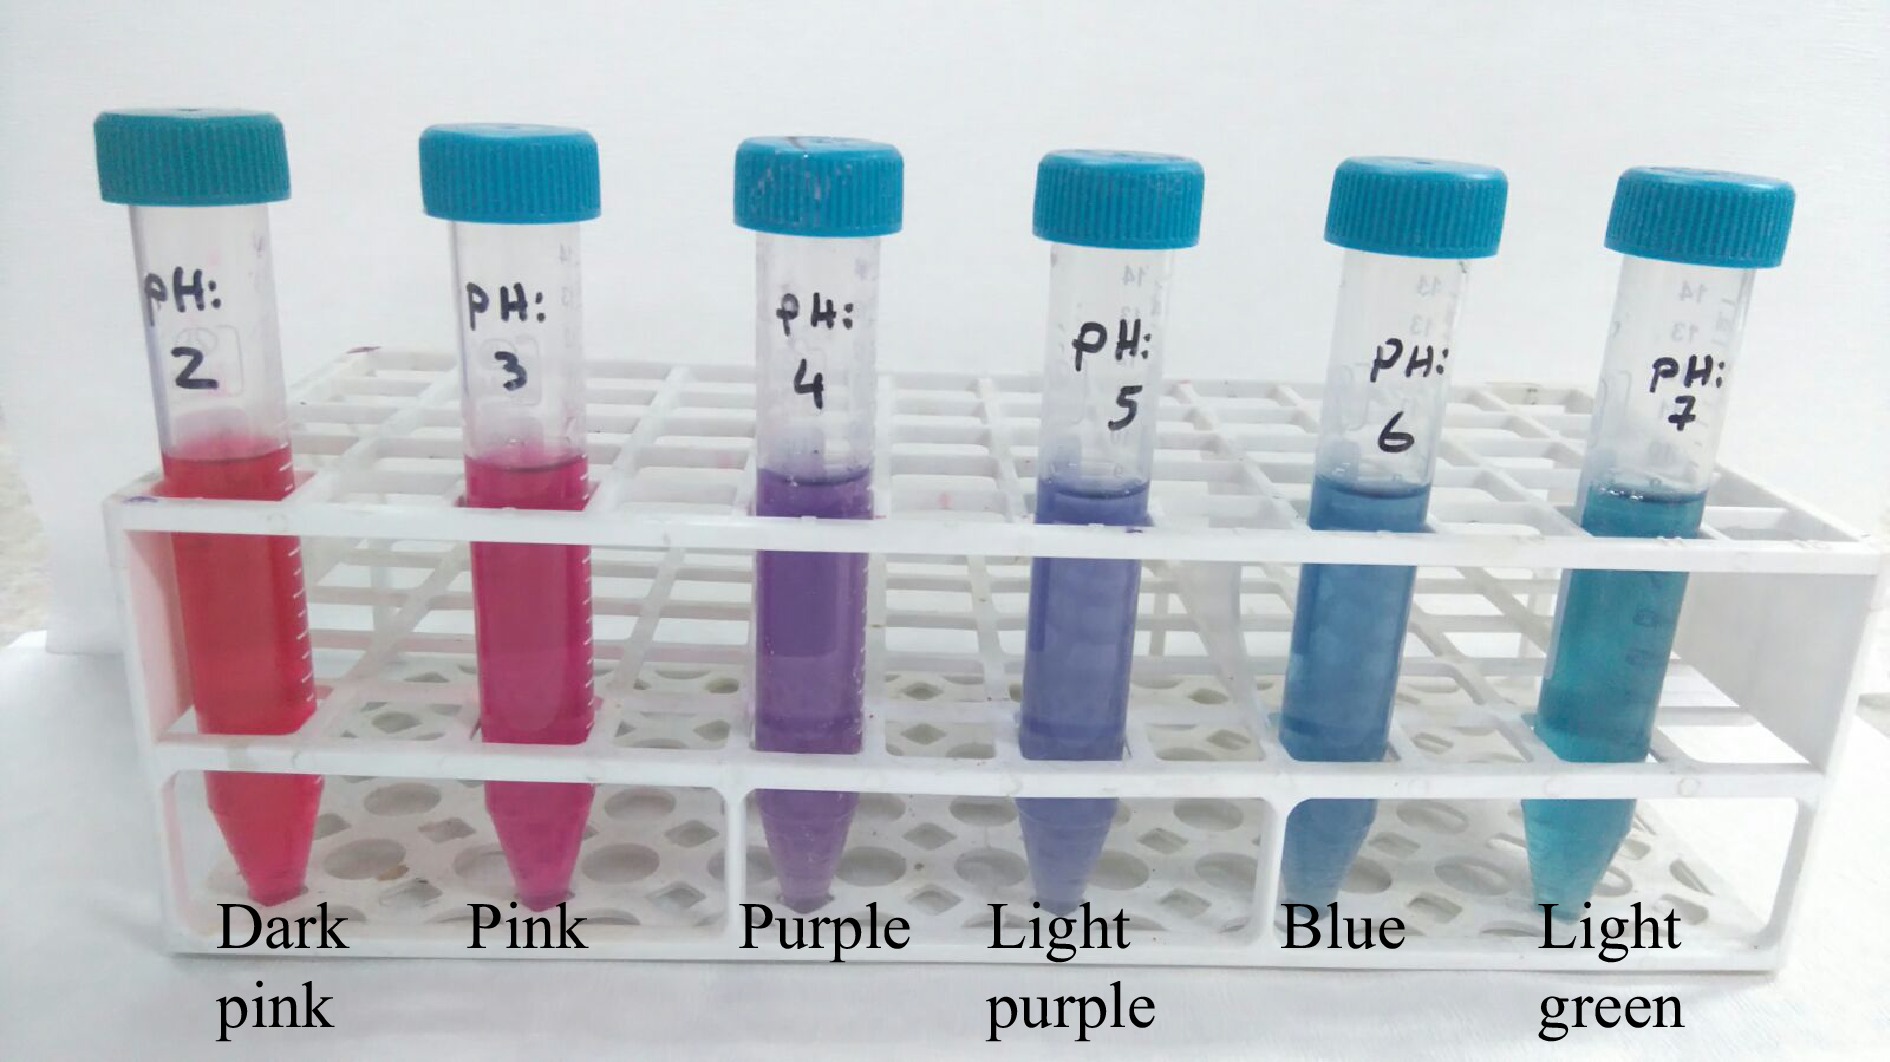
Figure 7.
pH-dependent color change of red cabbage anthocyanins.
-
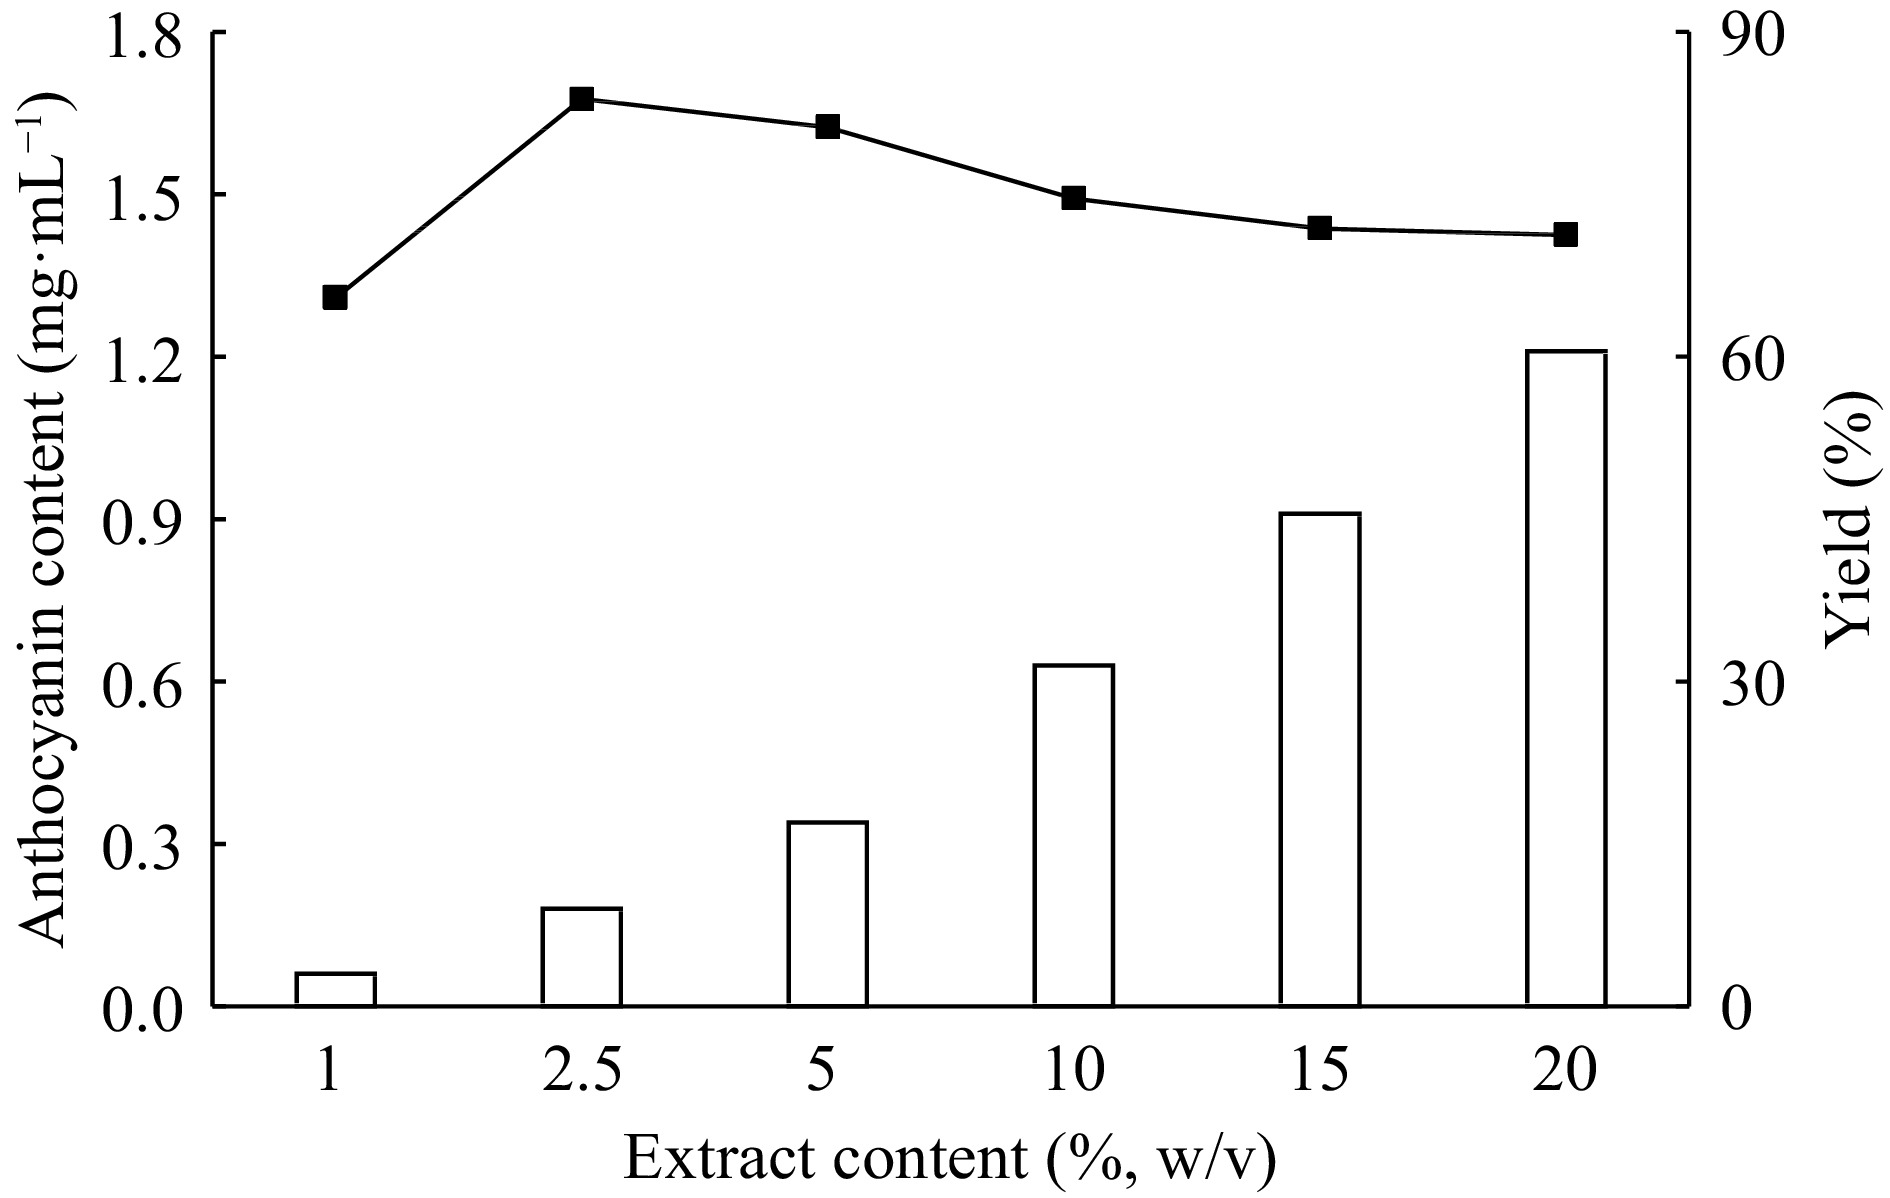
Figure 8.
The effect of extract content on the extraction and purification of red cabbage anthocyanins by ATPE.
-
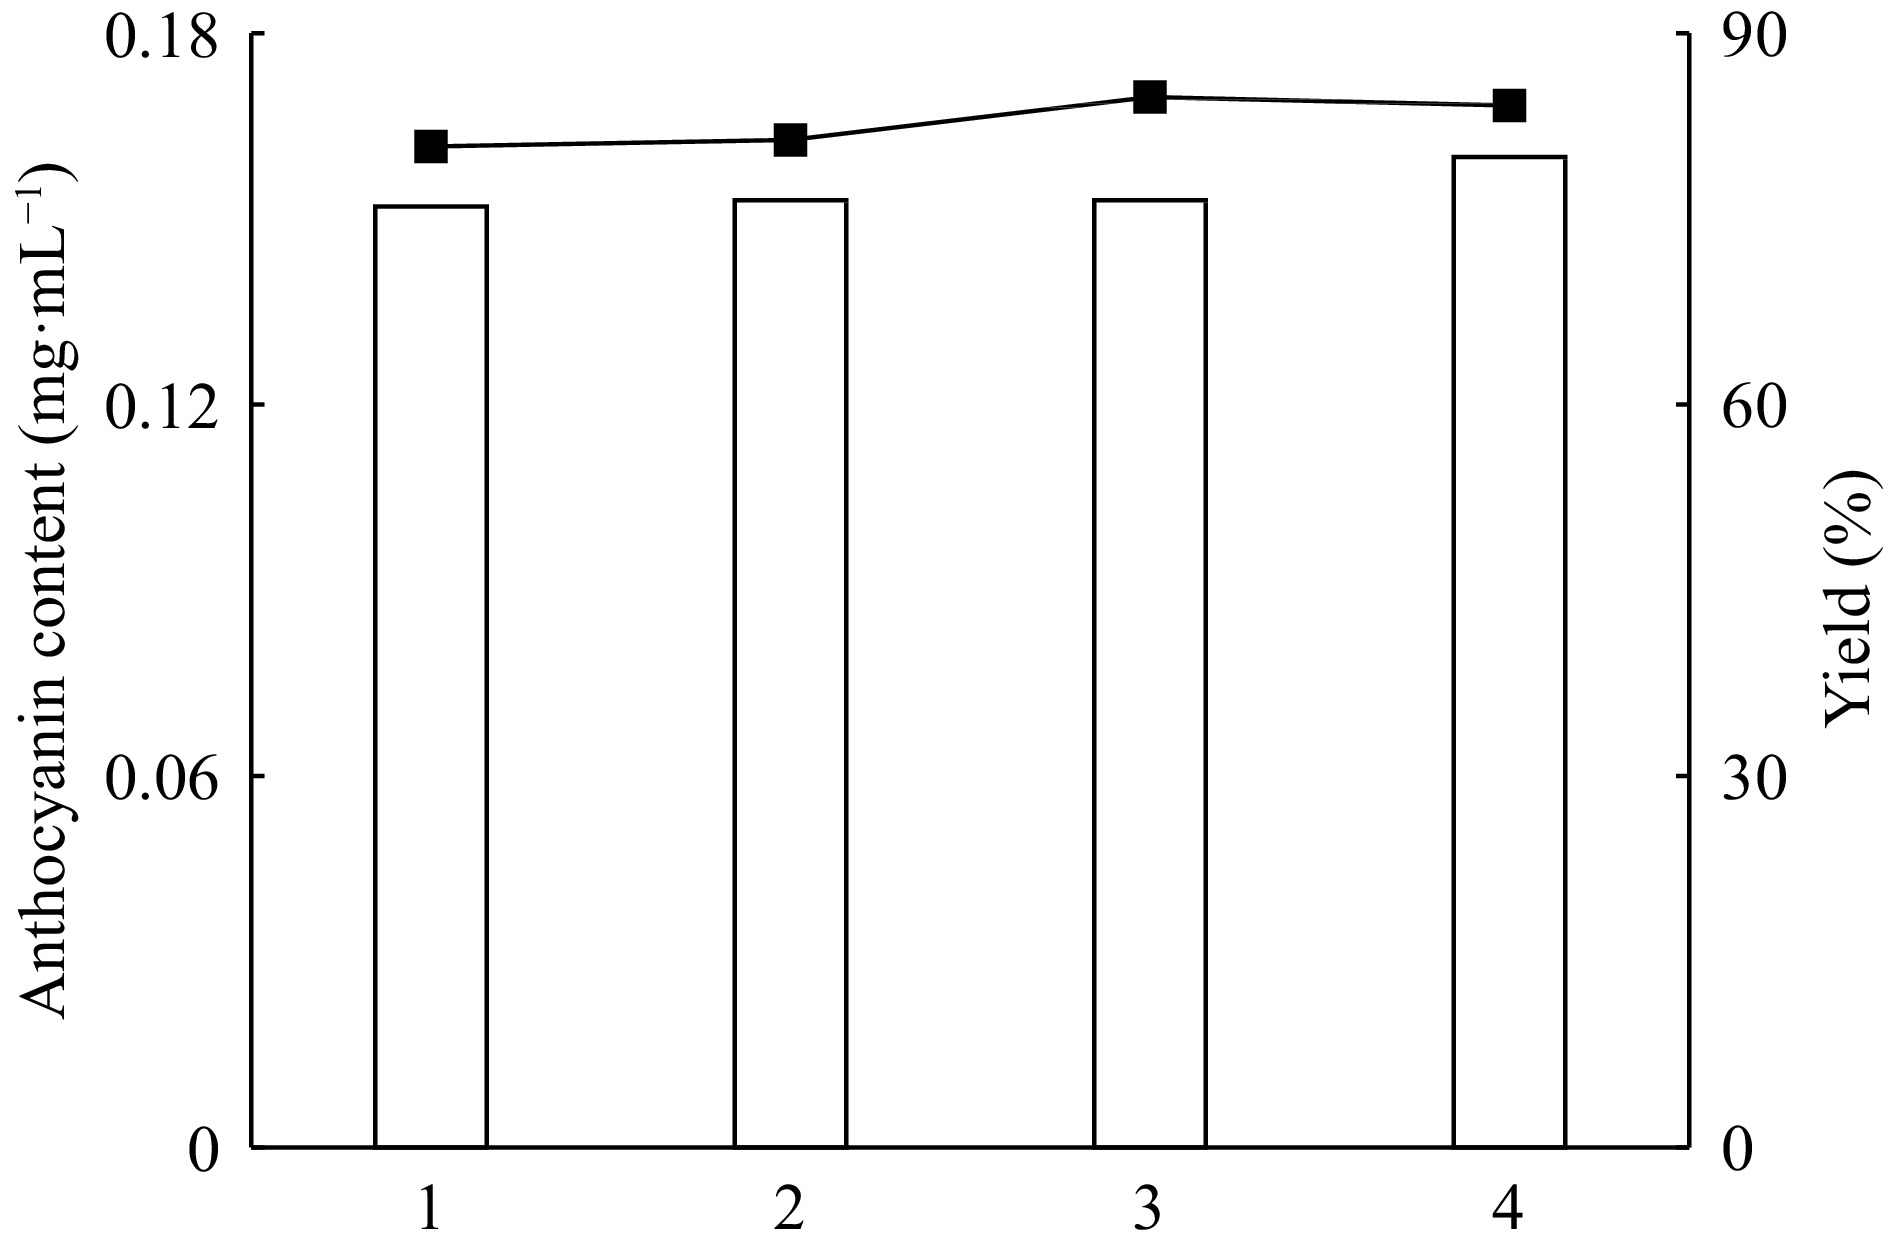
Figure 9.
Reproducibility of red cabbage anthocyanins with ATPE systems (reproducibility numbers; 1, 2, 3, 4).
-
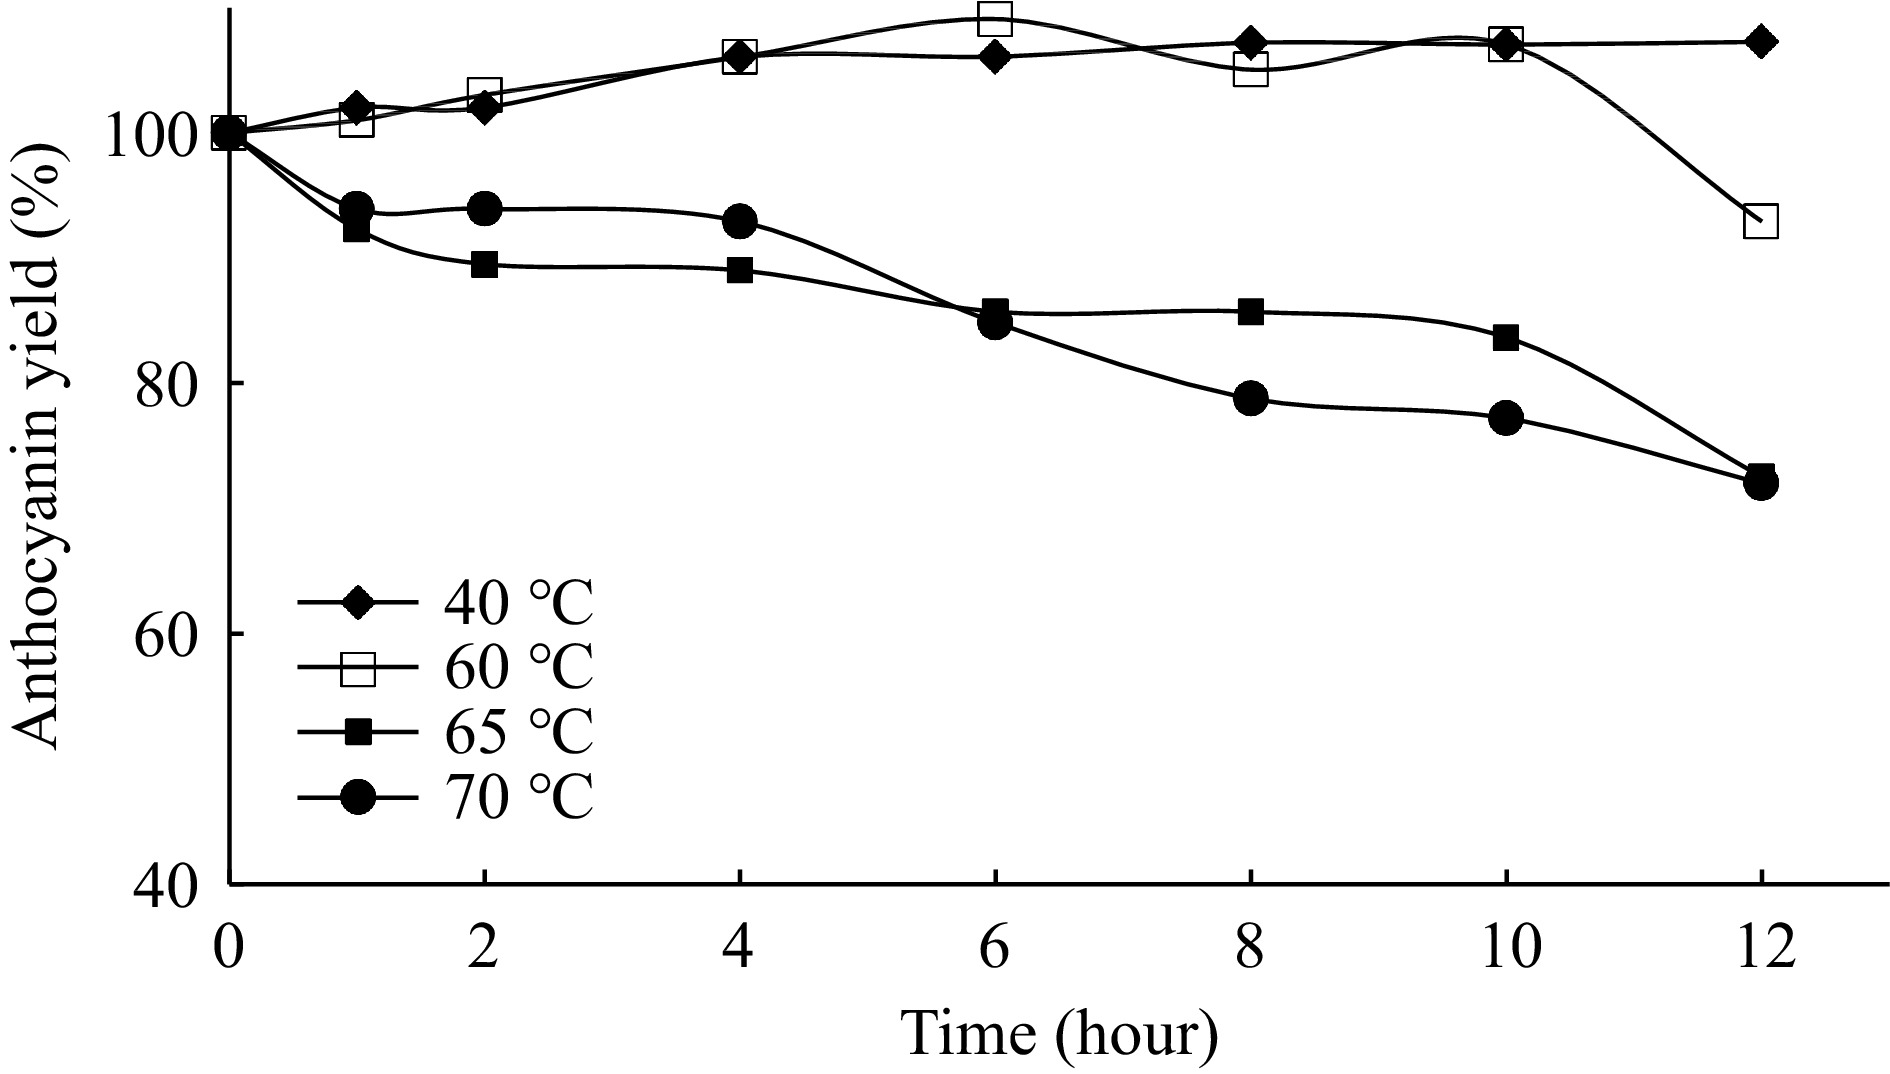
Figure 10.
Time-dependent thermal stability of anthocyanins.
-
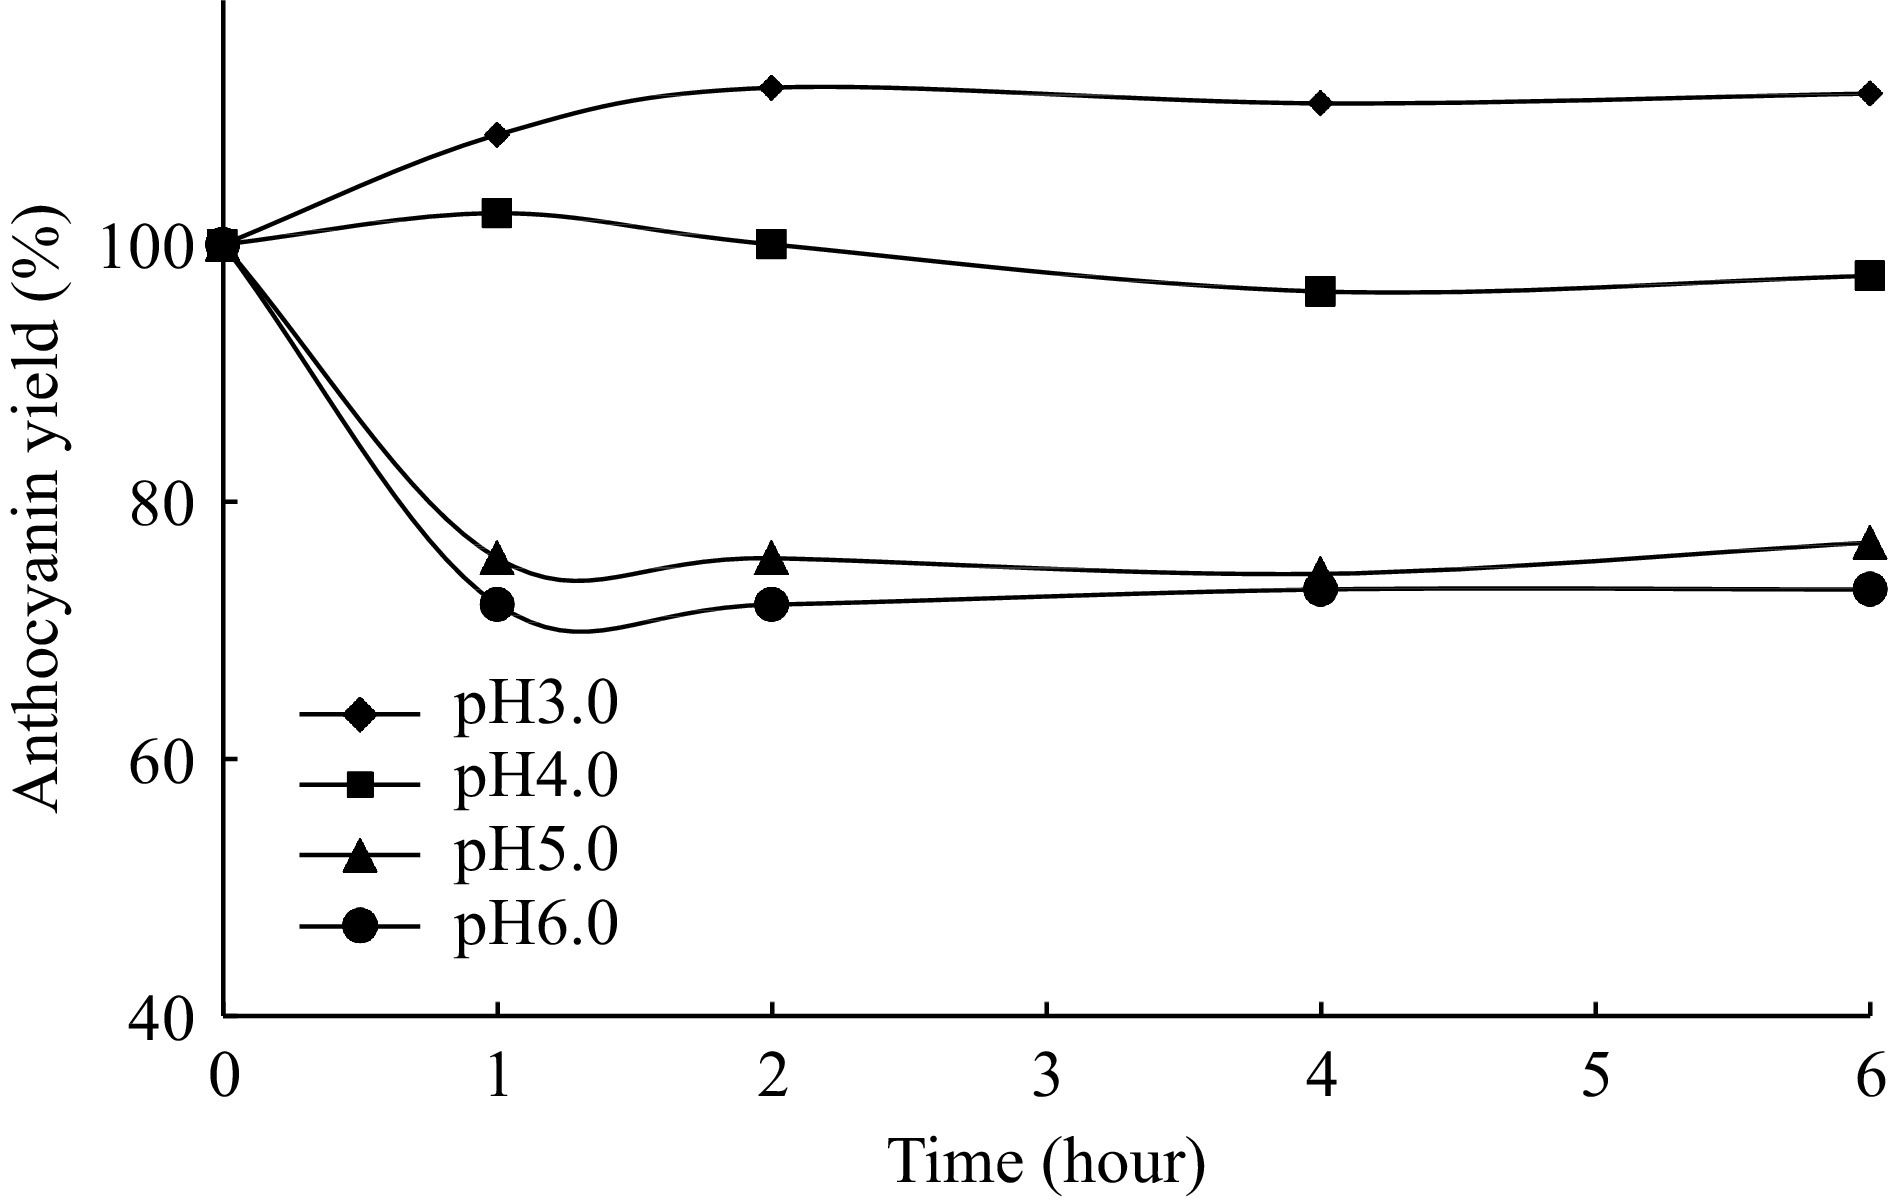
Figure 11.
Time-dependent pH stability of anthocyanins.
-
Step Total anthocyanin
(mg/L)Yield
(%)Pre-extract 0.215 100 ATPE-top phase 0.180 83.7 ATPE-bottom phase 0.030 16.2 * Ammonium sulfate (22%, w/v) was added to the anthocyanin extract (2.5%, w/v) of red cabbage and after then the pH was adjusted to pH 3.0. Afterwards, ethanol (27%, v/v) was added to the extract and two phases were watched clearly. The upper phase and the lower aqueous phase were separated and tested for anthocyanin amount. Each experiment was carried out in triplicate and the difference in the readings was less than ± 5%. Table 1.
Overall purification of anthocyanins from red cabbage by aqueous two-phase extra action.*
-
Sample Sugar content
(mg)Sugar yield
(%)Flavonoid content
(mg)Flavanoid yield
(%)Phenolic content
(mg)Phenolic yield
(%)Red cabbage (pre-extract) 21.9 100 0.44 100 1.10 100 ATPE-system (bottom phase) 17.4 79.5 0.10 23.5 0.32 29.02 ATPE-system (top phase) 4.4 20 0.34 78 0.91 82.5 Table 2.
Analysis of total sugar, flavonoid and phenolic compound content in red cabbage raw extract, ATPE system of bottom and top phases.
Figures
(11)
Tables
(2)