-
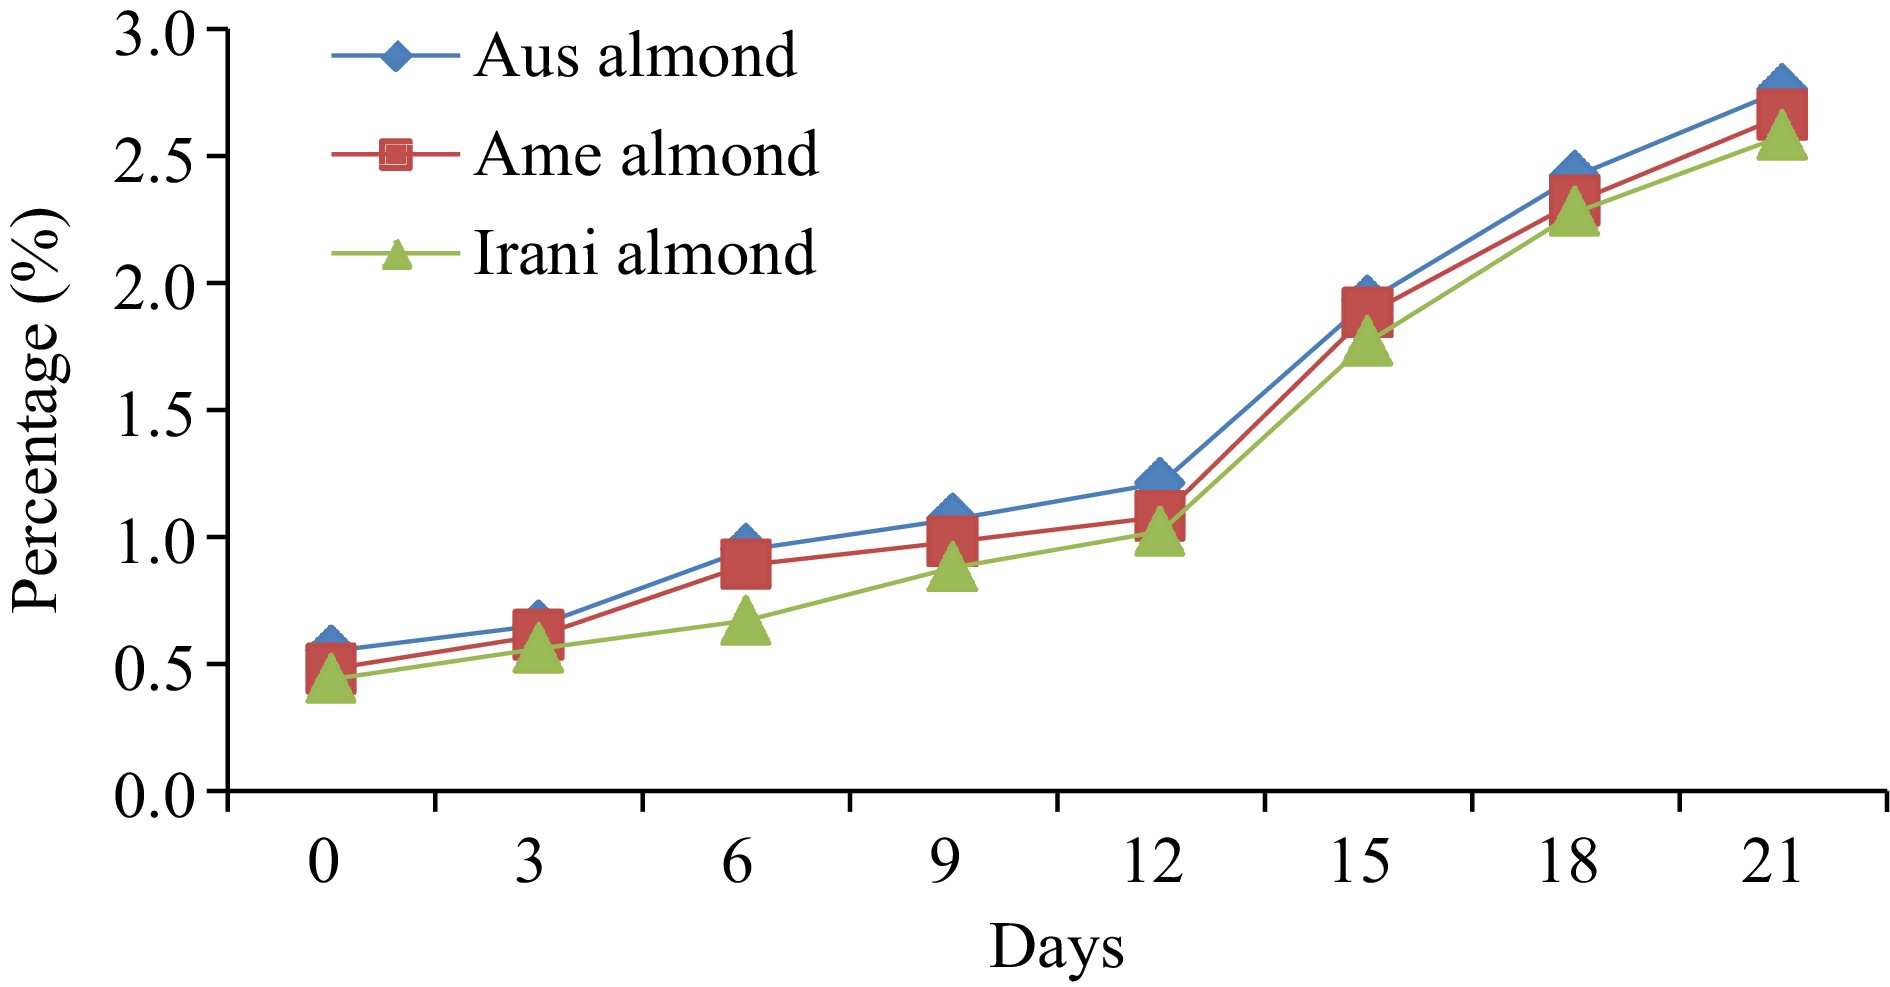
Figure 1.
Changes in FFA values of almond oil during forced oxidation of 21 d.
-
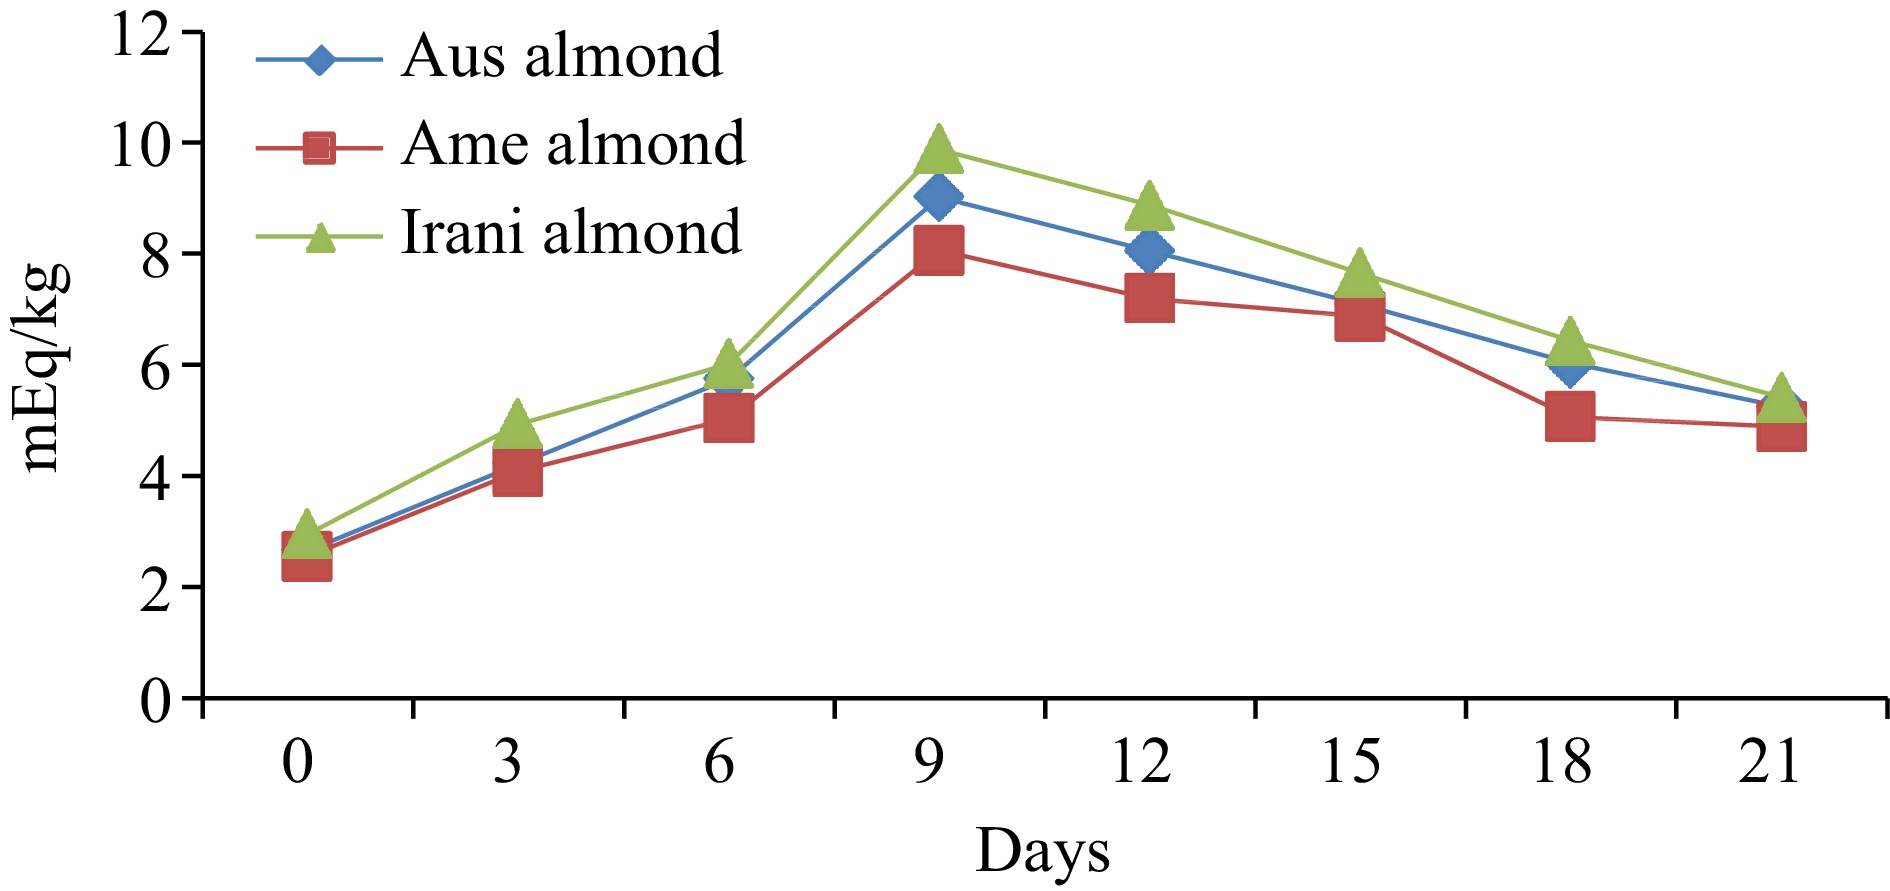
Figure 2.
Changes in PV values of almond oil during forced oxidation of 21 d.
-
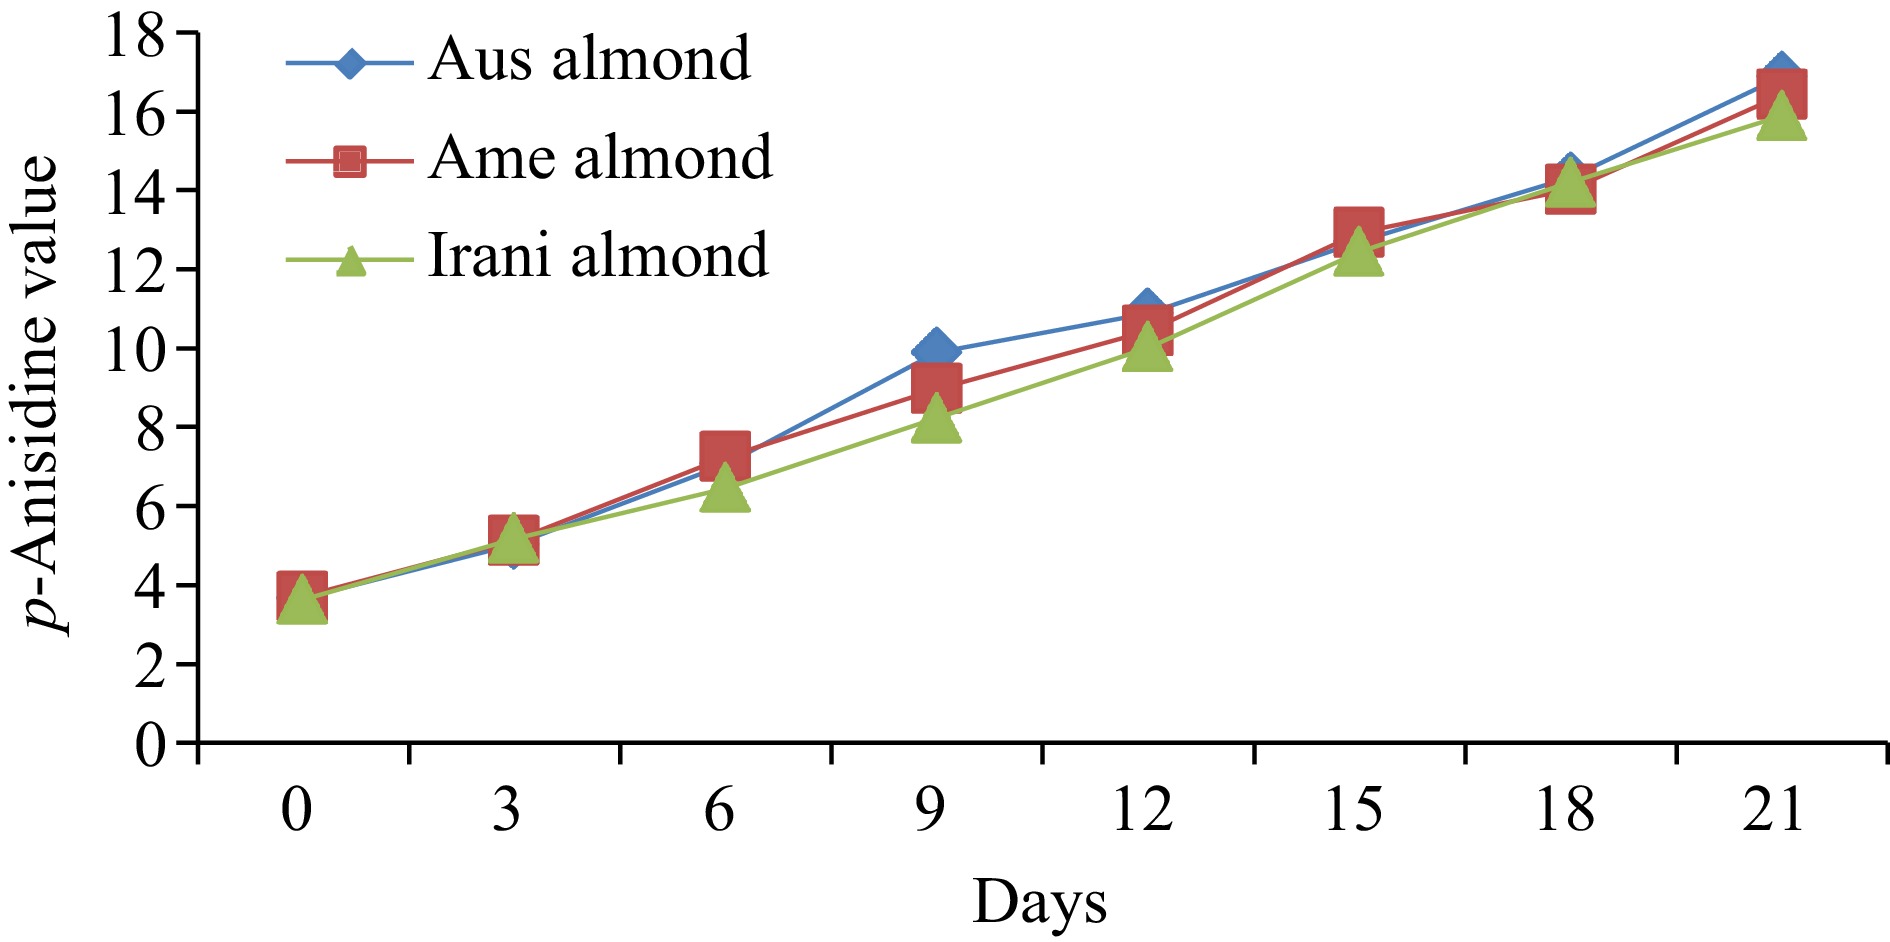
Figure 3.
Changes in p-AV values of almond oil during forced oxidation of 21 d.
-
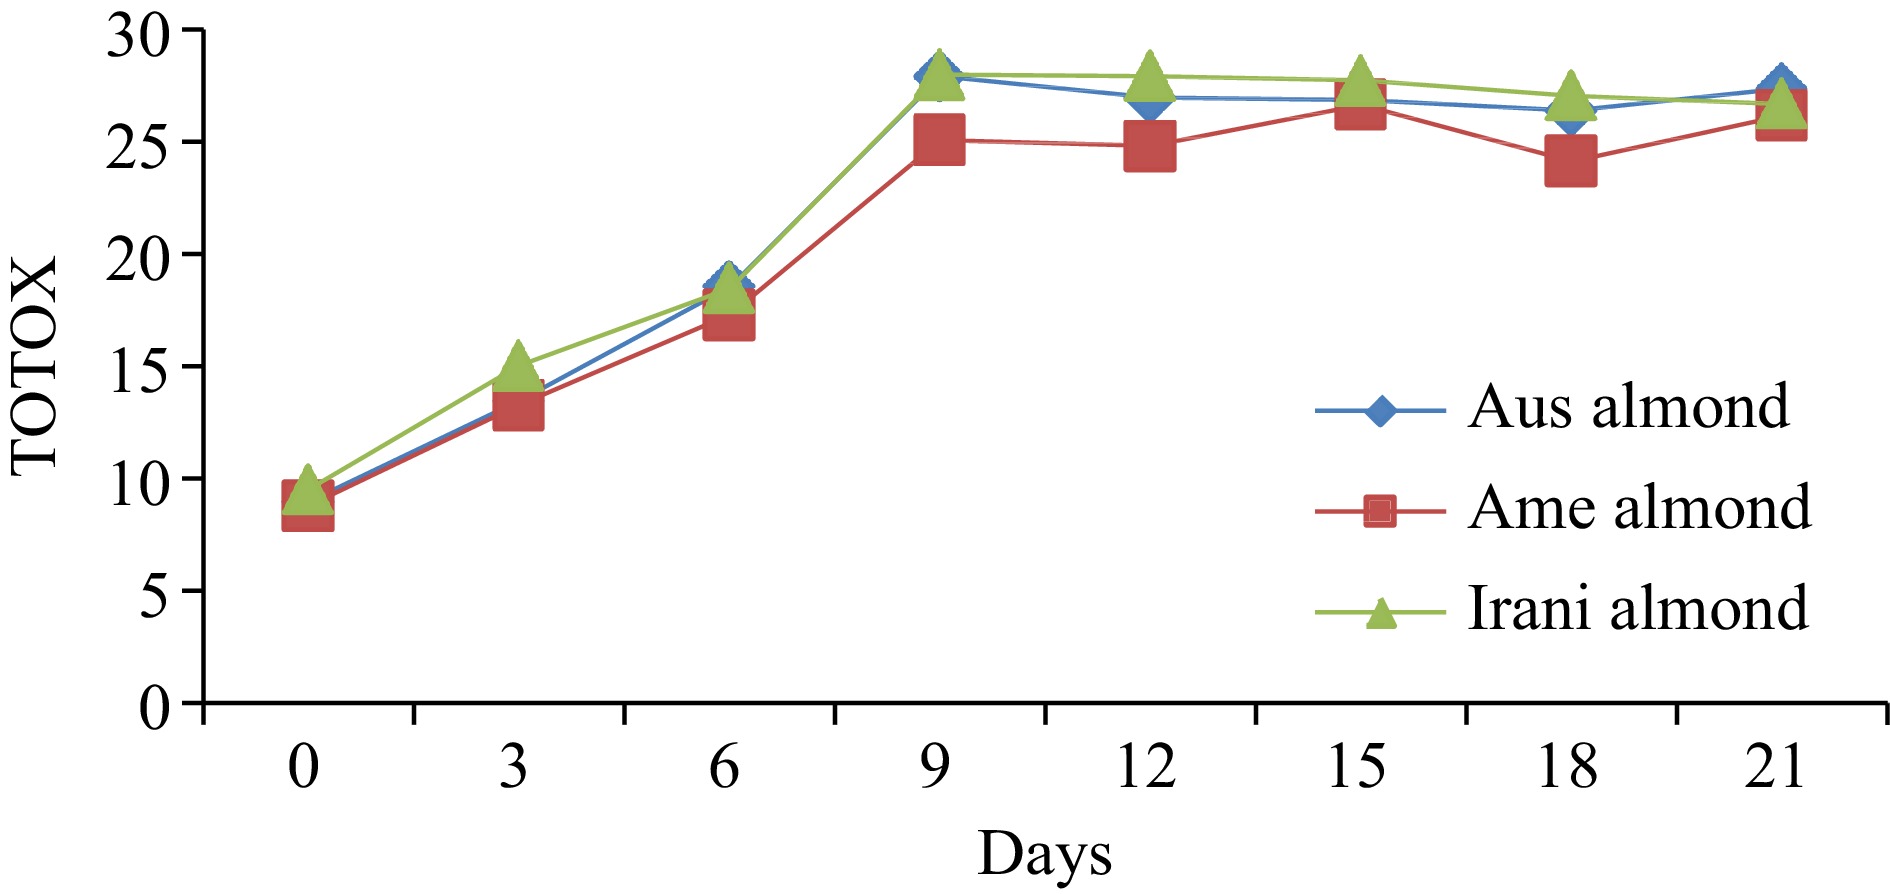
Figure 4.
Changes in TOTOX values of almond oil during forced oxidation of 21 d.
-
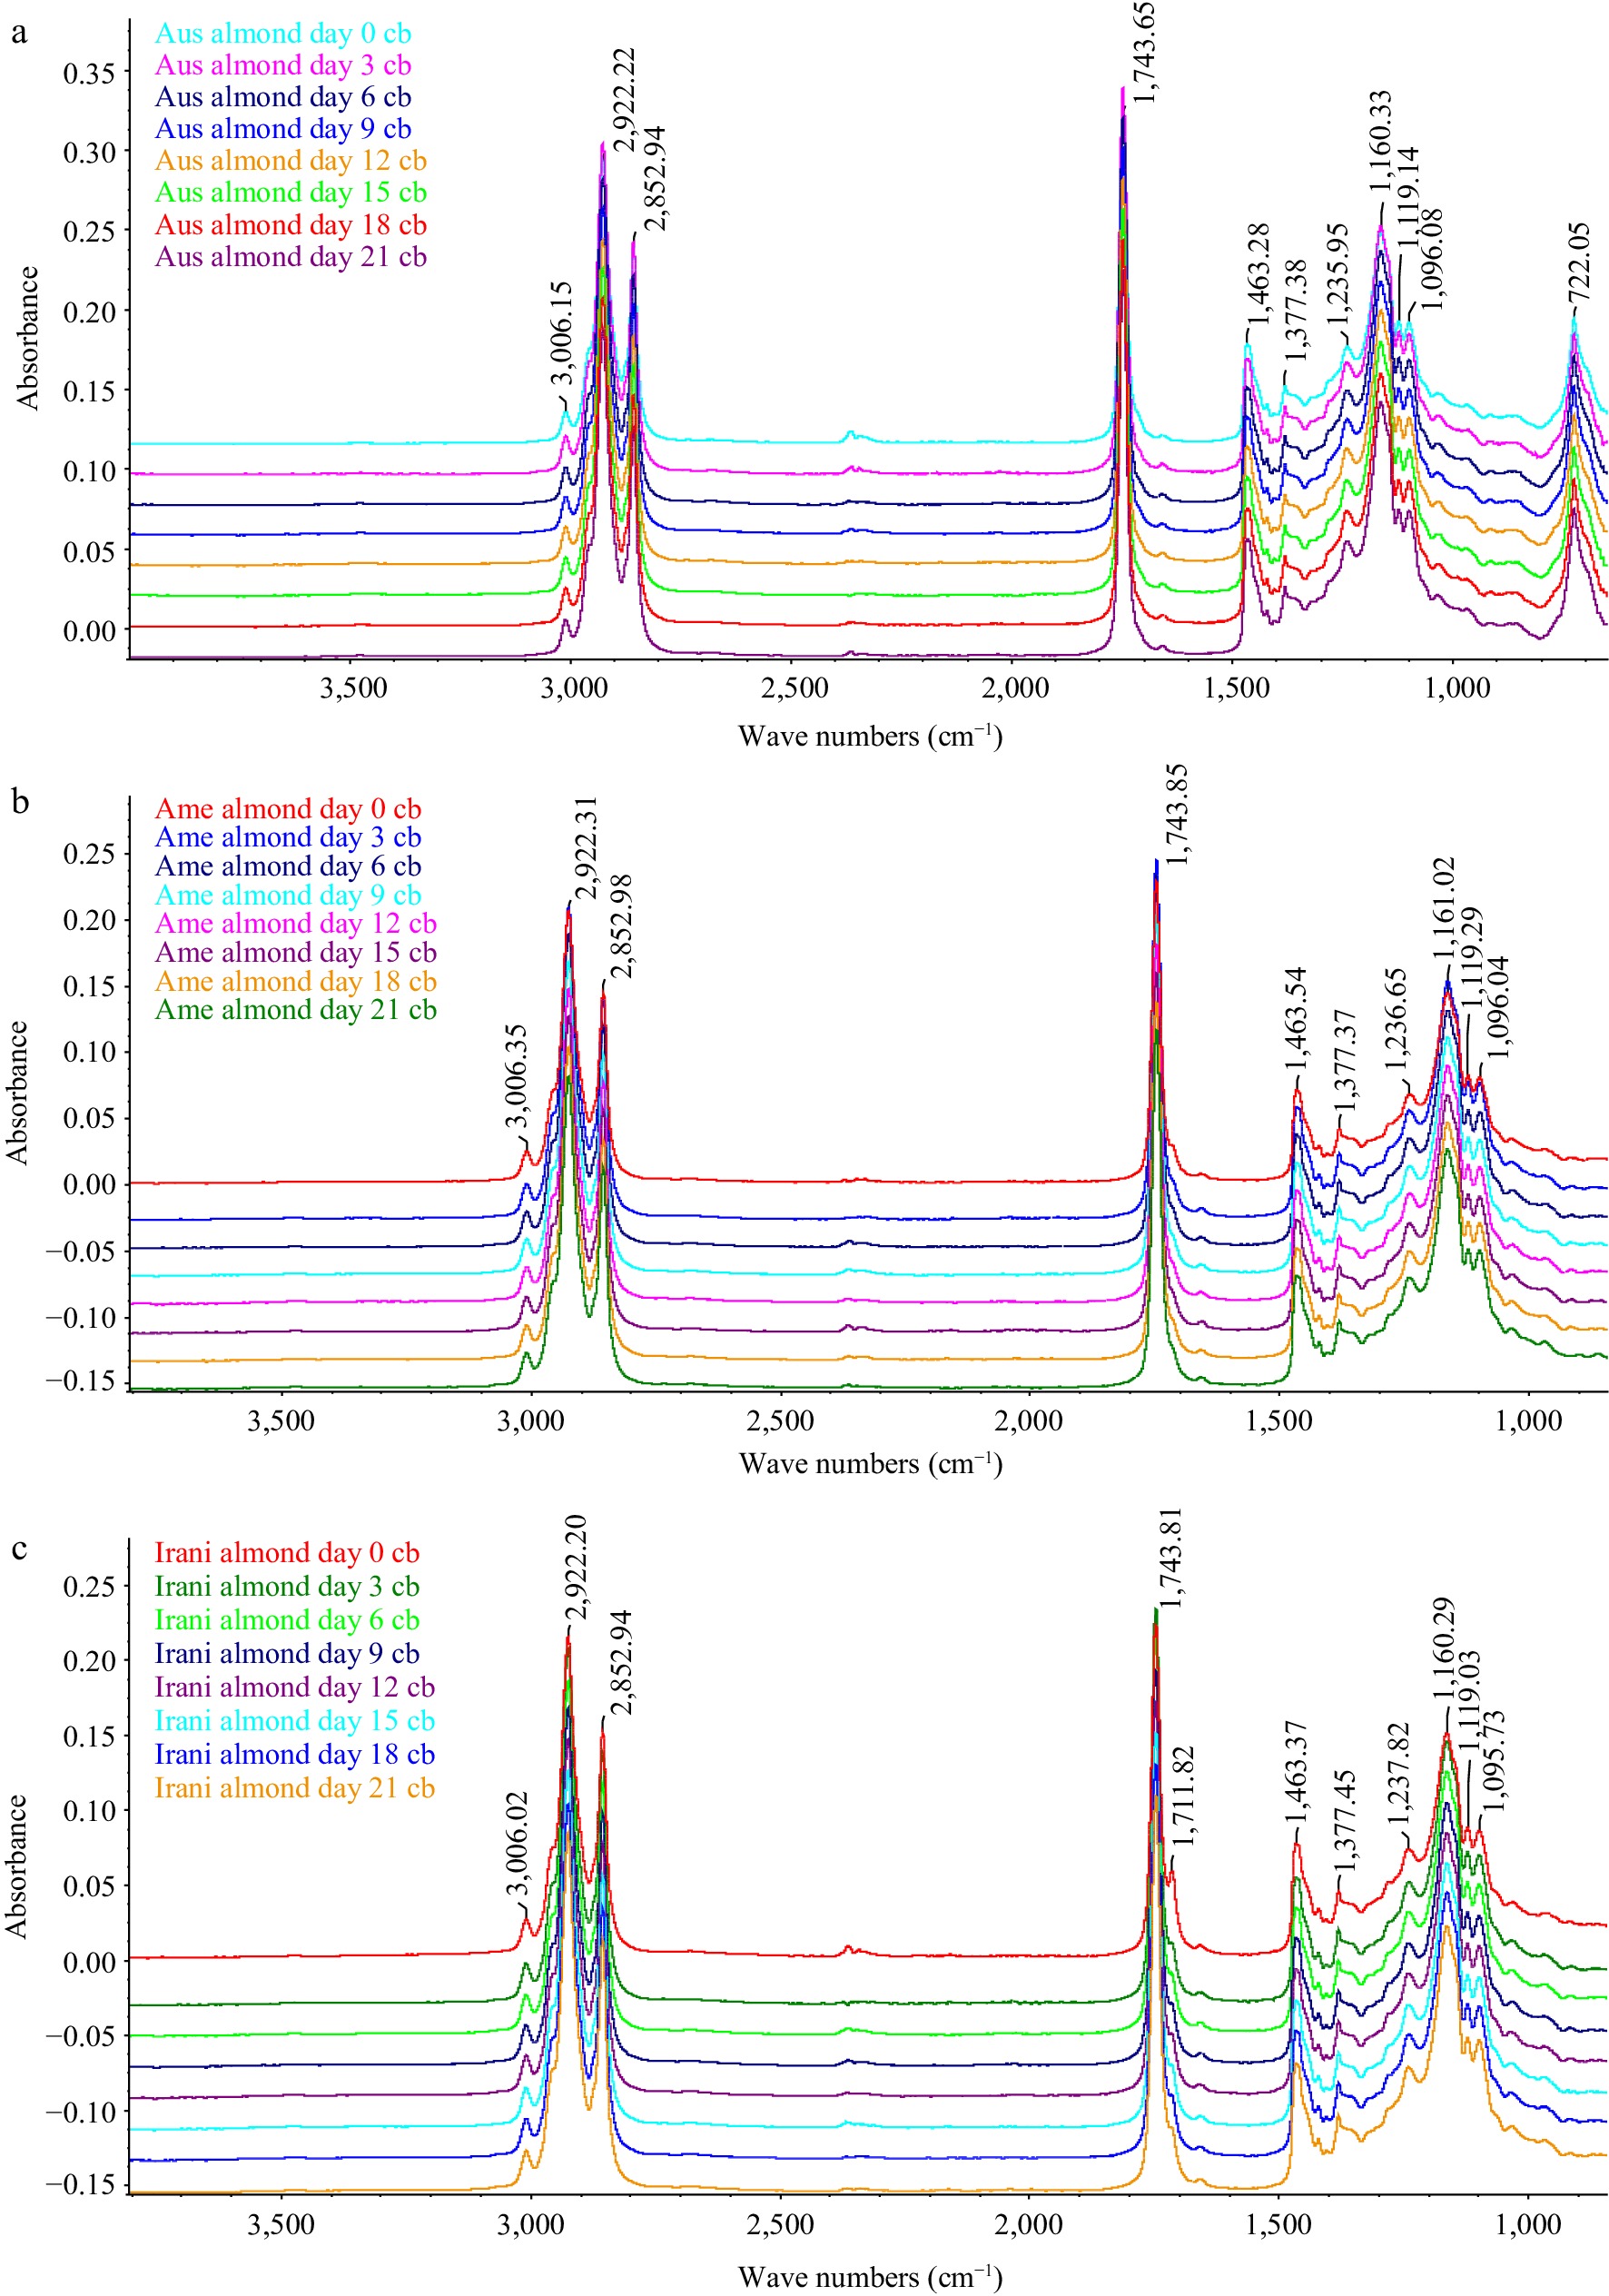
Figure 5.
FT-IR group spectra (a) Australian, (b) American and (c) Iranian almond kernel oil samples at different days.
-
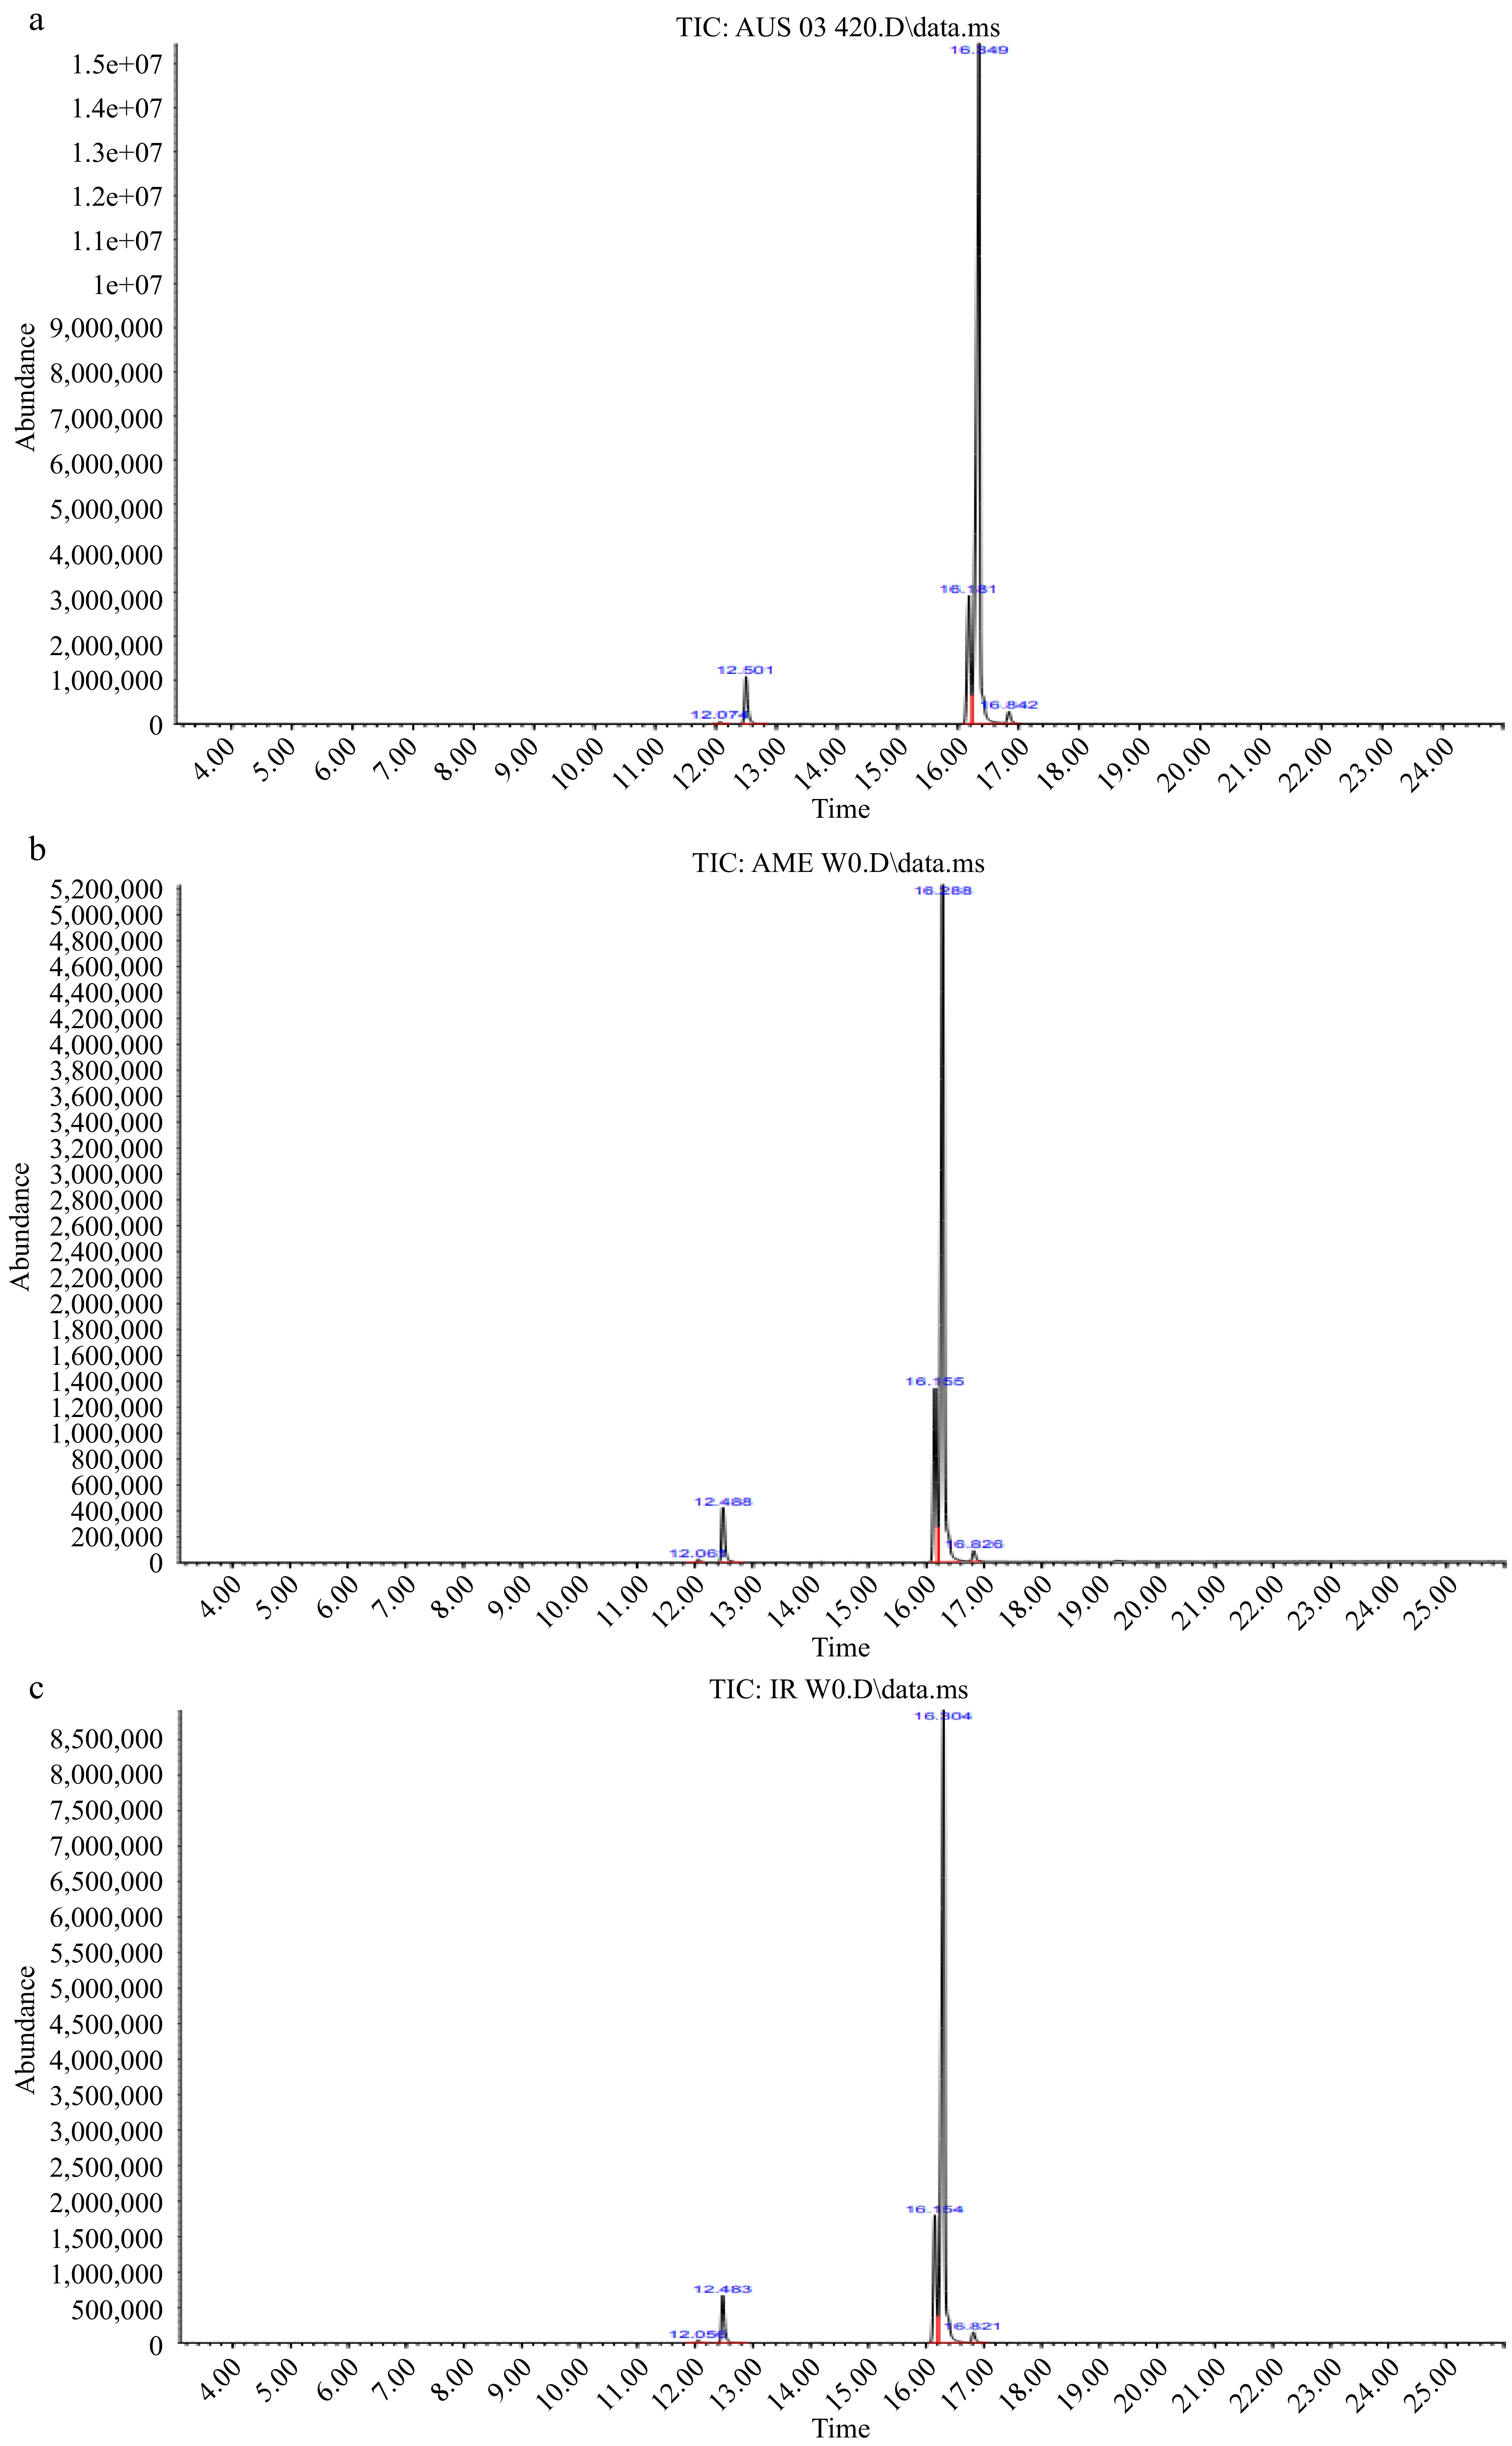
Figure 6.
Representative GC-MS chromatograms of fresh almond kernel oils (a) Australian, (b) American and (c) Iranian.
-
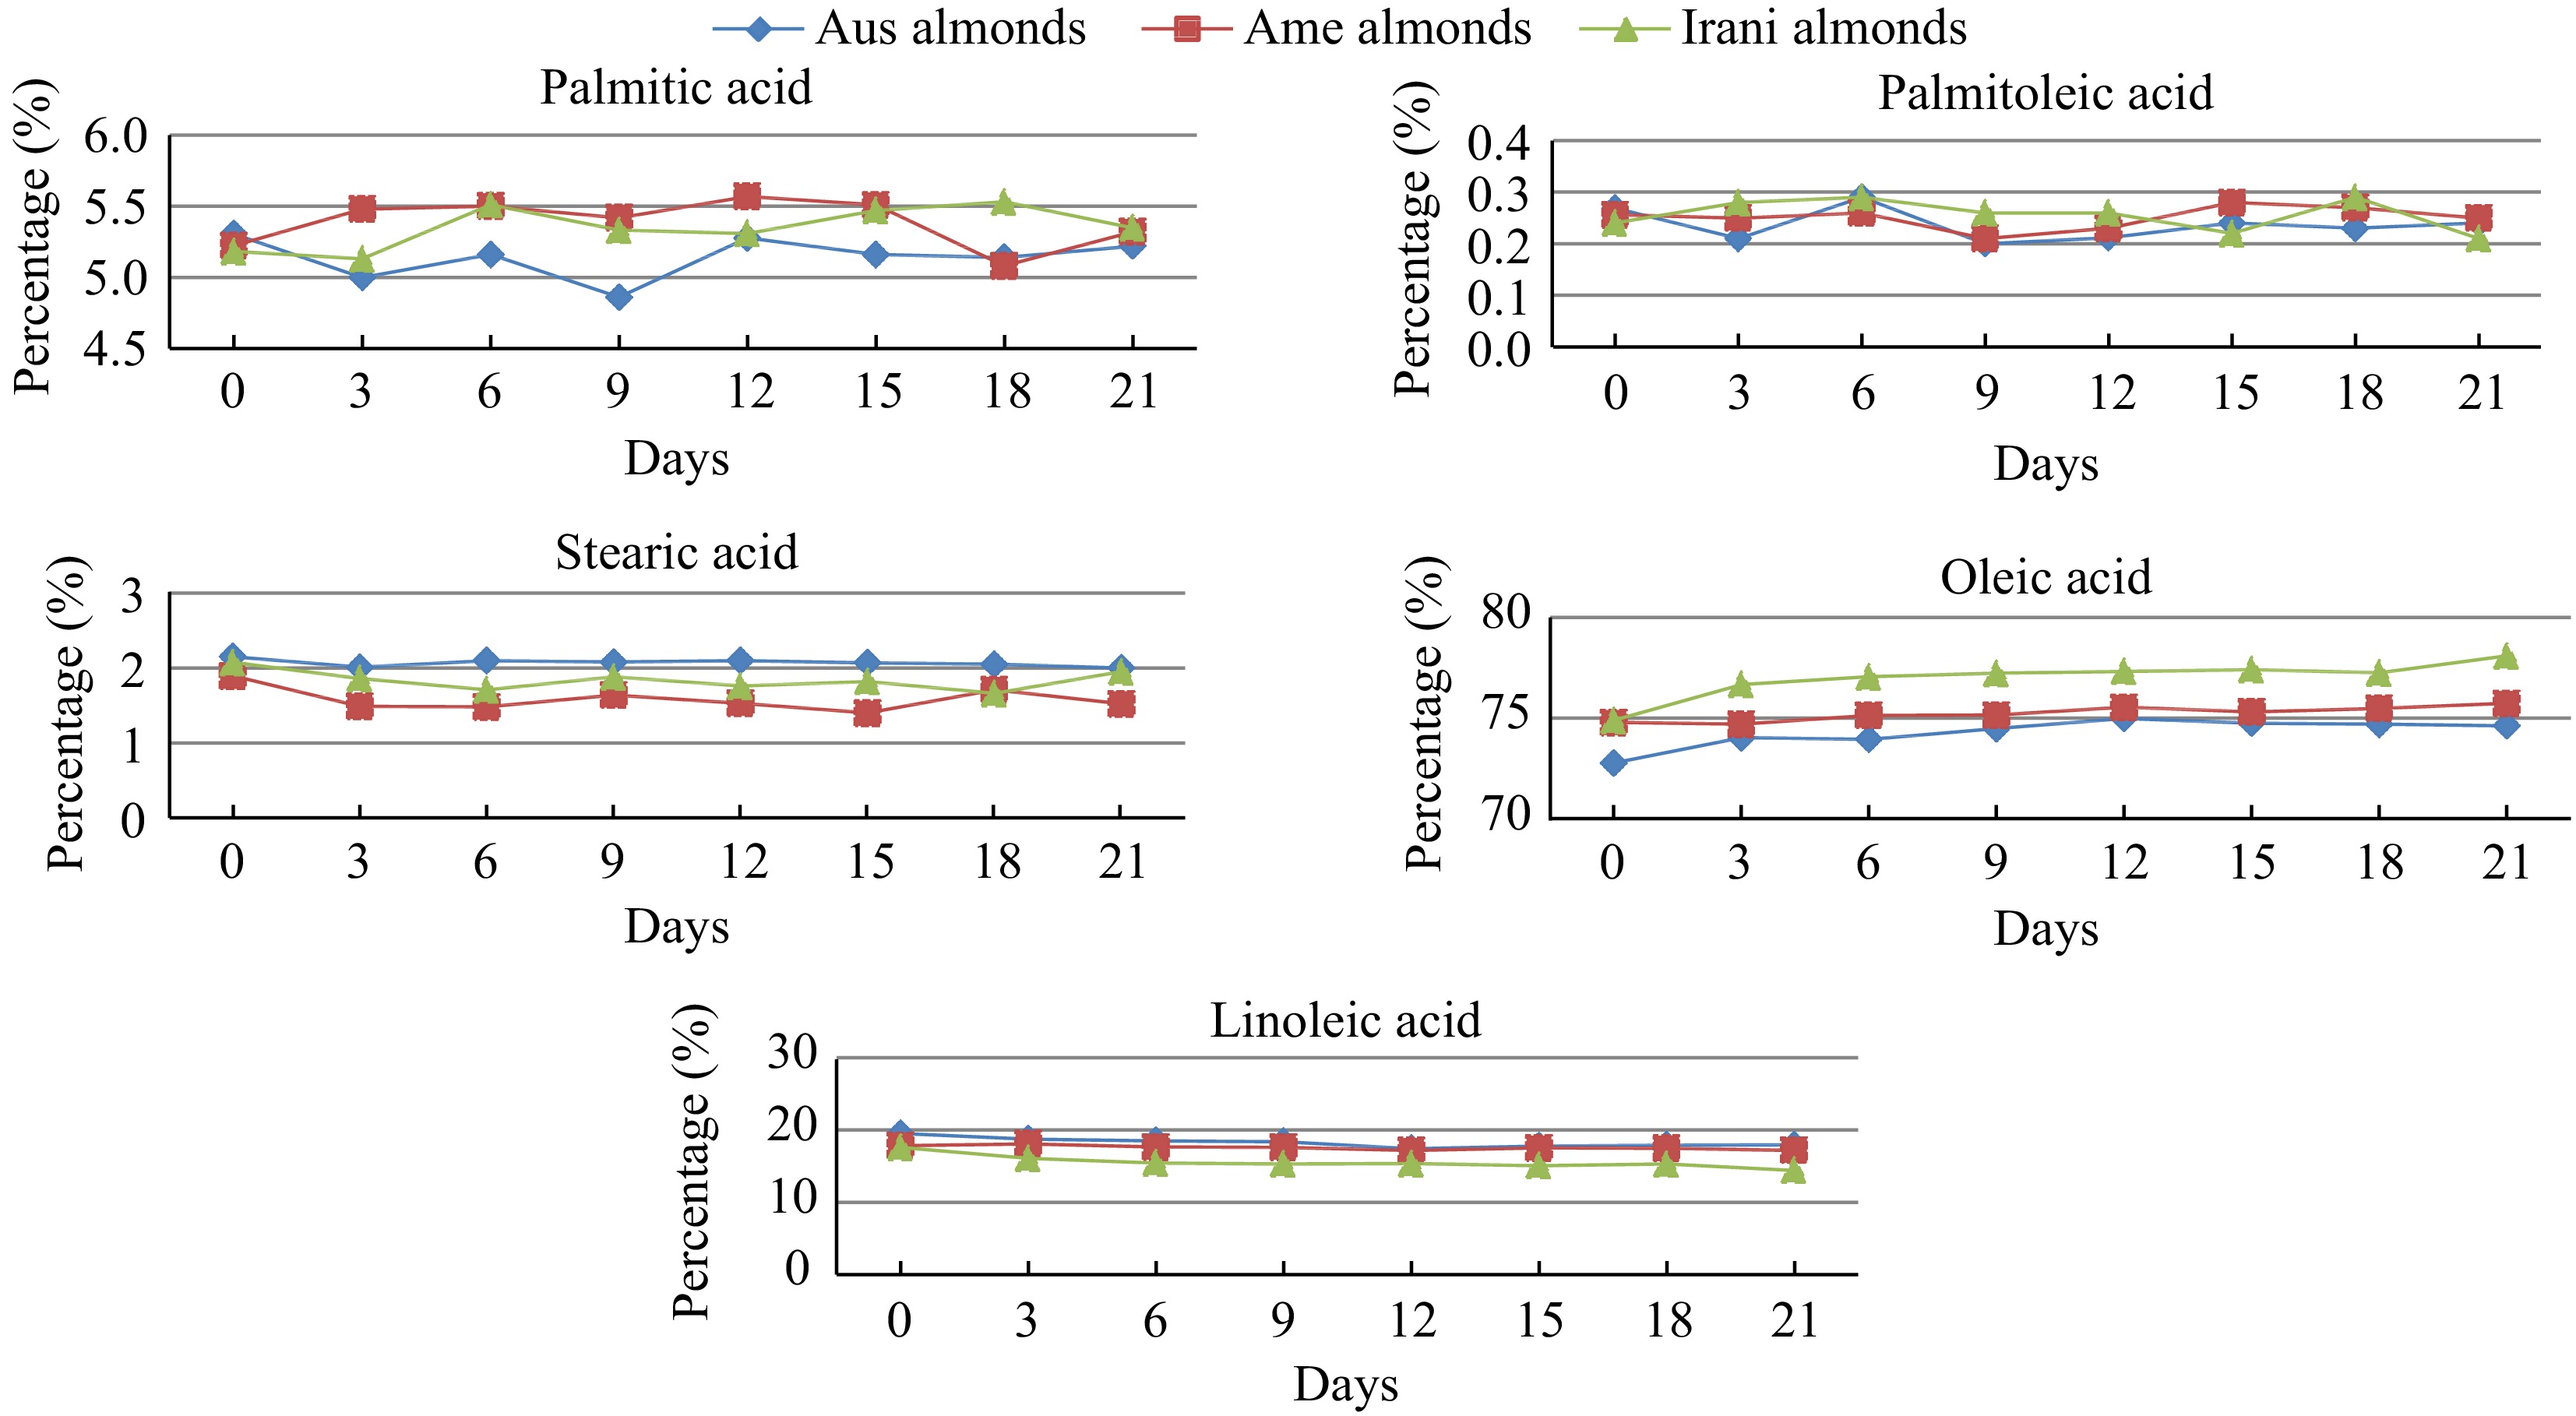
Figure 7.
Changes in the fatty acid profile (palmitic, palmitoleic, stearic, oleic, and linoleic acid) of Australian, American, and Iranian almonds during forced oxidation at 60 °C.
-
Parameters Samples
Almond oilDays of oxidation (60 °C) 0 3 6 9 12 15 18 21 FFA (%) Australian 0.55 ± 0.02h 0.65 ± 0.03g 0.95 ± 0.04f 1.07 ± 0.04e 1.21 ± 0.05d 1.93 ± 0.08c 2.42 ± 0.09b 2.76 ± 0.11a American 0.48 ± 0.02h 0.61 ± 0.03g 0.89 ± 0.04f 0.98 ± 0.05e 1.08 ± 0.04d 1.88 ± 0.05c 2.32 ± 0.07b 2.66 ± 0.08a Iranian 0.44 ± 0.02h 0.56 ± 0.03g 0.67 ± 0.03f 0.88 ± 0.04e 1.02 ± 0.05d 1.77 ± 0.08c 2.28 ± 0.09b 2.58 ± 0.10a PV (meq·kg−1) Australian 2.66 ± 0.12h 4.22 ± 0.16g 5.75 ± 0.24e 9.02 ± 0.37a 8.05 ± 0.36b 7.09 ± 0.25c 6.03 ± 0.21d 5.25 ± 0.17f American 2.55 ± 0.11h 4.08 ± 0.17g 5.03 ± 0.21e 8.06 ± 0.31a 7.19 ± 0.29b 6.87 ± 0.21c 5.06 ± 0.23d 4.88 ± 0.15f Iranian 2.95 ± 0.13h 4.93 ± 0.19g 6.02 ± 0.26e 9.88 ± 0.36a 8.87 ± 0.35b 7.65 ± 0.27c 6.43 ± 0.28d 5.41 ± 0.17f p-anisidine (p-AV) Australian 3.67 ± 0.13h 5.03 ± 0.19g 7.06 ± 0.31f 9.89 ± 0.34e 10.88 ± 0.39d 12.71 ± 0.42c 14.33 ± 0.61b 16.88 ± 0.71a American 3.71 ± 0.14h 5.13 ± 0.21g 7.24 ± 0.31f 8.97 ± 0.32e 10.44 ± 0.28d 12.93 ± 0.31c 14.02 ± 0.59b 16.43 ± 0.66a Iranian 3.63 ± 0.12h 5.18 ± 0.22g 6.45 ± 0.27f 8.23 ± 0.31e 10.02 ± 0.42d 12.44 ± 0.47c 14.21 ± 0.35b 15.89 ± 0.44a TOTOX Australian 8.99 ± 0.27h 13.47 ± 0.51g 18.56 ± 0.76f 27.93 ± 0.91a 26.98 ± 1.28c 26.89 ± 1.03d 26.39 ± 1.06e 27.38 ± 1.14b American 8.81 ± 0.31h 13.29 ± 0.44g 17.30 ± 0.62f 25.09 ± 0.89c 24.82 ± 0.95d 26.67 ± 1.31a 24.14 ± 1.02e 26.19 ± 1.07b Iranian 9.53 ± 0.25h 15.04 ± 0.54g 18.49 ± 0.72f 27.99 ± 0.94a 27.94 ± 1.02b 27.74 ± 1.16c 27.07 ± 1.04d 26.71 ± 0.98e The values provided in the table are the mean values of triplicate analysis with standard deviation. Means followed by different superscripts in the same column differ significantly (Tukey's test at 0.05 p-level the population are significantly different). Table 1.
Comparative results of (FFA, PV, p-AV, TOTOX) during 21 d forced oxidation of kernels oil (almond).
-
Samples Fatty
acidsDays of oxidation (60 °C) 0 3 6 9 12 15 18 21 Australian almond oil C16:0 5.306 ± 0.21b 5.000 ± 0.19h 5.160 ± 0.21f 4.860 ± 0.19a 5.277 ± 0.23c 5.161 ± 0.18e 5.140 ± 0.22g 5.220 ± 0.23d C16:1 0.269 ± 0.01b 0.210 ± 0.01g 0.290 ± 0.02a 0.200 ± 0.01h 0.212 ± 0.02f 0.240 ± 0.02d 0.230 ± 0.02e 0.241 ± 0.02c C18:0 2.152 ± 0.09a 2.010 ± 0.08g 2.100 ± 0.06b 2.080 ± 0.06d 2.099 ± 0.05c 2.070 ± 0.06e 2.050 ± 0.05f 2.000 ± 0.05h C18:1 72.765 ± 2.76h 74.020 ± 3.23f 73.940 ± 2.84g 74.473 ± 3.03e 74.985 ± 3.14a 74.750 ± 3.19b 74.690 ± 2.96c 74.620 ± 3.02d C18:2 19.508 ± 0.68a 18.760 ± 0.67b 18.510 ± 0.56c 18.388 ± 0.61d 17.426 ± 0.56h 17.780 ± 0.55g 17.890 ± 0.51g 17.920 ± 0.54e American almond oil C16:0 5.223 ± 0.21g 5.480 ± 0.23e 5.501 ± 0.24c 5.419 ± 0.20d 5.569 ± 0.21a 5.509 ± 0.20b 5.080 ± 0.18h 5.320 ± 0.19f C16:1 0.256 ± 0.01d 0.251 ± 0.02e 0.260 ± 0.02c 0.210 ± 0.01h 0.230 ± 0.02g 0.280 ± 0.02a 0.270 ± 0.02b 0.250 ± 0.01f C18:0 1.894 ± 0.05a 1.490 ± 0.05f 1.480 ± 0.05g 1.640 ± 0.07c 1.530 ± 0.07d 1.400 ± 0.06h 1.710 ± 0.08b 1.520 ± 0.07e C18:1 74.775 ± 2.62g 74.690 ± 2.83h 75.138 ± 3.12f 75.142 ± 3.05e 75.532 ± 2.91b 75.312 ± 3.23d 75.480 ± 3.04c 75.730 ± 3.12a C18:2 17.852 ± 0.69b 18.090 ± 0.71a 17.622 ± 0.68c 17.588 ± 0.59d 17.138 ± 0.57h 17.498 ± 0.48e 17.460 ± 0.60f 17.180 ± 0.59g Iranian almond oil C16:0 5.181 ± 0.19g 5.130 ± 0.23h 5.510 ± 0.23b 5.331 ± 0.21e 5.309 ± 0.20f 5.470 ± 0.24c 5.531 ± 0.25a 5.349 ± 0.22d C16:1 0.240 ± 0.01f 0.280 ± 0.02c 0.290 ± 0.02b 0.260 ± 0.01e 0.261 ± 0.01d 0.220 ± 0.01g 0.291 ± 0.02a 0.210 ± 0.02h C18:0 2.074 ± 0.08a 1.860 ± 0.12d 1.710 ± 0.11g 1.880 ± 0.09c 1.760 ± 0.09f 1.820 ± 0.08e 1.660 ± 0.07h 1.950 ± 0.11b C18:1 74.891 ± 3.01h 76.670 ± 3.42g 77.050 ± 3.55f 77.218 ± 3.61e 77.322 ± 3.53c 77.410 ± 3.46b 77.248 ± 3.08d 78.082 ± 3.14a C18:2 17.614 ± 0.59a 16.060 ± 0.48b 15.440 ± 0.46c 15.312 ± 0.47e 15.348 ± 0.39d 15.080 ± 0.41f 15.272 ± 0.51g 14.409 ± 0.38h The values provided in the table are the mean values of triplicate analysis with standard deviation. Means followed by different superscripts in the same column differ significantly (Tukey’s test at 0.05 p-Level the population are significantly different). Table 2.
Fatty acid composition of (Australian, American and Iranian) almond kernel oil during forced oxidation of 21 d.
Figures
(7)
Tables
(2)