-
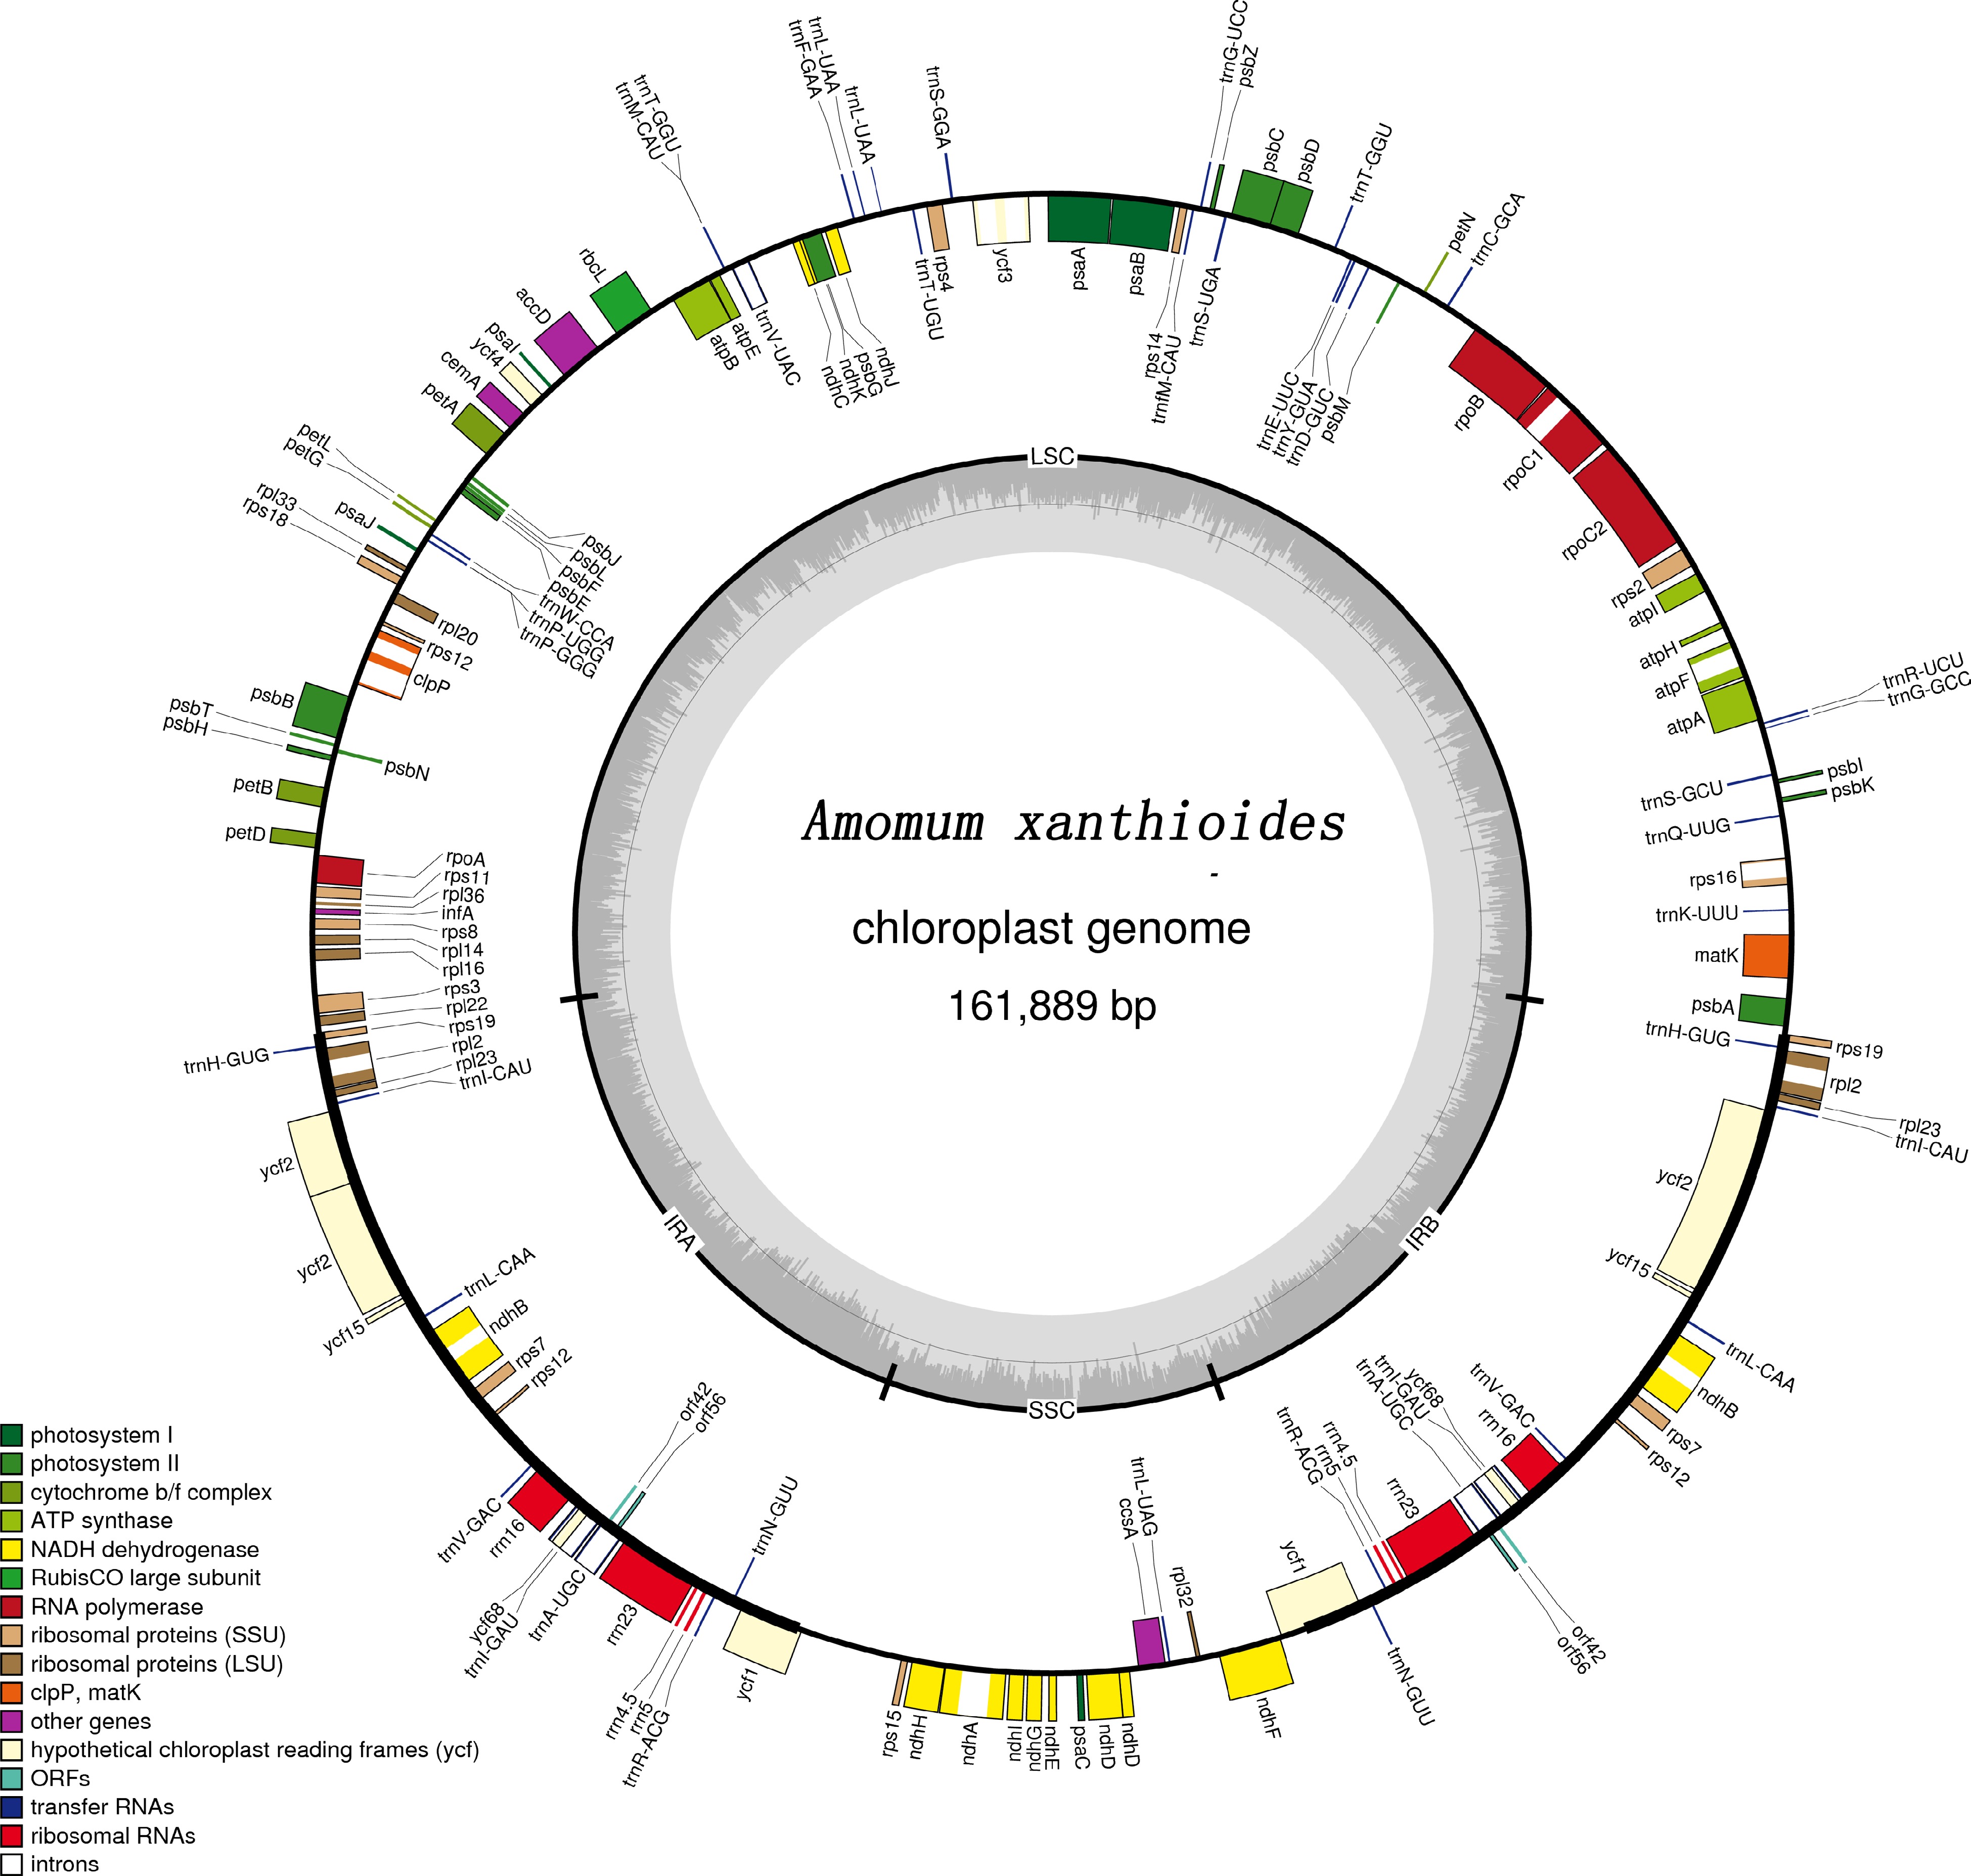
Figure 1.
Gene map of the complete chloroplast genome of A. xanthioides. Genes located on the inside and outside of the circle are transcribed clockwise and counterclockwise, respectively. The inner circle indicates the GC and AT content.
-
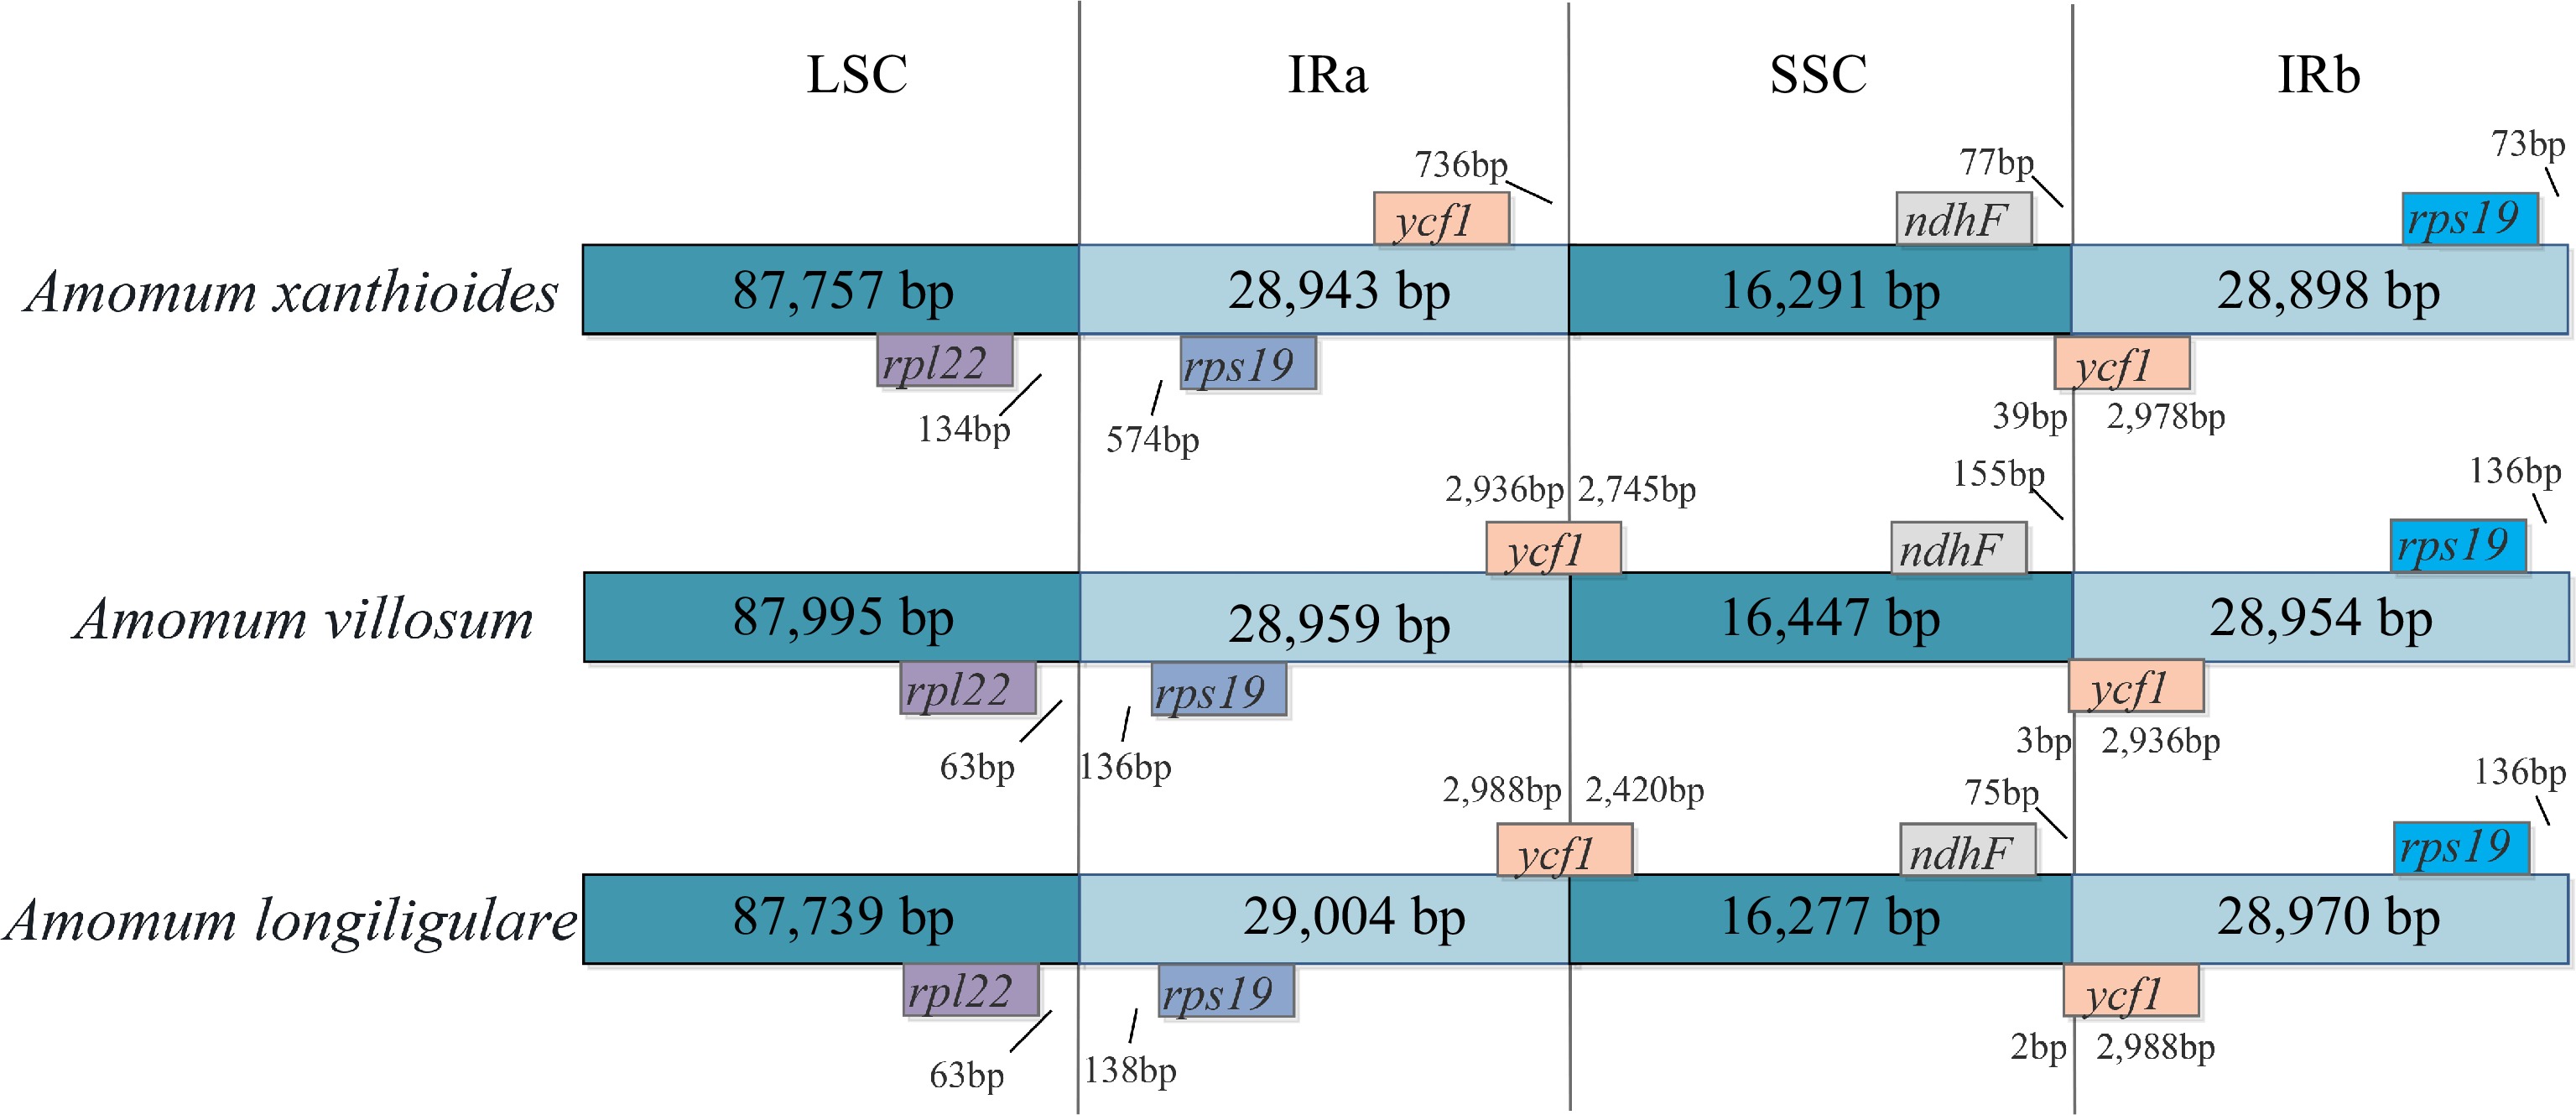
Figure 2.
Comparison of the borders of the LSC, SSC, and IR regions in the genomes of the three Amomum species. Ψ indicates pseudogenes. The number above the gene feature indicates the distance between the ends of genes and border sites. Figure is not drawn to scale.
-
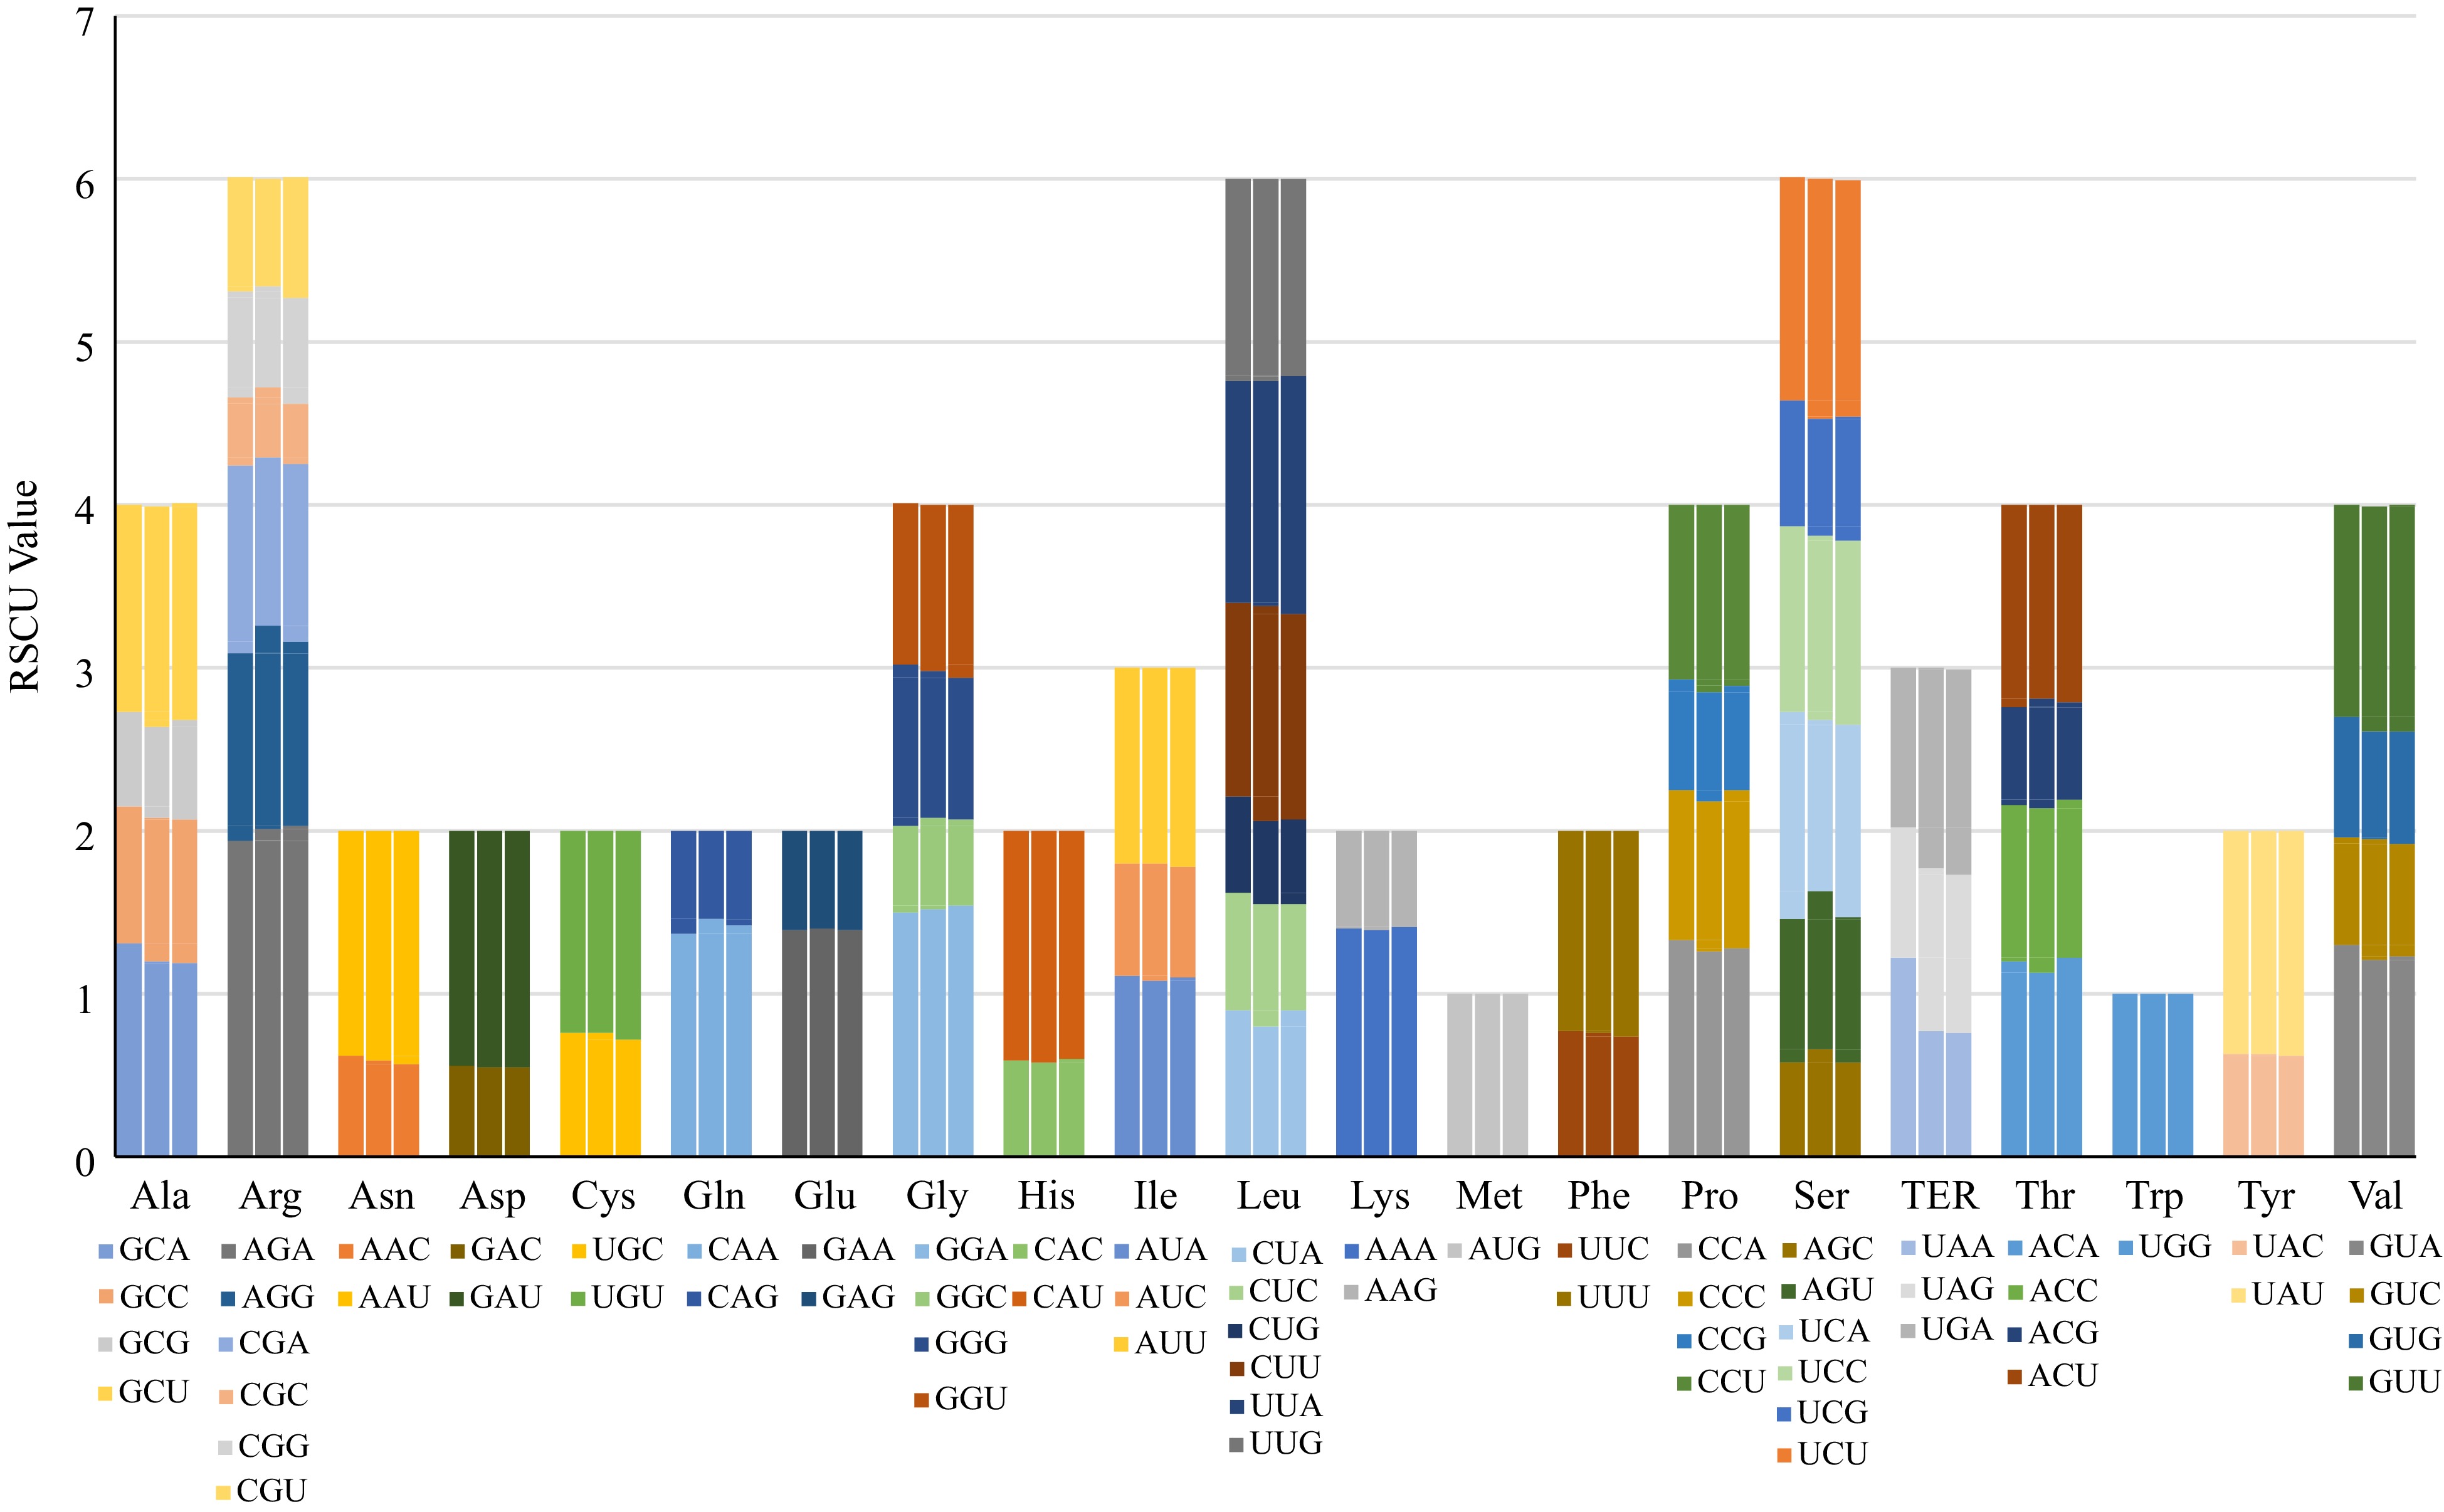
Figure 3.
Codon content of 20 amino acids and stop codons in all protein-coding genes of the chloroplast genomes. The histogram (as read from left to right) shows the different numbers of codons found in A. xanthioides, A. villosum and A. longiligulare.
-
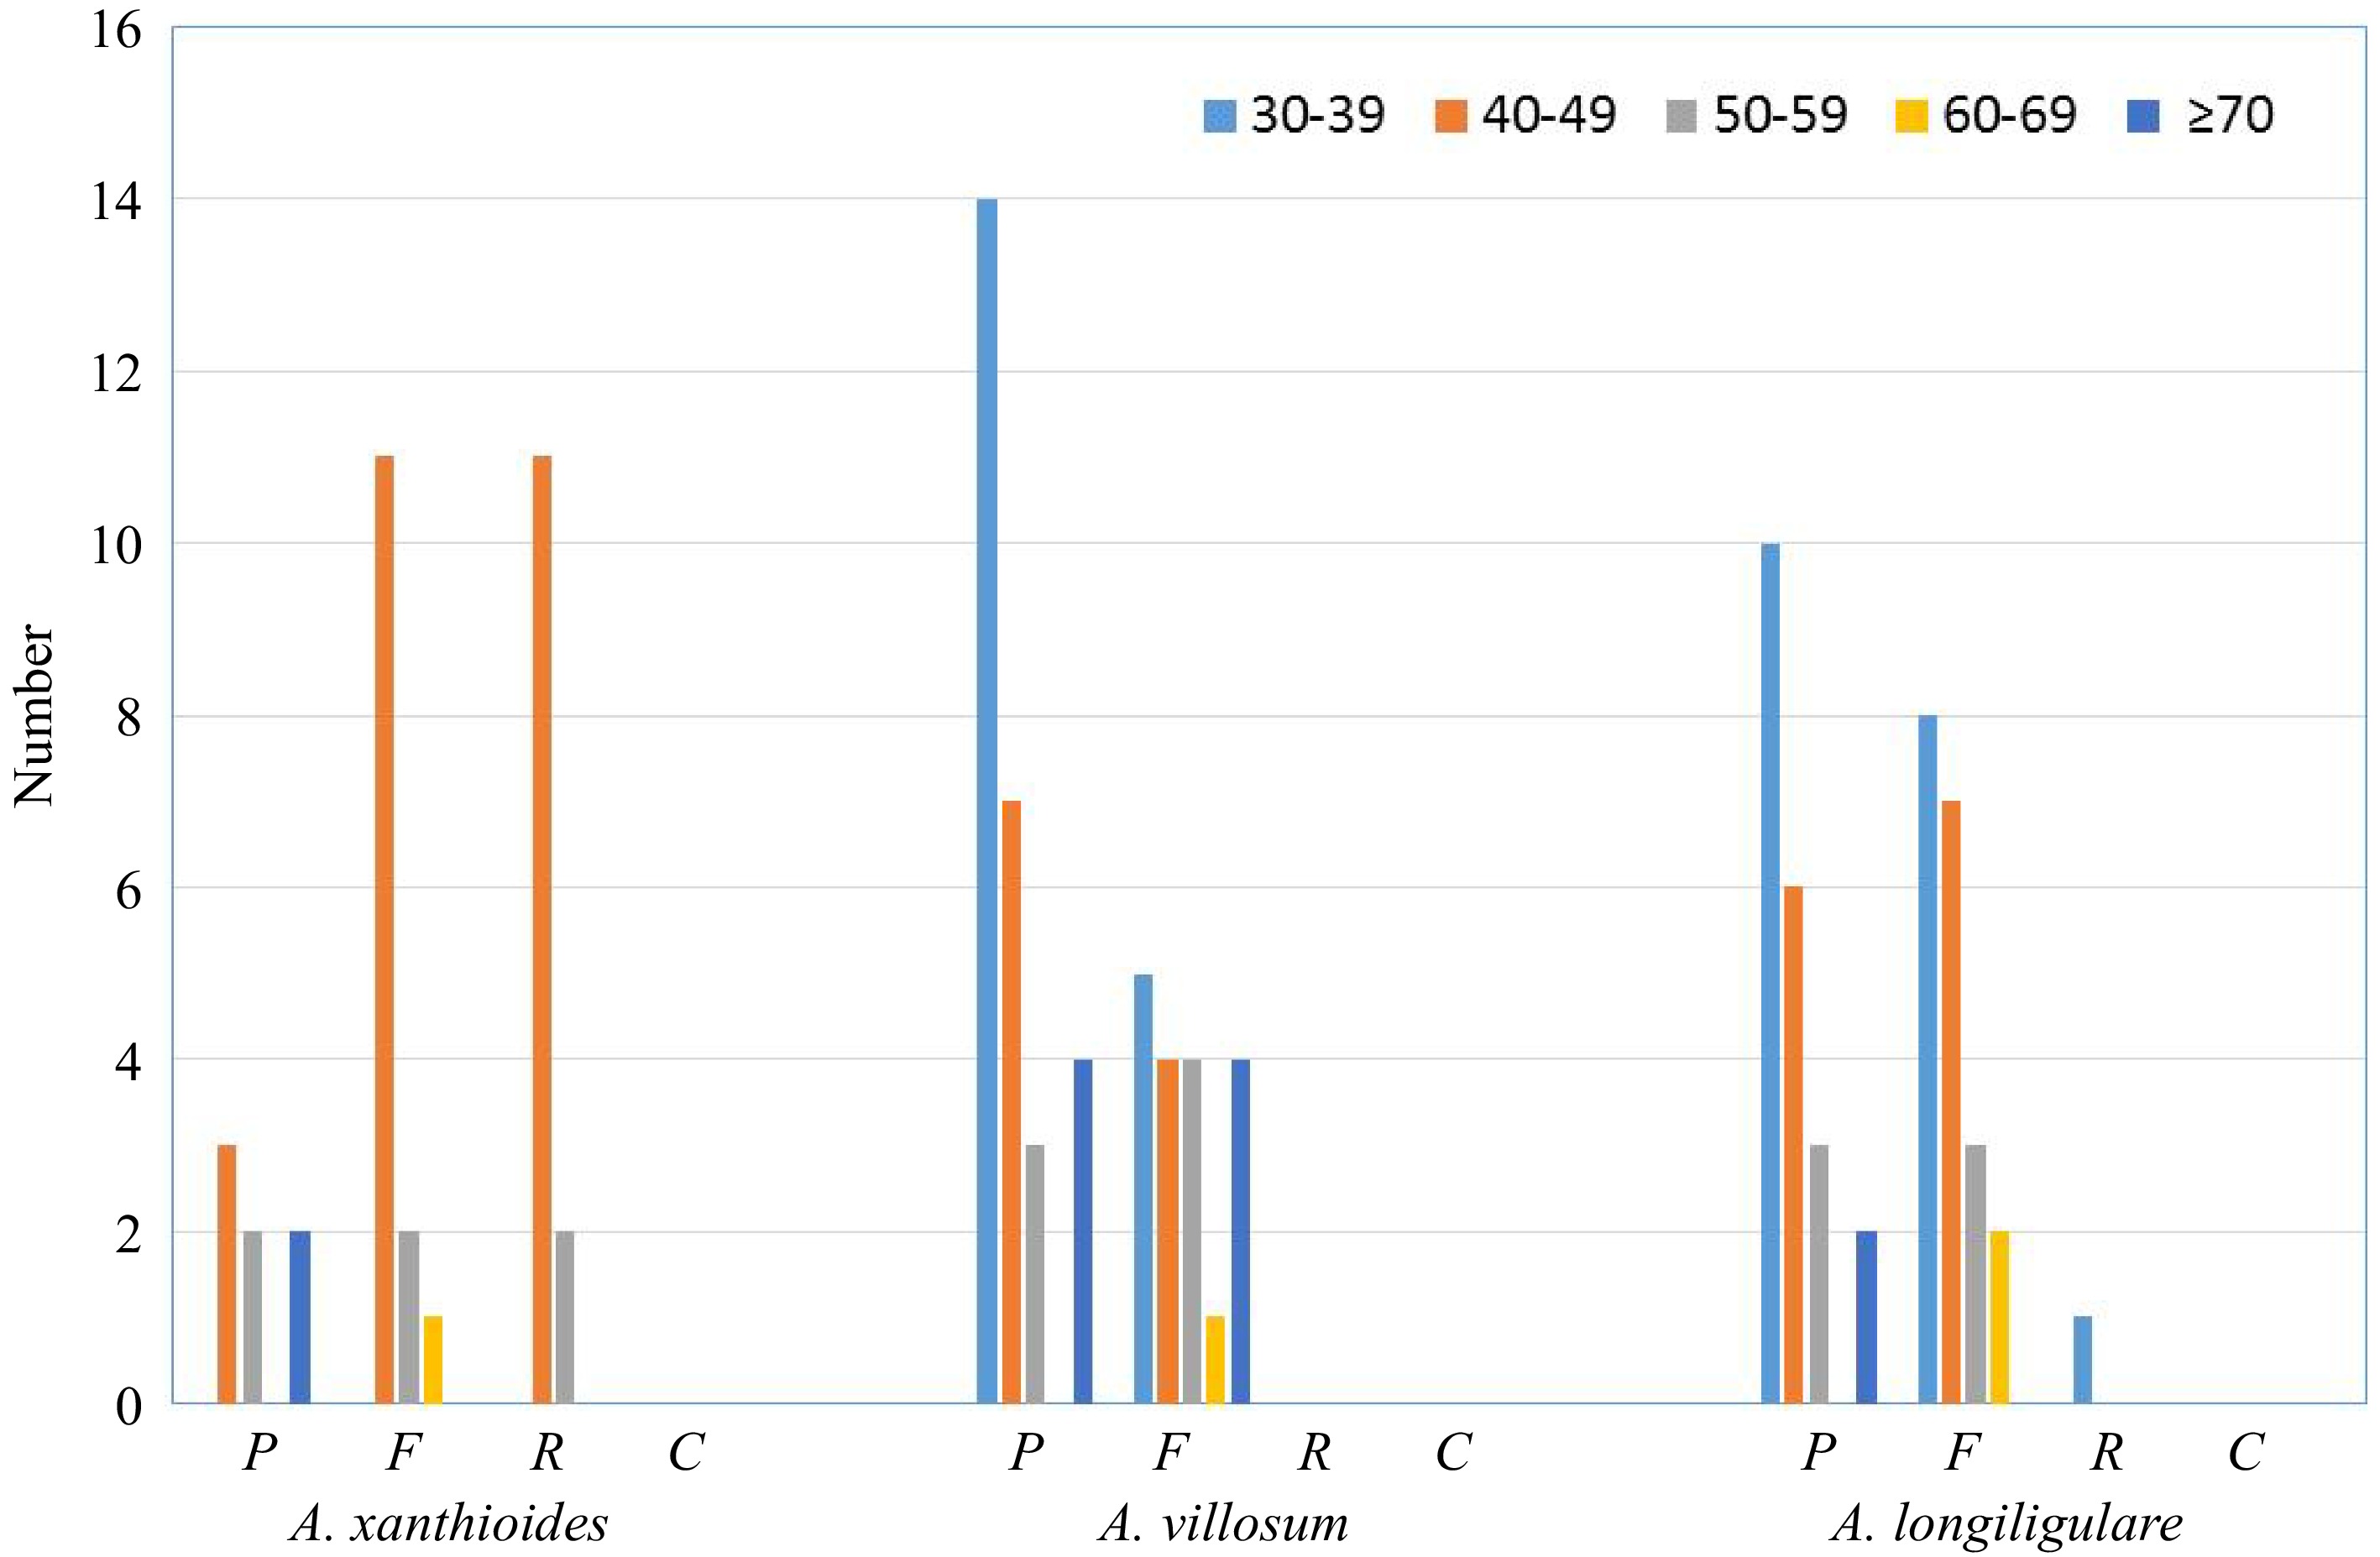
Figure 4.
Repeat sequences in three Amomum chloroplast genomes. REPuter was used to identify repeat sequences with length ≥ 30 bp and sequences for which ≥ 90% were identified in chloroplast genomes. Different letters are used to indicate forward repeats (F), palindromic repeats (P), reverse repeats (R), and complementary repeats (C). Repeats of different lengths are indicated in different colors.
-
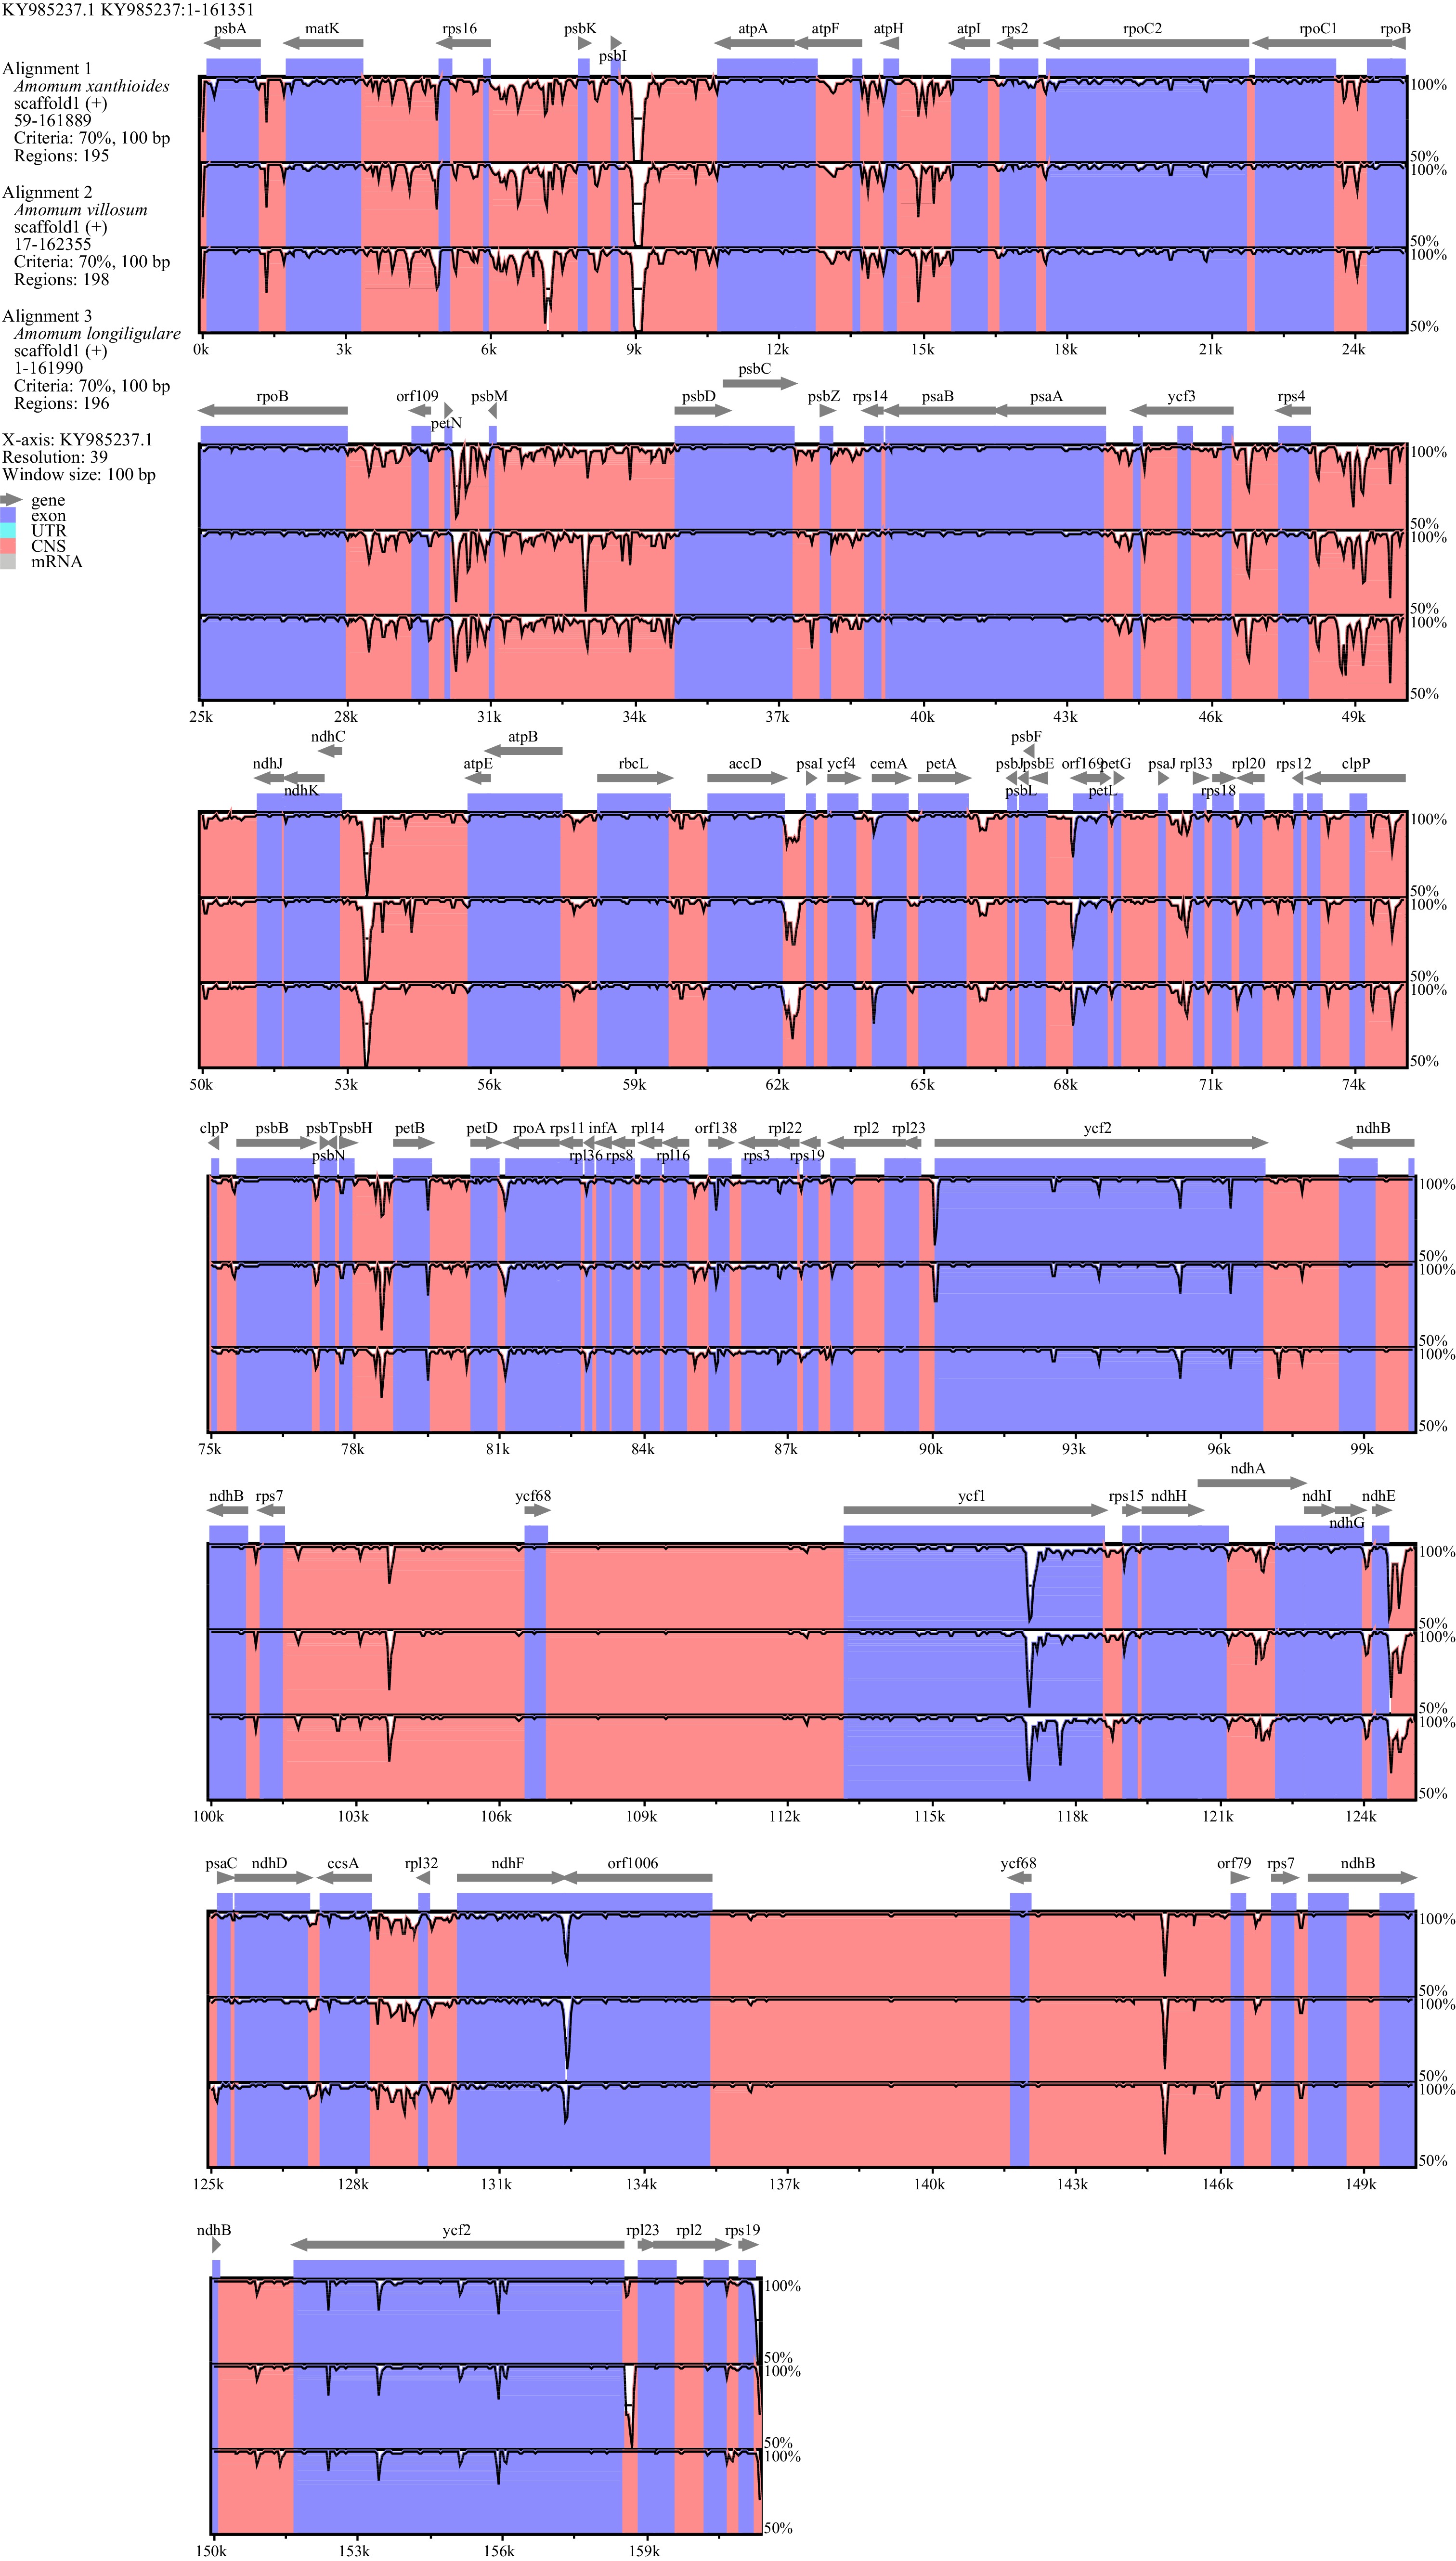
Figure 5.
Sequence alignment in the chloroplast genomes of three Amomum species using mVISTA software. The top line shows the genes in order (with the direction of transcription indicated by an arrow). A cut-off of 70% identity was used for the plots. The Y-axis indicates the value of percent identity and ranges from 50% to 100%.
-
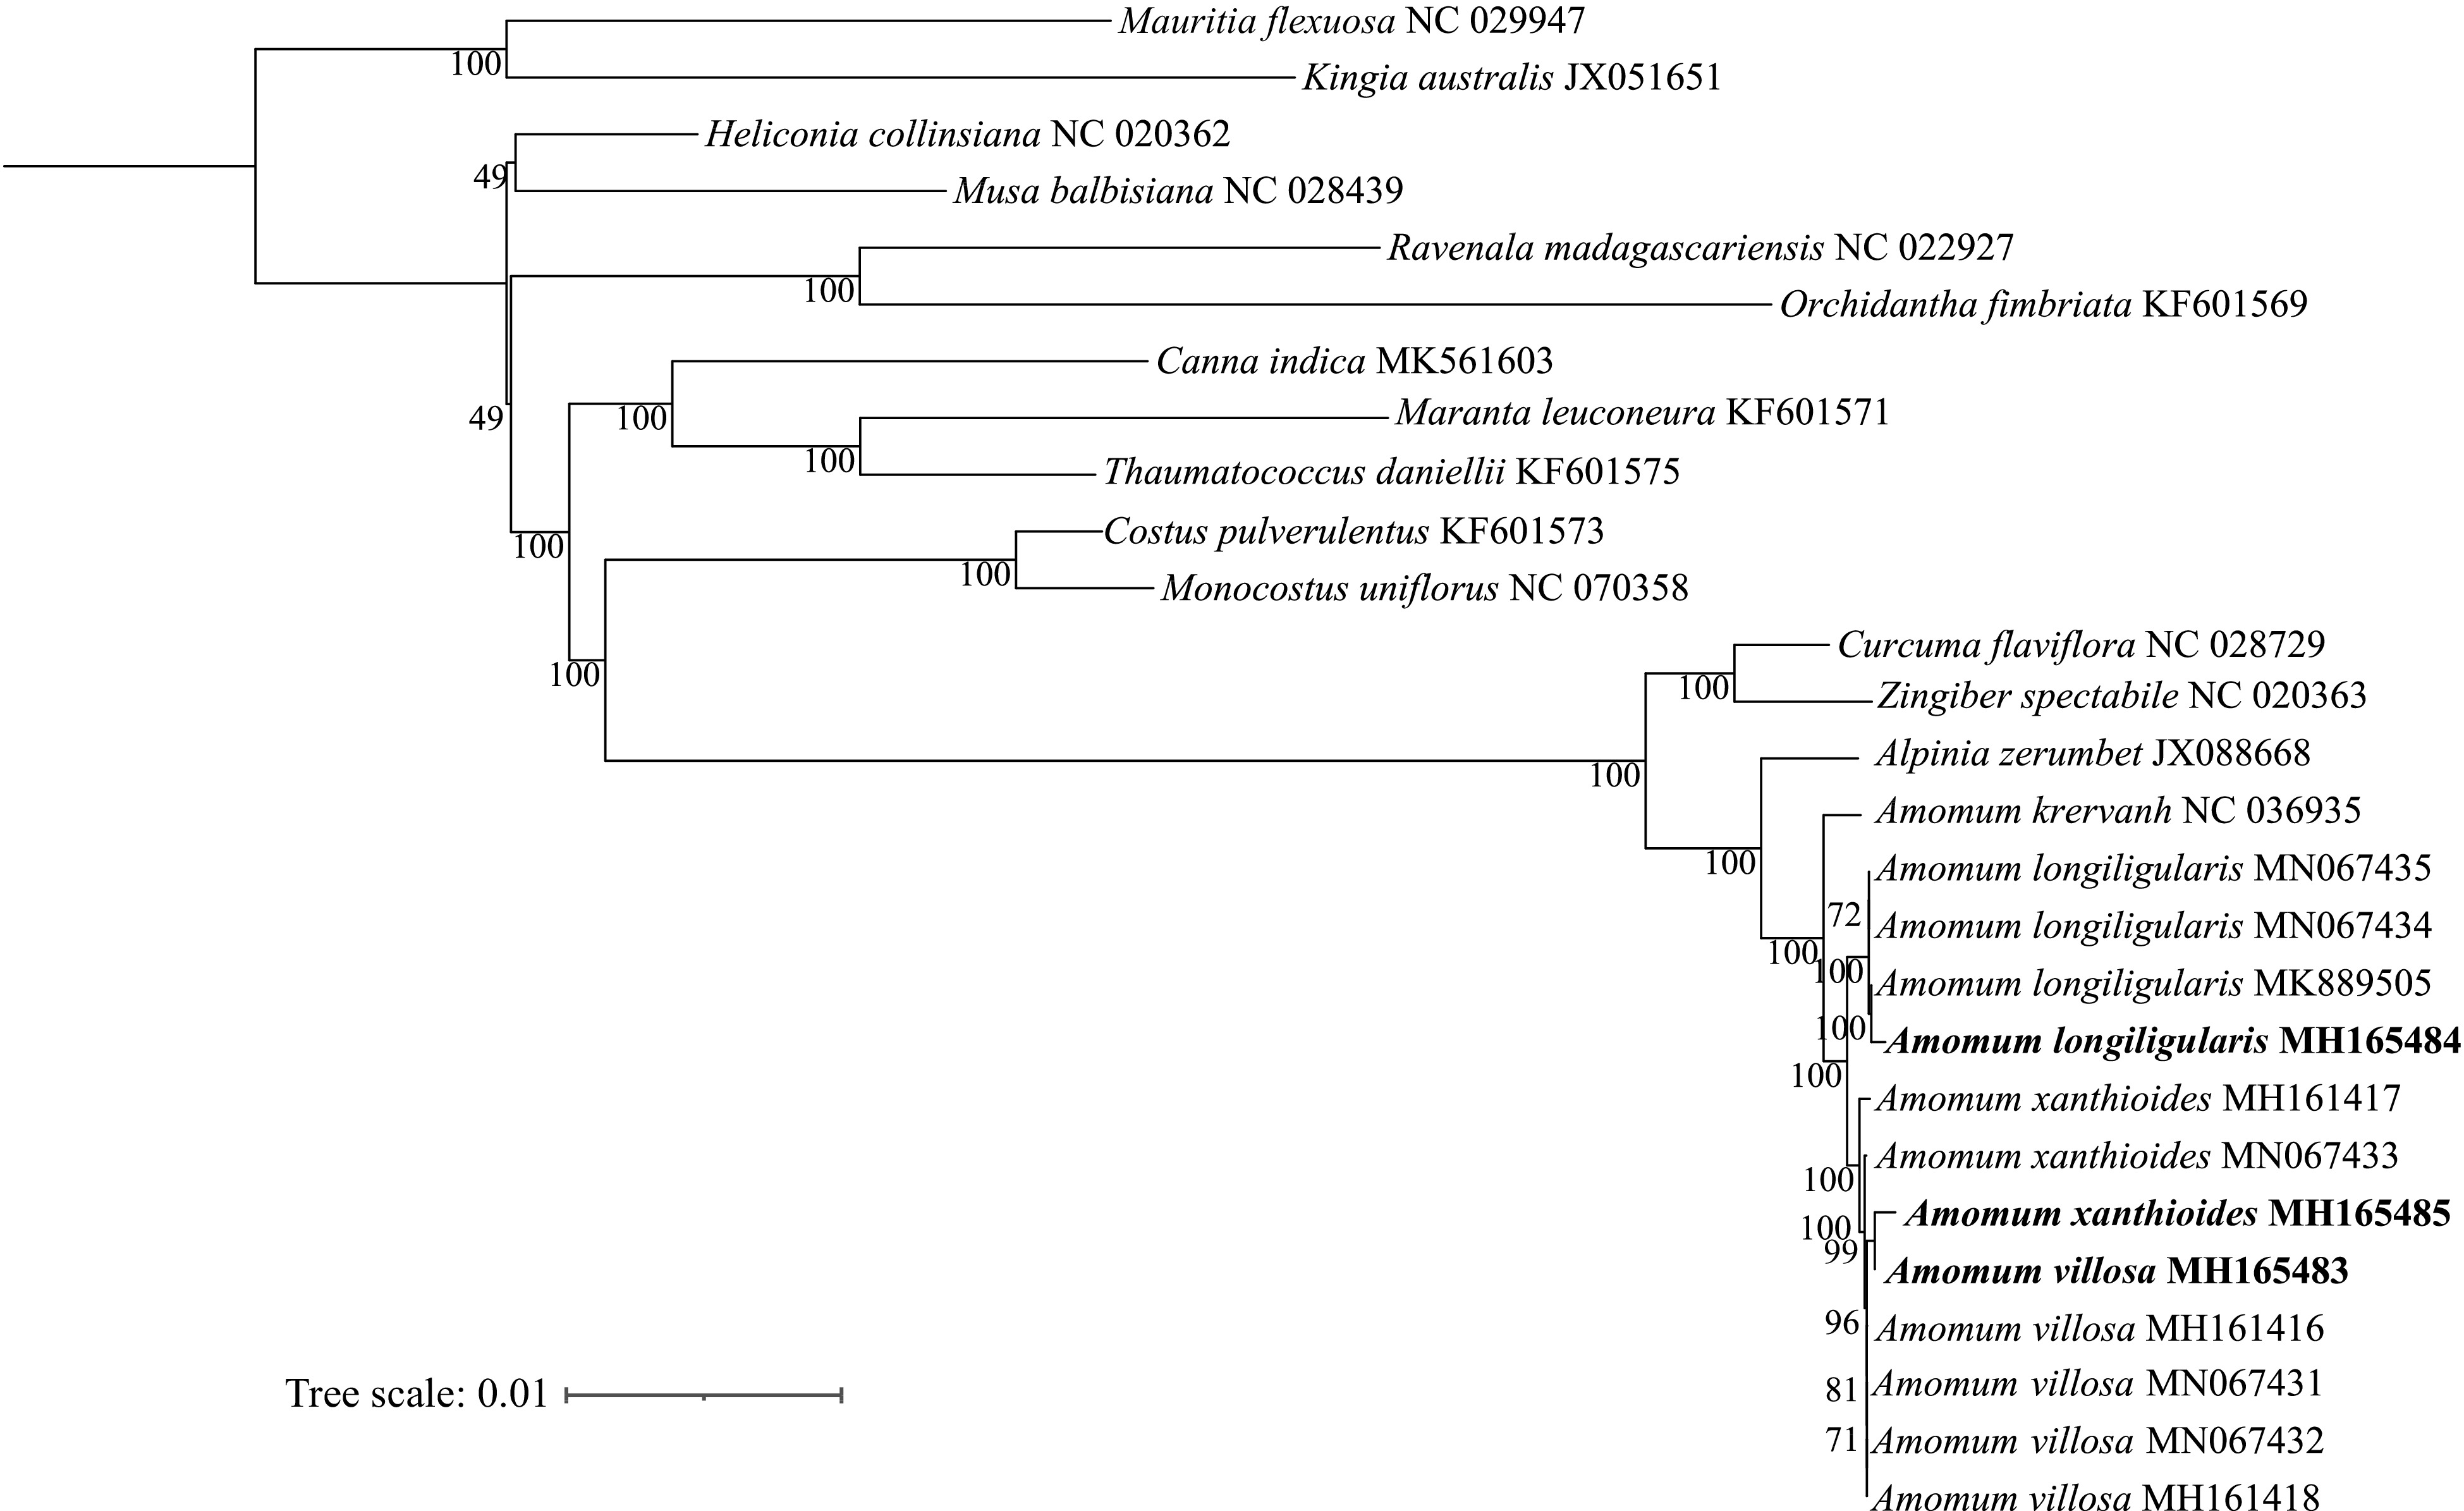
Figure 6.
Phylogenetic tree constructed using the maximum likelihood (ML) method based on 53 protein-coding genes from 16 species in the Zingiberales clade. Numbers at nodes indicate the values of bootstrap support.
-
No. Group of genes Gene names Amount 1 Photosystem I psaA, psaB, psaC, psaI, psaJ 5 2 Photosystem II psbA, psbB, psbC, psbD, psbE, psbF, psbG, psbH, psbI, psbJ, psbK, psbL, psbM, psbN, psbT, psbZ 16 3 Cytochrome b/f complex petA, petB, petD, petG, petL, petN 6 4 ATP synthase atpA, atpB, atpE, atpF*, atpH, atpI 6 5 NADH dehydrogenase ndhA*, ndhB*(×2), ndhC, ndhD, ndhE, ndhF, ndhG, ndhH, ndhI, ndhJ, ndhK 12(1) 6 RubisCO large subunit rbcL 1 7 RNA polymerase rpoA, rpoB, rpoC1*, rpoC2 4 8 Ribosomal proteins (SSU) rps2, rps3, rps4, rps7(×2), rps8, rps11, rps12**(×2), rps14, rps15, rps16*, rps18, rps19(×2) 15(3) 9 Ribosomal proteins (LSU) rpl2*(×2), rpl14, rpl16*, rpl20, rpl22, rpl23(×2), rpl32, rpl33, rpl36 11(2) 10 Proteins of unknown function ycf1(×2), ycf2(×2), ycf3**, ycf4, ycf15*(×2), ycf68*(×2) 10(4) 11 Other genes accD, clpP**, matK, ccsA, cemA, infA 6 12 Transfer RNAs# 39/38/39 tRNAs 39/38/39(7) 13 Ribosomal RNAs rrn4.5(×2), rrn5(×2), rrn16(×2), rrn23(×2) 8(4) * Gene with one intron; ** gene with two introns; (×2) indicates the number of the repeat unit is 2. # indicates different amount among A. xanthioides, A. villosum and A. longiligulare. Table 1.
Gene contents of three Amomum chloroplast genomes.
-
Gene Location Exon I (bp) Intron I (bp) Exon II (bp) Intron II (bp) Exon III (bp) atpF# LSC 378 770/771/771 207 − − clpP# LSC 252 627/626/629 237 908/909/909 72 ndhA# SSC 567 1,056/1,067/1,054 513 − − ndhB IR 849 603 783 − − rpl16# LSC 8 1,045/1,042/1,038 420 − − rpl2 IR 426 658 396 − − rpoC1# LSC 1605 751/752/739 438 − − rps12 LSC 156 − 159 156 159 rps16# LSC 234 703/707/721 46 − − trnA-UGC IR 38 803 35 − − trnI-GAU# IR 35/42/35 937 42/35/42 − − trnL-UAA# LSC 35 563/534/534 50 − − trnV-UAC# LSC 37 606/606/603 38 − − ycf3# LSC 138 773/773/774 249 710/711/710 135 # indicates different amount among A. xanthioides, A. villosum and A. longiligulare. Table 2.
Gene with introns in three Amomum chloroplast genomes and the length of exons and introns.
-
SSR type Repeat unit Amount Ratio (%) A. xanthioides A. villosum A. longiligulare A. xanthioides A. villosum A. longiligulare Mono A/T 57 62 58 100 100 100 Di GA/TC 2 2 2 13.3 10.5 11.8 AT/AT 13 17 15 86.7 88.2 86.7 Tri GCT/AGC 1 1 1 33.3 25.0 33.3 TTC/GAA 1 1 1 33.3 25.0 33.3 GGA/TCC 1 1 1 33.3 25.0 33.3 ATA/TAT 0 1 0 0.0 25.0 0.0 Tetra TTAT/ATAA 2 2 2 15.4 18.2 18.2 AAAG/CTTT 1 1 1 7.7 9.1 9.1 ATTT/AAAT 2 2 1 15.4 18.2 9.1 CTAA/TTAG 1 1 1 7.7 9.1 9.1 AGAA/TTCT 2 2 2 15.4 18.2 18.2 CGTA/TACG 1 1 1 7.7 9.1 9.1 CATA/TATG 1 1 0 7.7 9.1 0.0 GAAT/ATTC 1 1 1 7.7 9.1 9.1 TATT/AATA 1 1 1 7.7 9.1 9.1 AATT/AATT 1 1 1 7.7 9.1 9.1 Penta TTAAA/TTTAA 1 1 1 50.0 50.0 50.0 AATCA/TGATT 1 1 1 50.0 50.0 50.0 Hexa TGATAG/CGATCA 1 1 1 25.0 25.0 50.0 GAAGAG/CTCTTC 1 1 0 25.0 25.0 0.0 TCCTCT/AGAGGA 1 1 0 25.0 25.0 0.0 TCACTA/TAGTGA 1 1 1 25.0 25.0 50.0 Table 3.
SSR types and amounts in three Amomum chloroplast genomes.
Figures
(6)
Tables
(3)