-
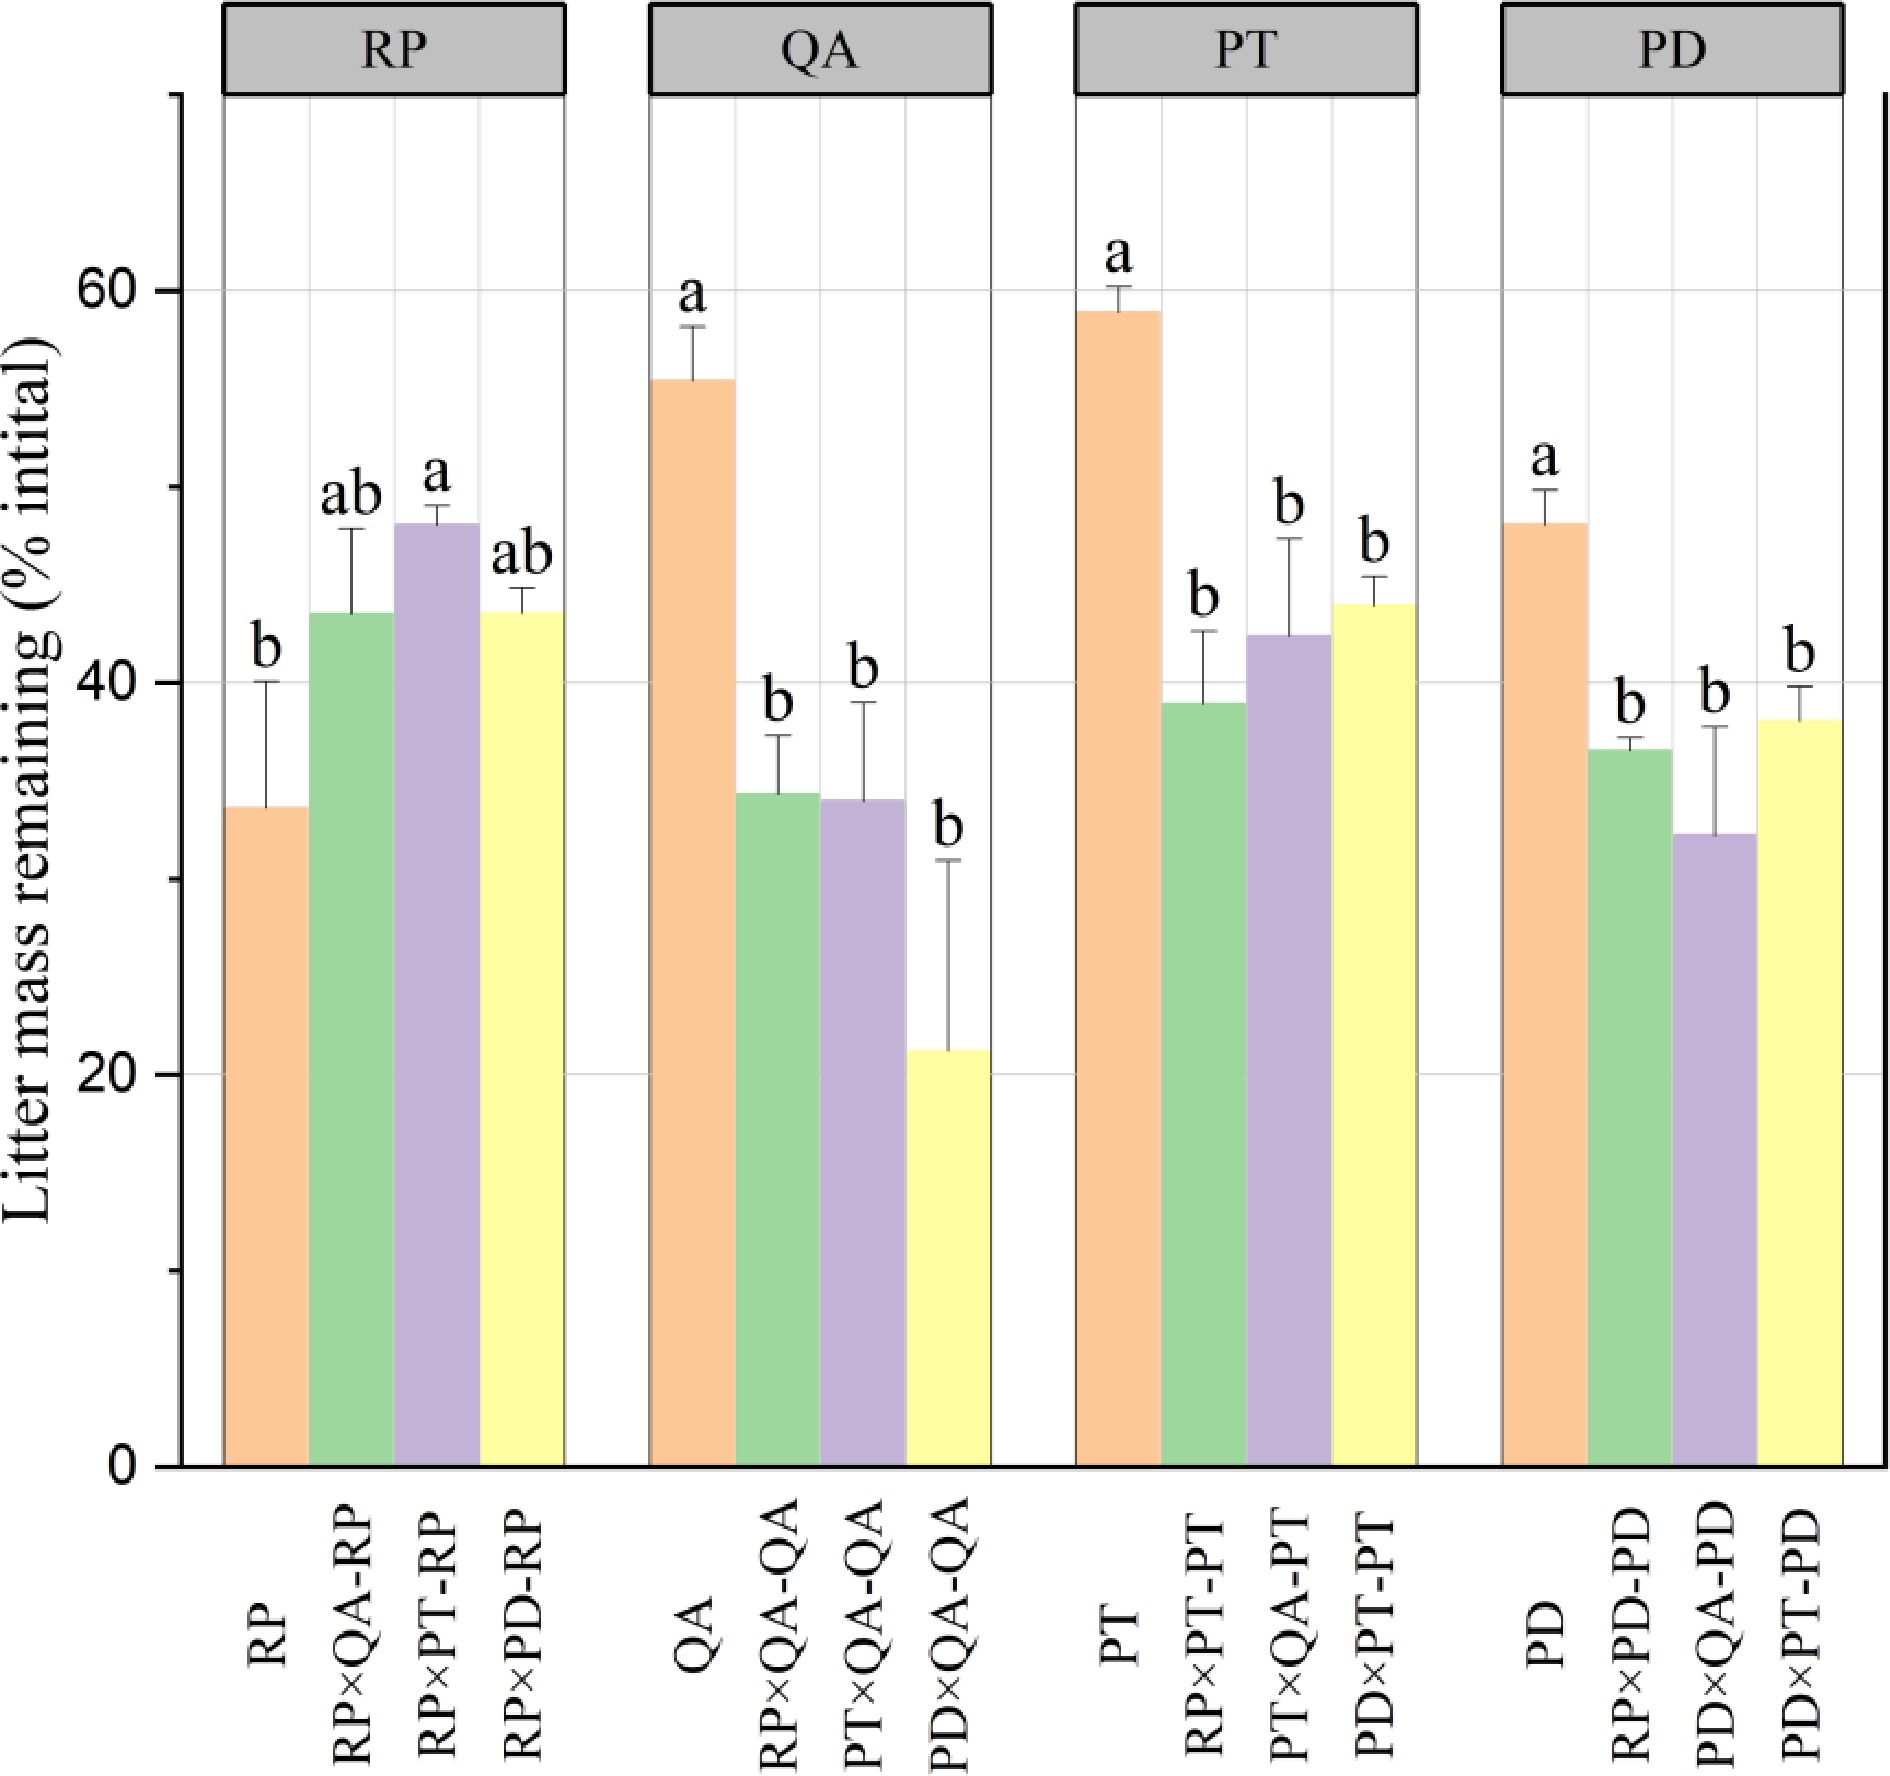
Figure 1.
Litter mass remaining in decomposing monocultures and mixtures. × represents mixed decomposition. A×B-A and A×B-B represent decomposition characteristics of A and B in mixed decomposition, respectively. Mean ± standard error (SE), n = 3. Error bars represent SE. Different lowercase letters indicate significant differences (p < 0.05) among different types of litter-bag. RP, Robinia pseucdoacacia; QA, Quercus acutissima; PT, Pinus tabulaeformis; and PD, Pinus densiflora.
-
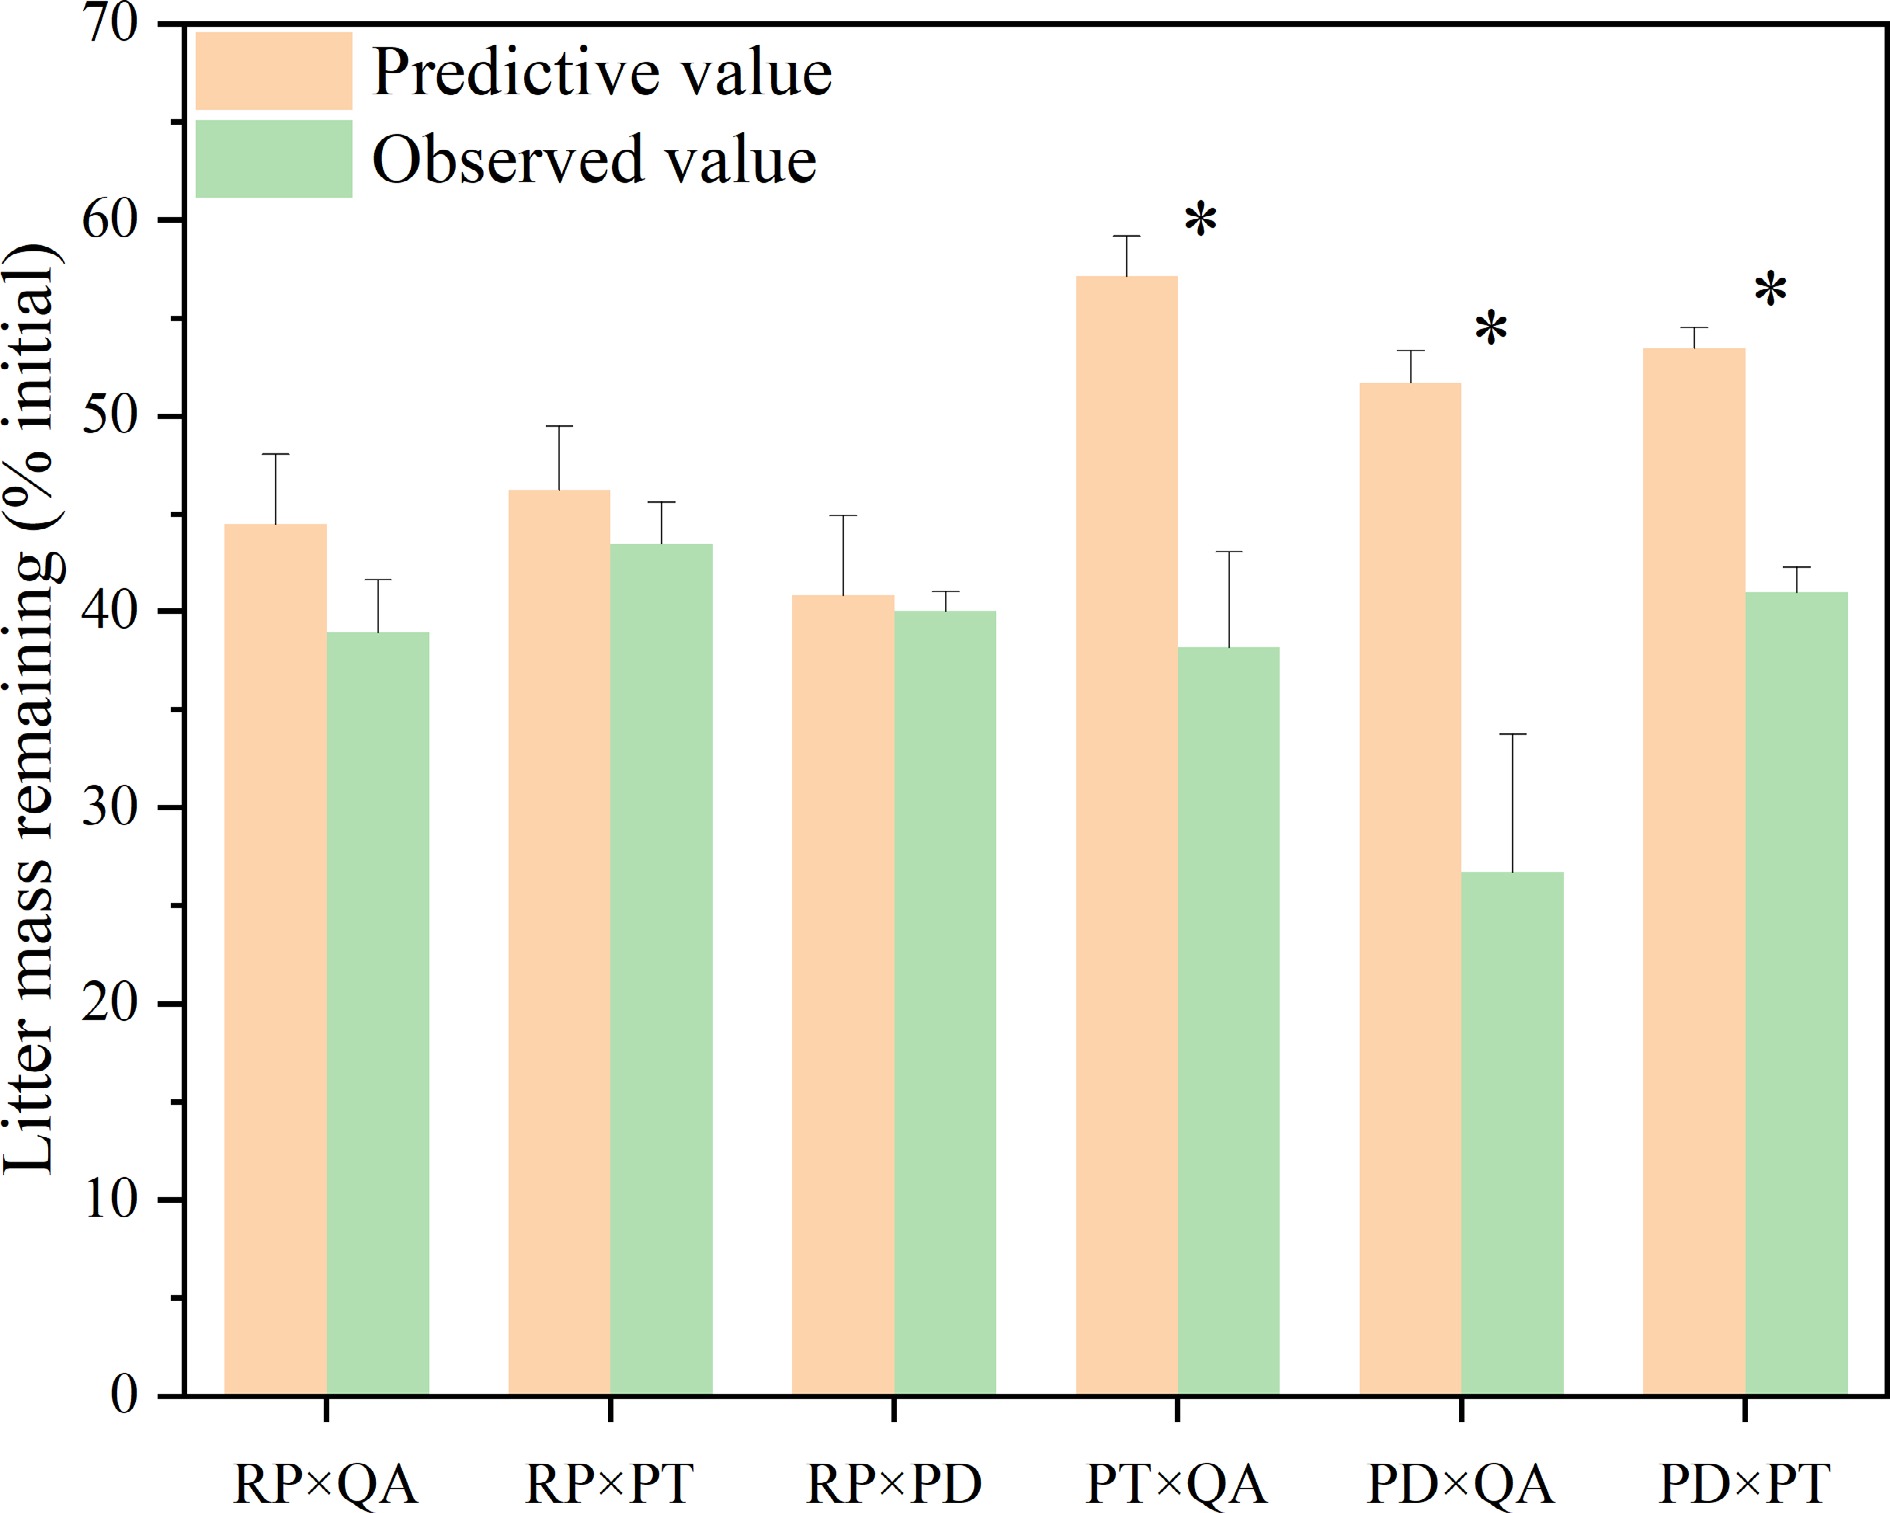
Figure 2.
Observed and predicted litter mass remaining for litter mixtures. × represents mixed decomposition. Mean ± SE, n = 3. * indicates significant differences (p < 0.05) between predictive and observed values among different types of litter-bag. RP, Robinia pseucdoacacia; QA, Quercus acutissima; PT, Pinus tabulaeformis; and PD, Pinus densiflora.
-
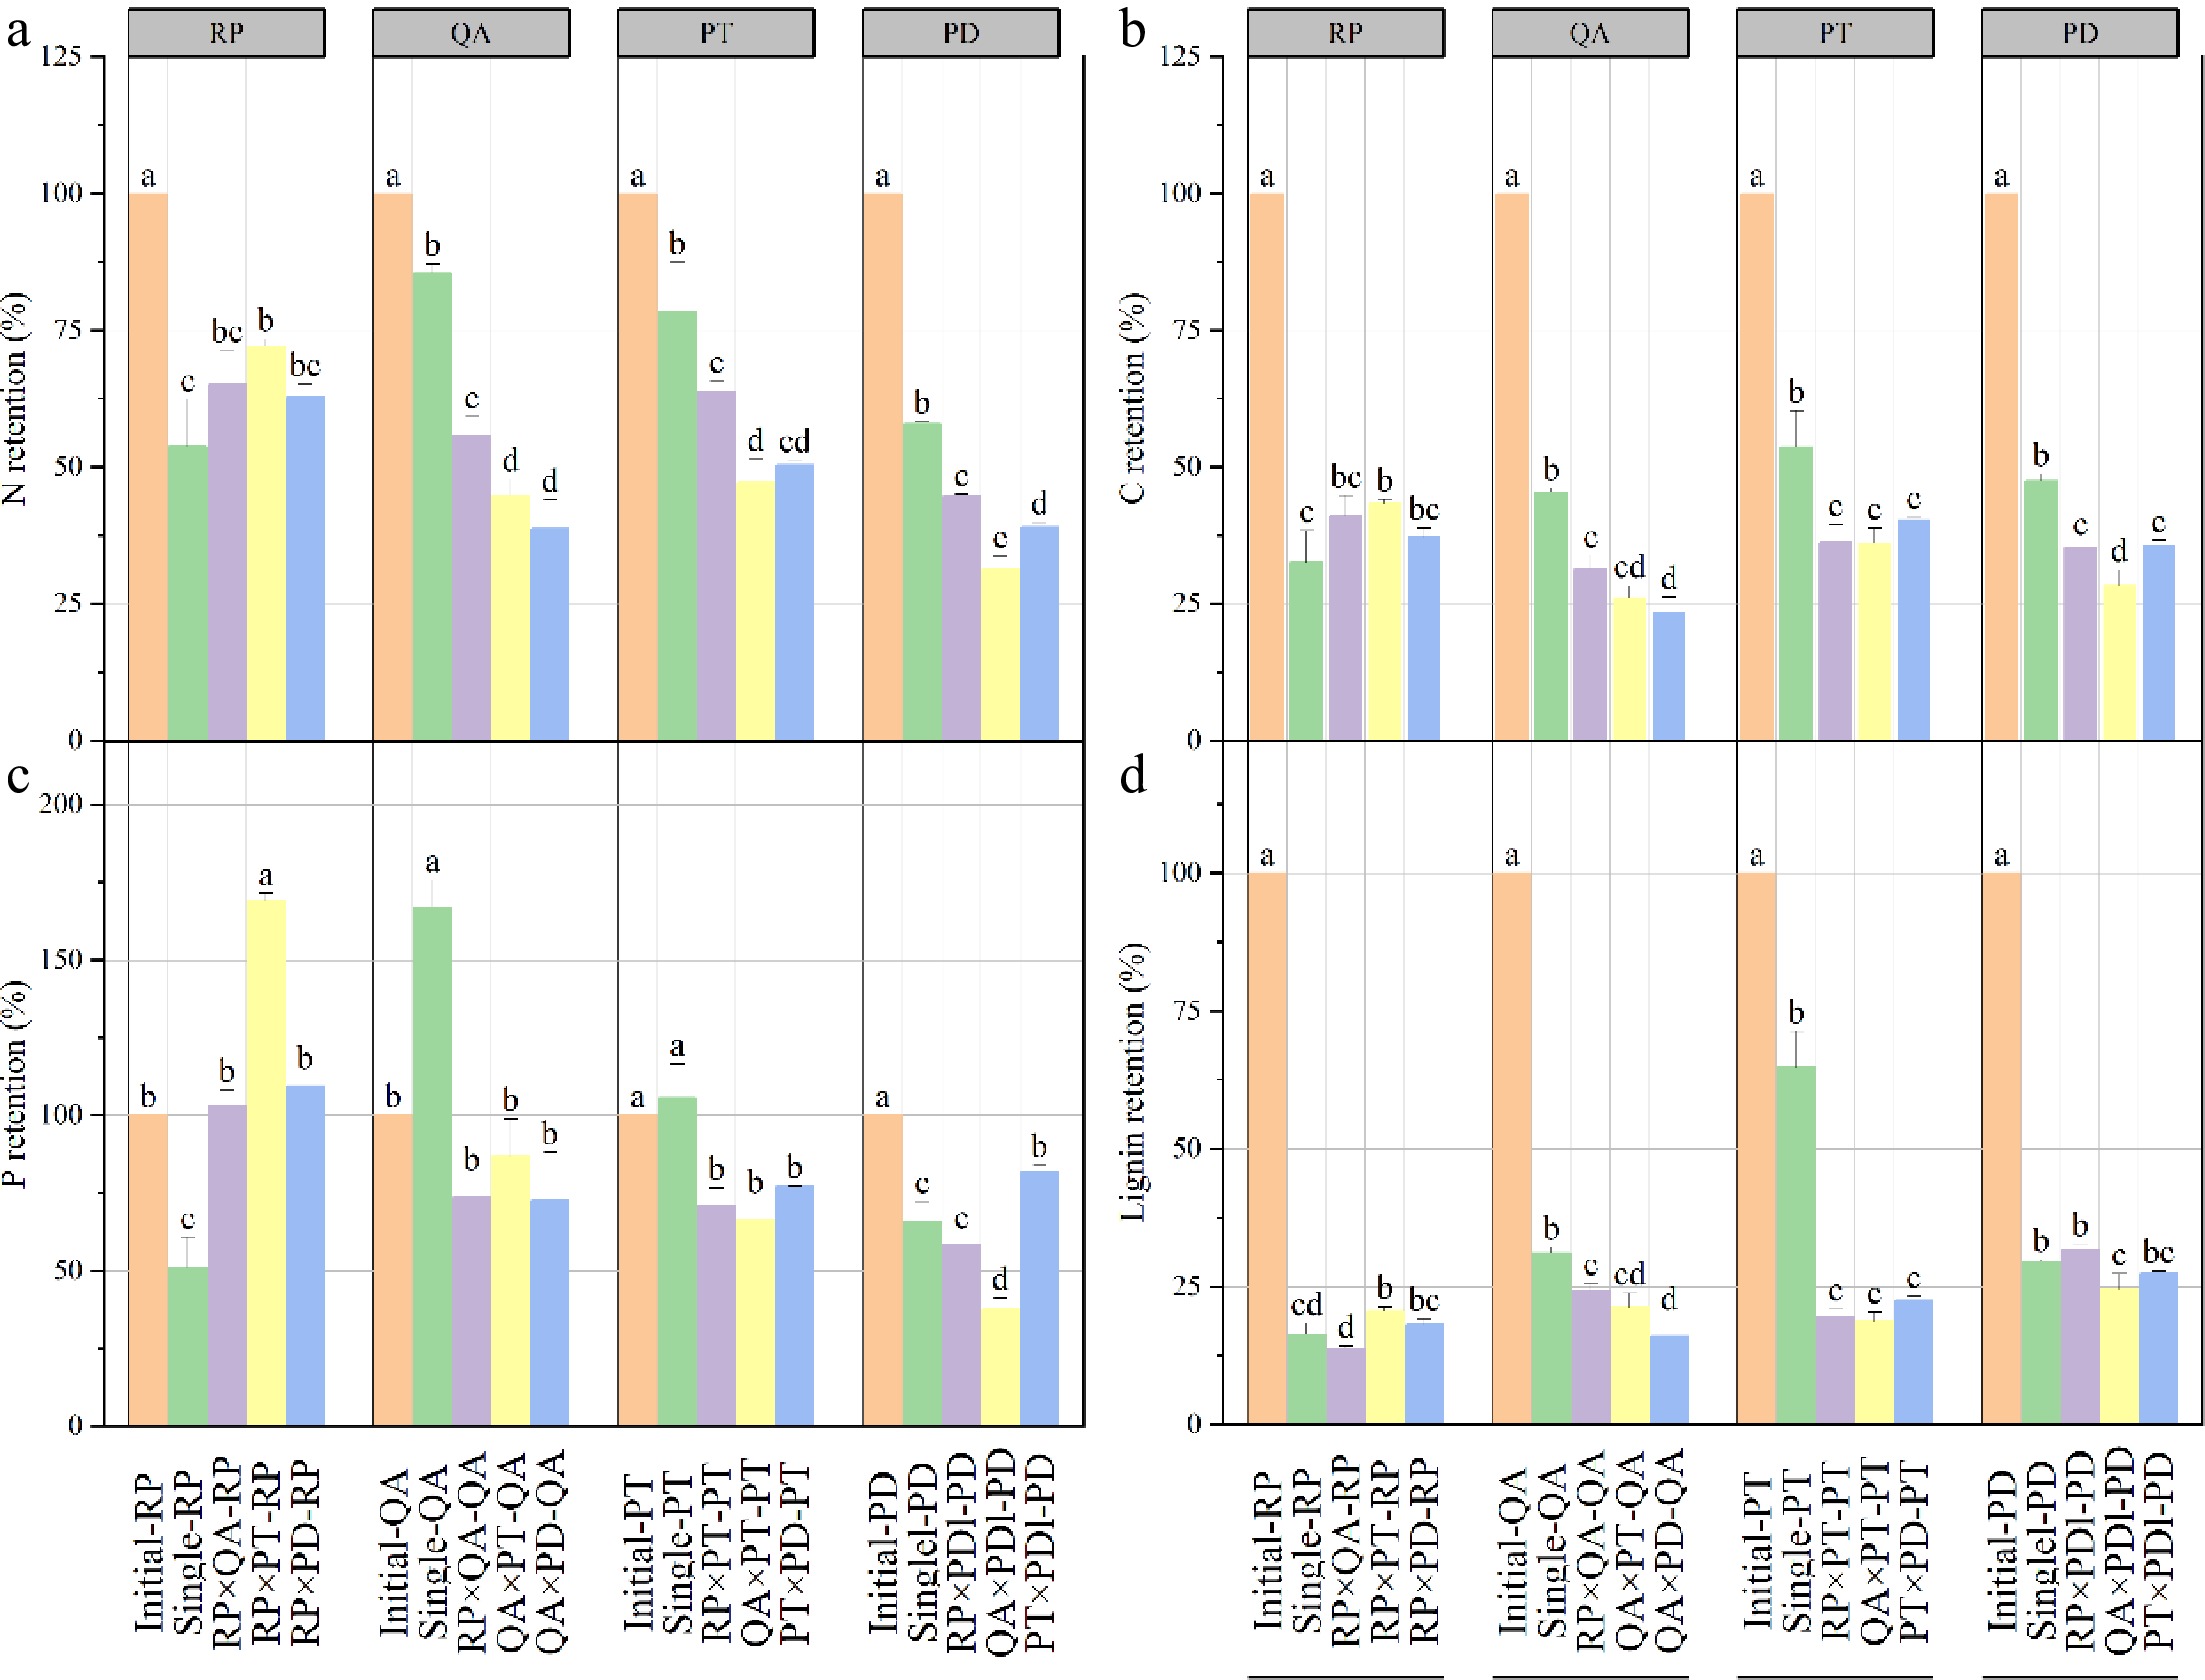
Figure 3.
Nutrient retention rates of litter in monocultures and mixtures after one year's decomposition. × represents mixed decomposition. Error bars represent standard errors. Different lowercase letters above the bars indicate significant differences (p < 0.05) between the different litter-bag types. A, B, C, and D represent N, C, P, and lignin retention, respectively. RP, Robinia pseucdoacacia; QA, Quercus acutissima; PT, Pinus tabulaeformis; and PD, Pinus densiflora.
-
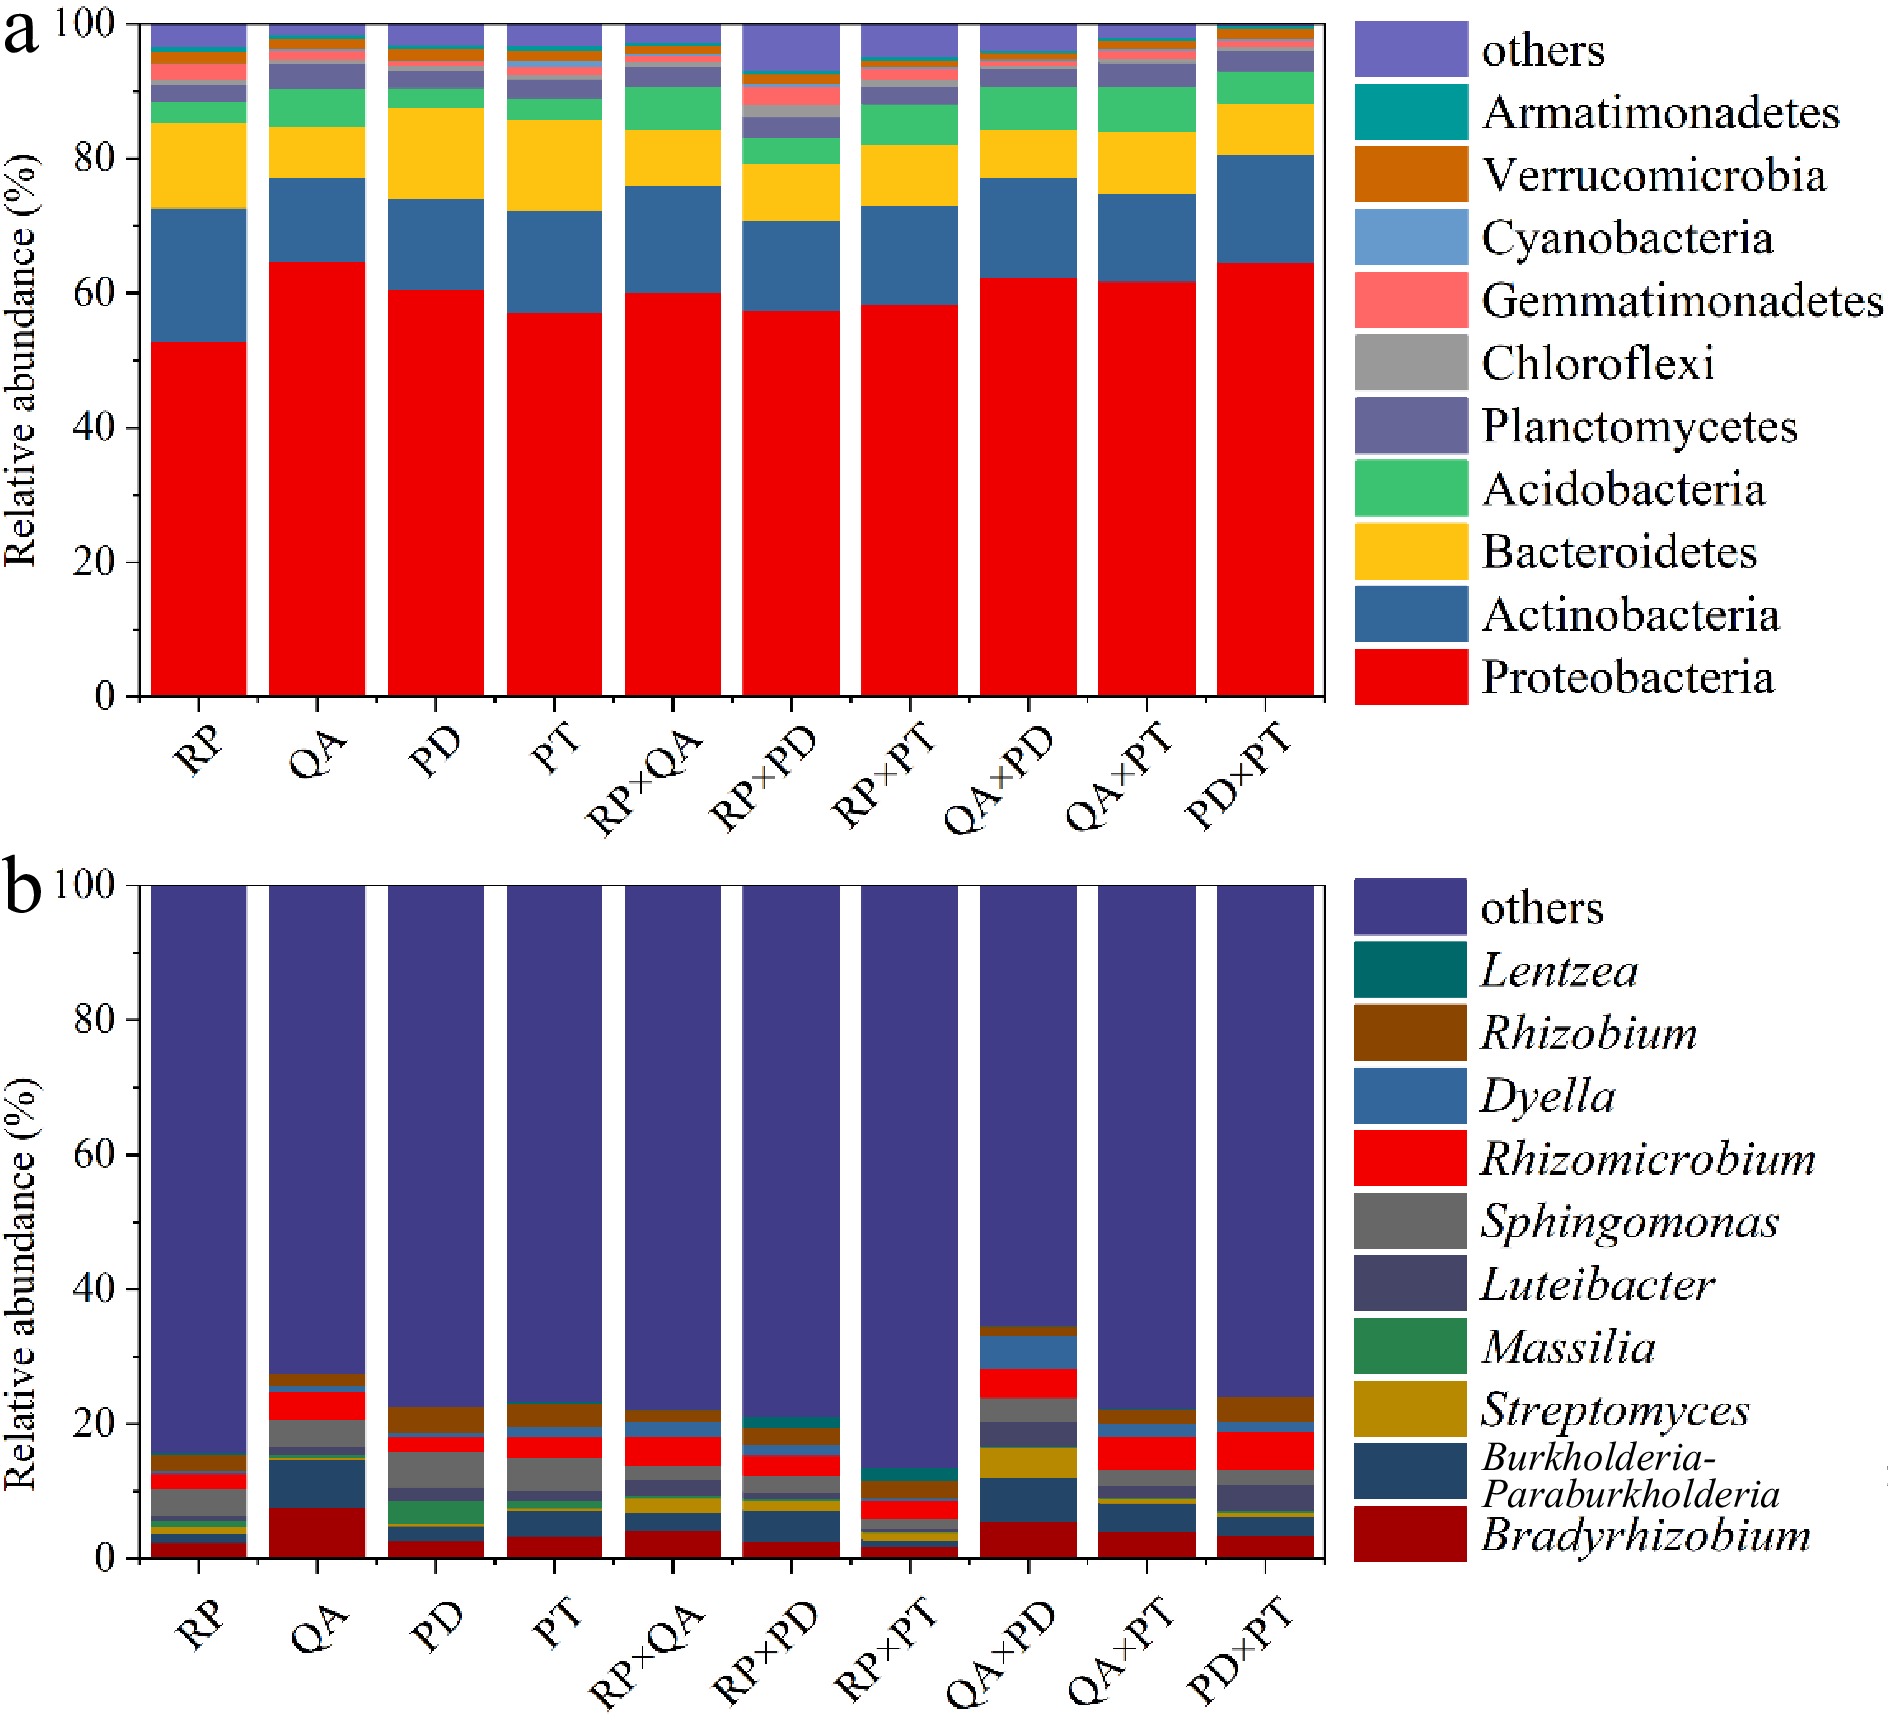
Figure 4.
Composition of the 10 most abundant taxonomic groups according to the mean relative abundances of bacterial assemblages, (a) at the phylum level and (b) at the genus level. × represents mixed decomposition. RP, Robinia pseucdoacacia; QA, Quercus acutissima; PT, Pinus tabulaeformis; and PD, Pinus densiflora.
-
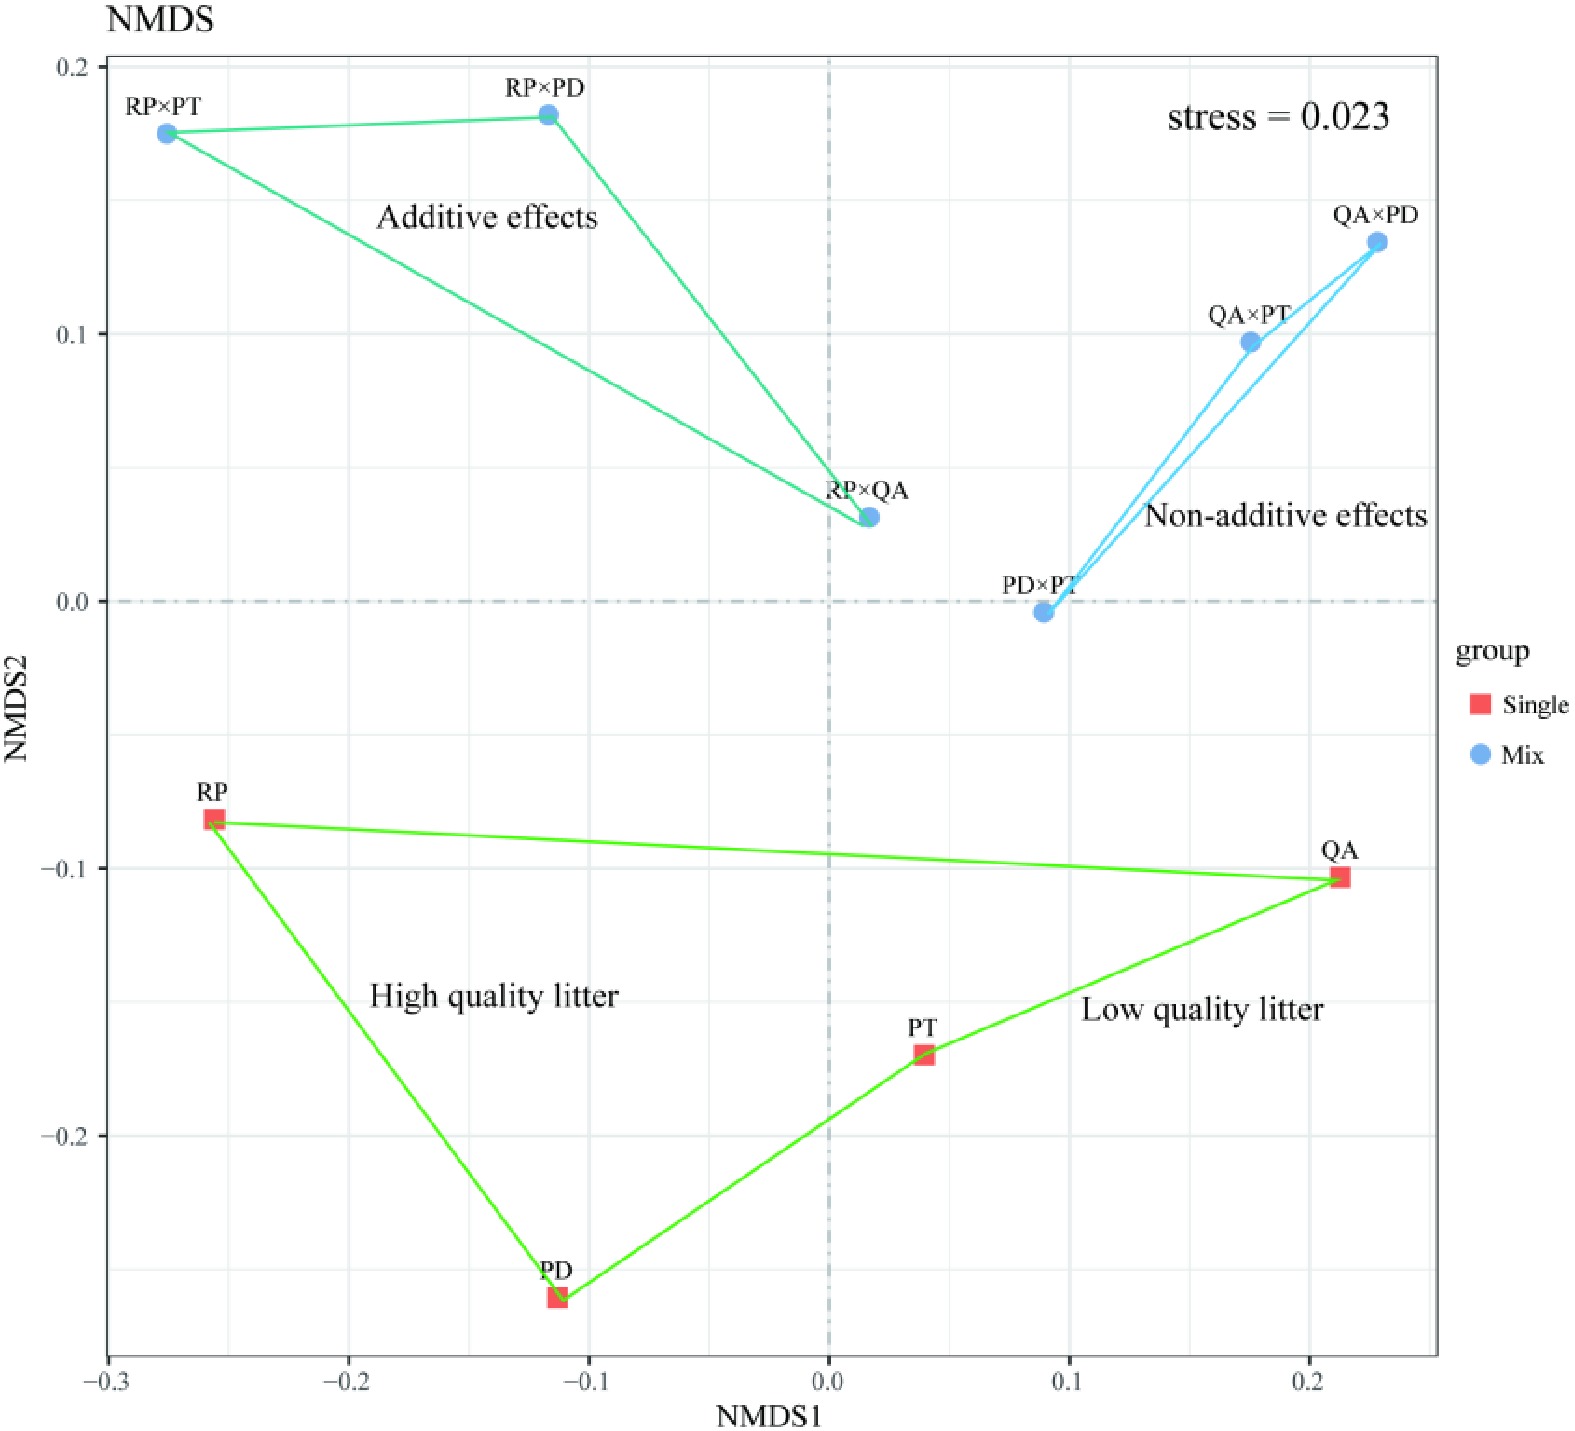
Figure 5.
Bacterial community structure in leaf litter samples decomposed for one year using Bray–Curtis distances. Squares and circles show bacterial community structures of litter monocultures and mixtures, respectively. The stress value was 0.023. RP, Robinia pseucdoacacia; QA, Quercus acutissima; PT, Pinus tabulaeformis; and PD, Pinus densiflora.
-
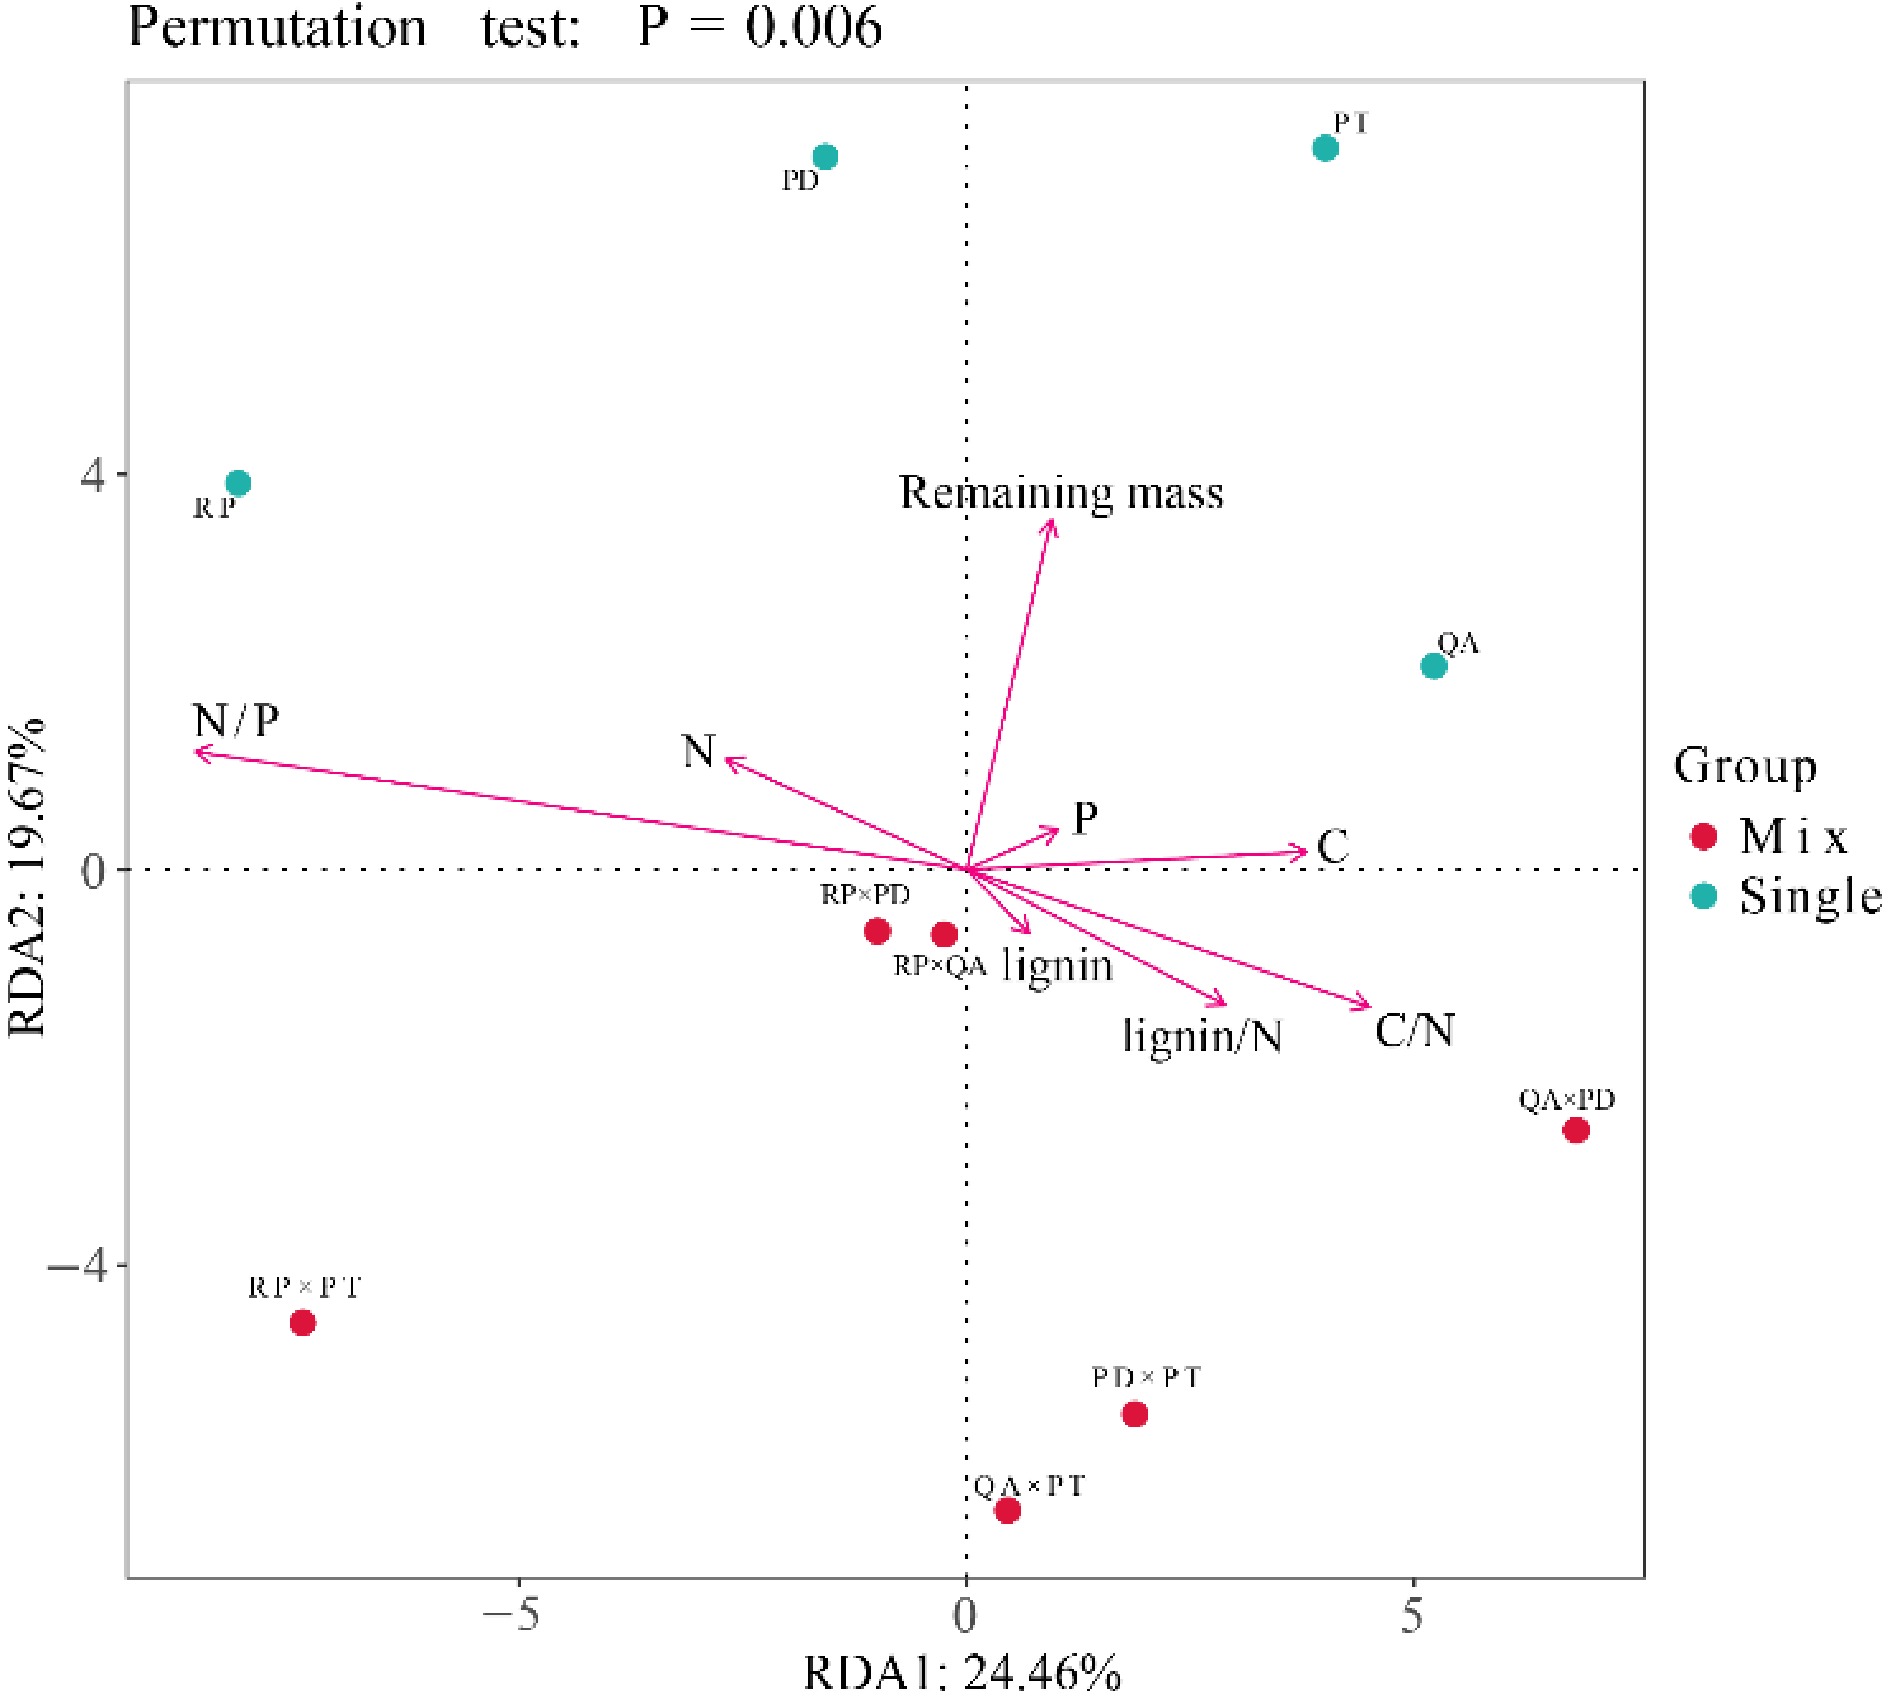
Figure 6.
Redundancy analysis (RDA) of bacterial community structure, litter mass remaining, and initial litter properties. Red and blue circles represent bacterial community structure of litter monocultures and mixtures, respectively. Red lines represent the litter mass remaining and initial litter properties. RP, Robinia pseucdoacacia; QA, Quercus acutissima; PT, Pinus tabulaeformis; and PD, Pinus densiflora.
Figures
(6)
Tables
(0)