-
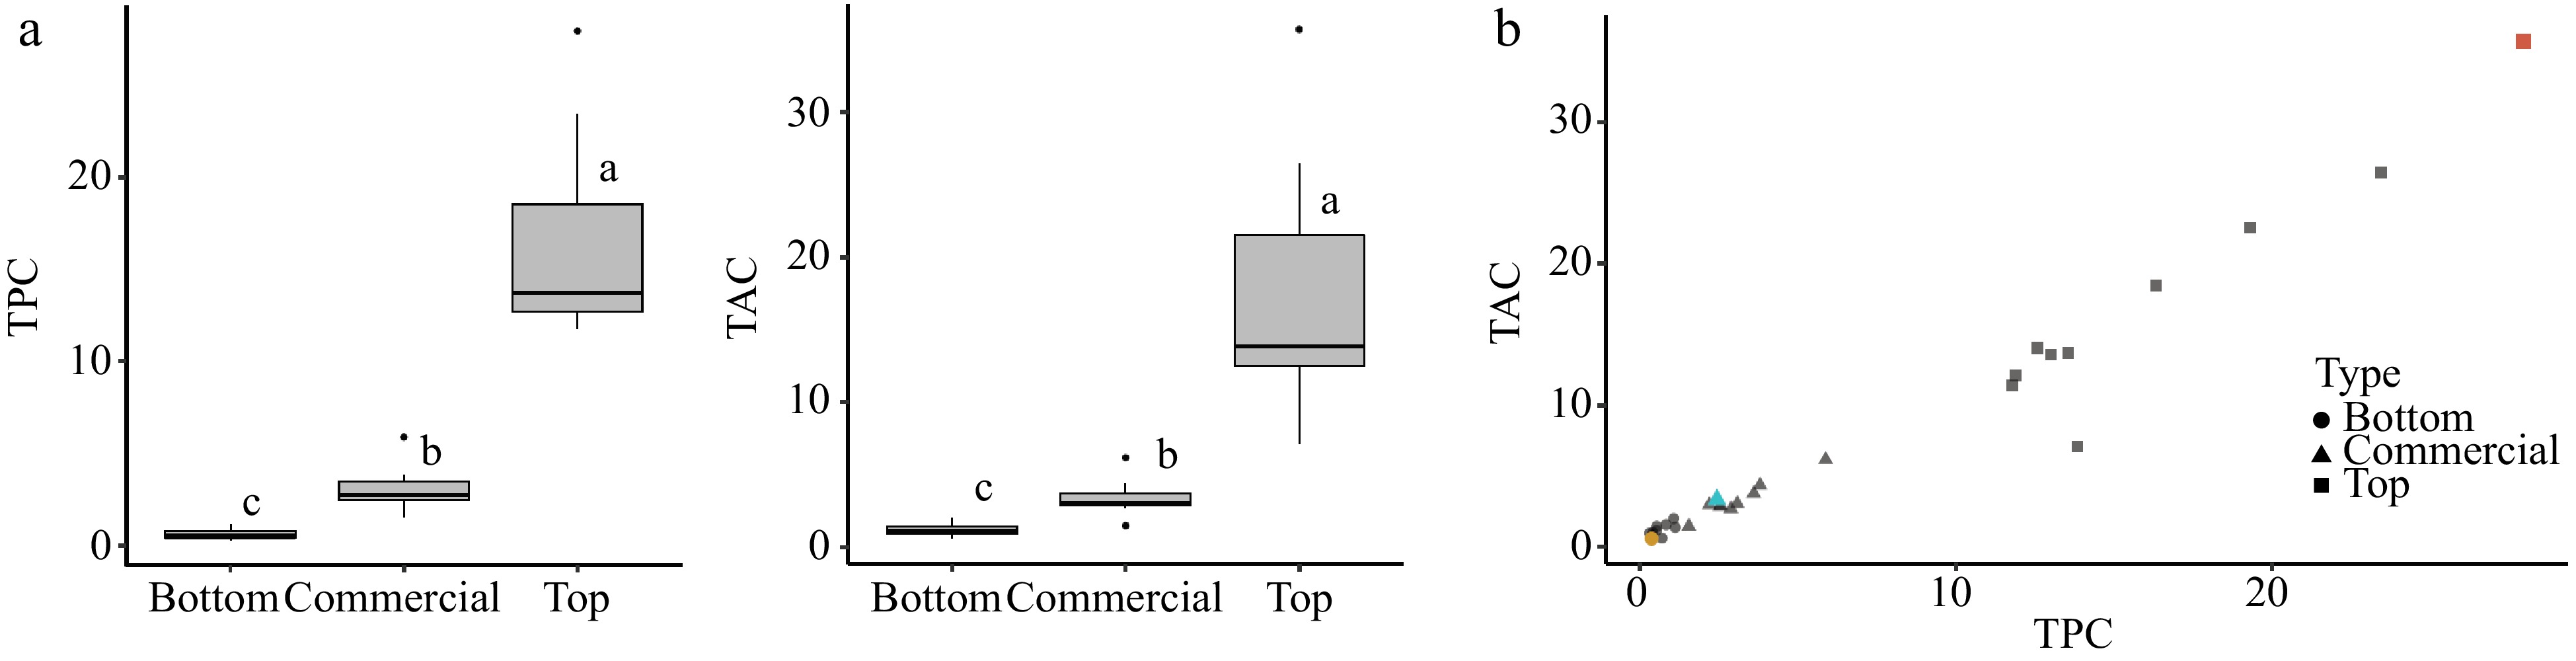
Figure 1.
Comparison of high total phenolic content (TPC) and high total antioxidant capacity (TAC) in the 10 apples with the highest (Top) vs. lowest (Bottom) TPC and TAC values, alongside 10 commercial apple cultivars (Commercial). (a) Boxplots for TPC and TAC of each category showing significant differences between category means according to a Kruskal-Wallis test (α = 0.05). (b) Scatterplot showing significant correlation between TPC and TAC (r = 0.98, p < 0.05). Cultivars 'Zestar' (yellow dot), 'Honeycrisp' (blue triangle) and 'Marechal' (red square) are highlighted to illustrate the range of responses.
-
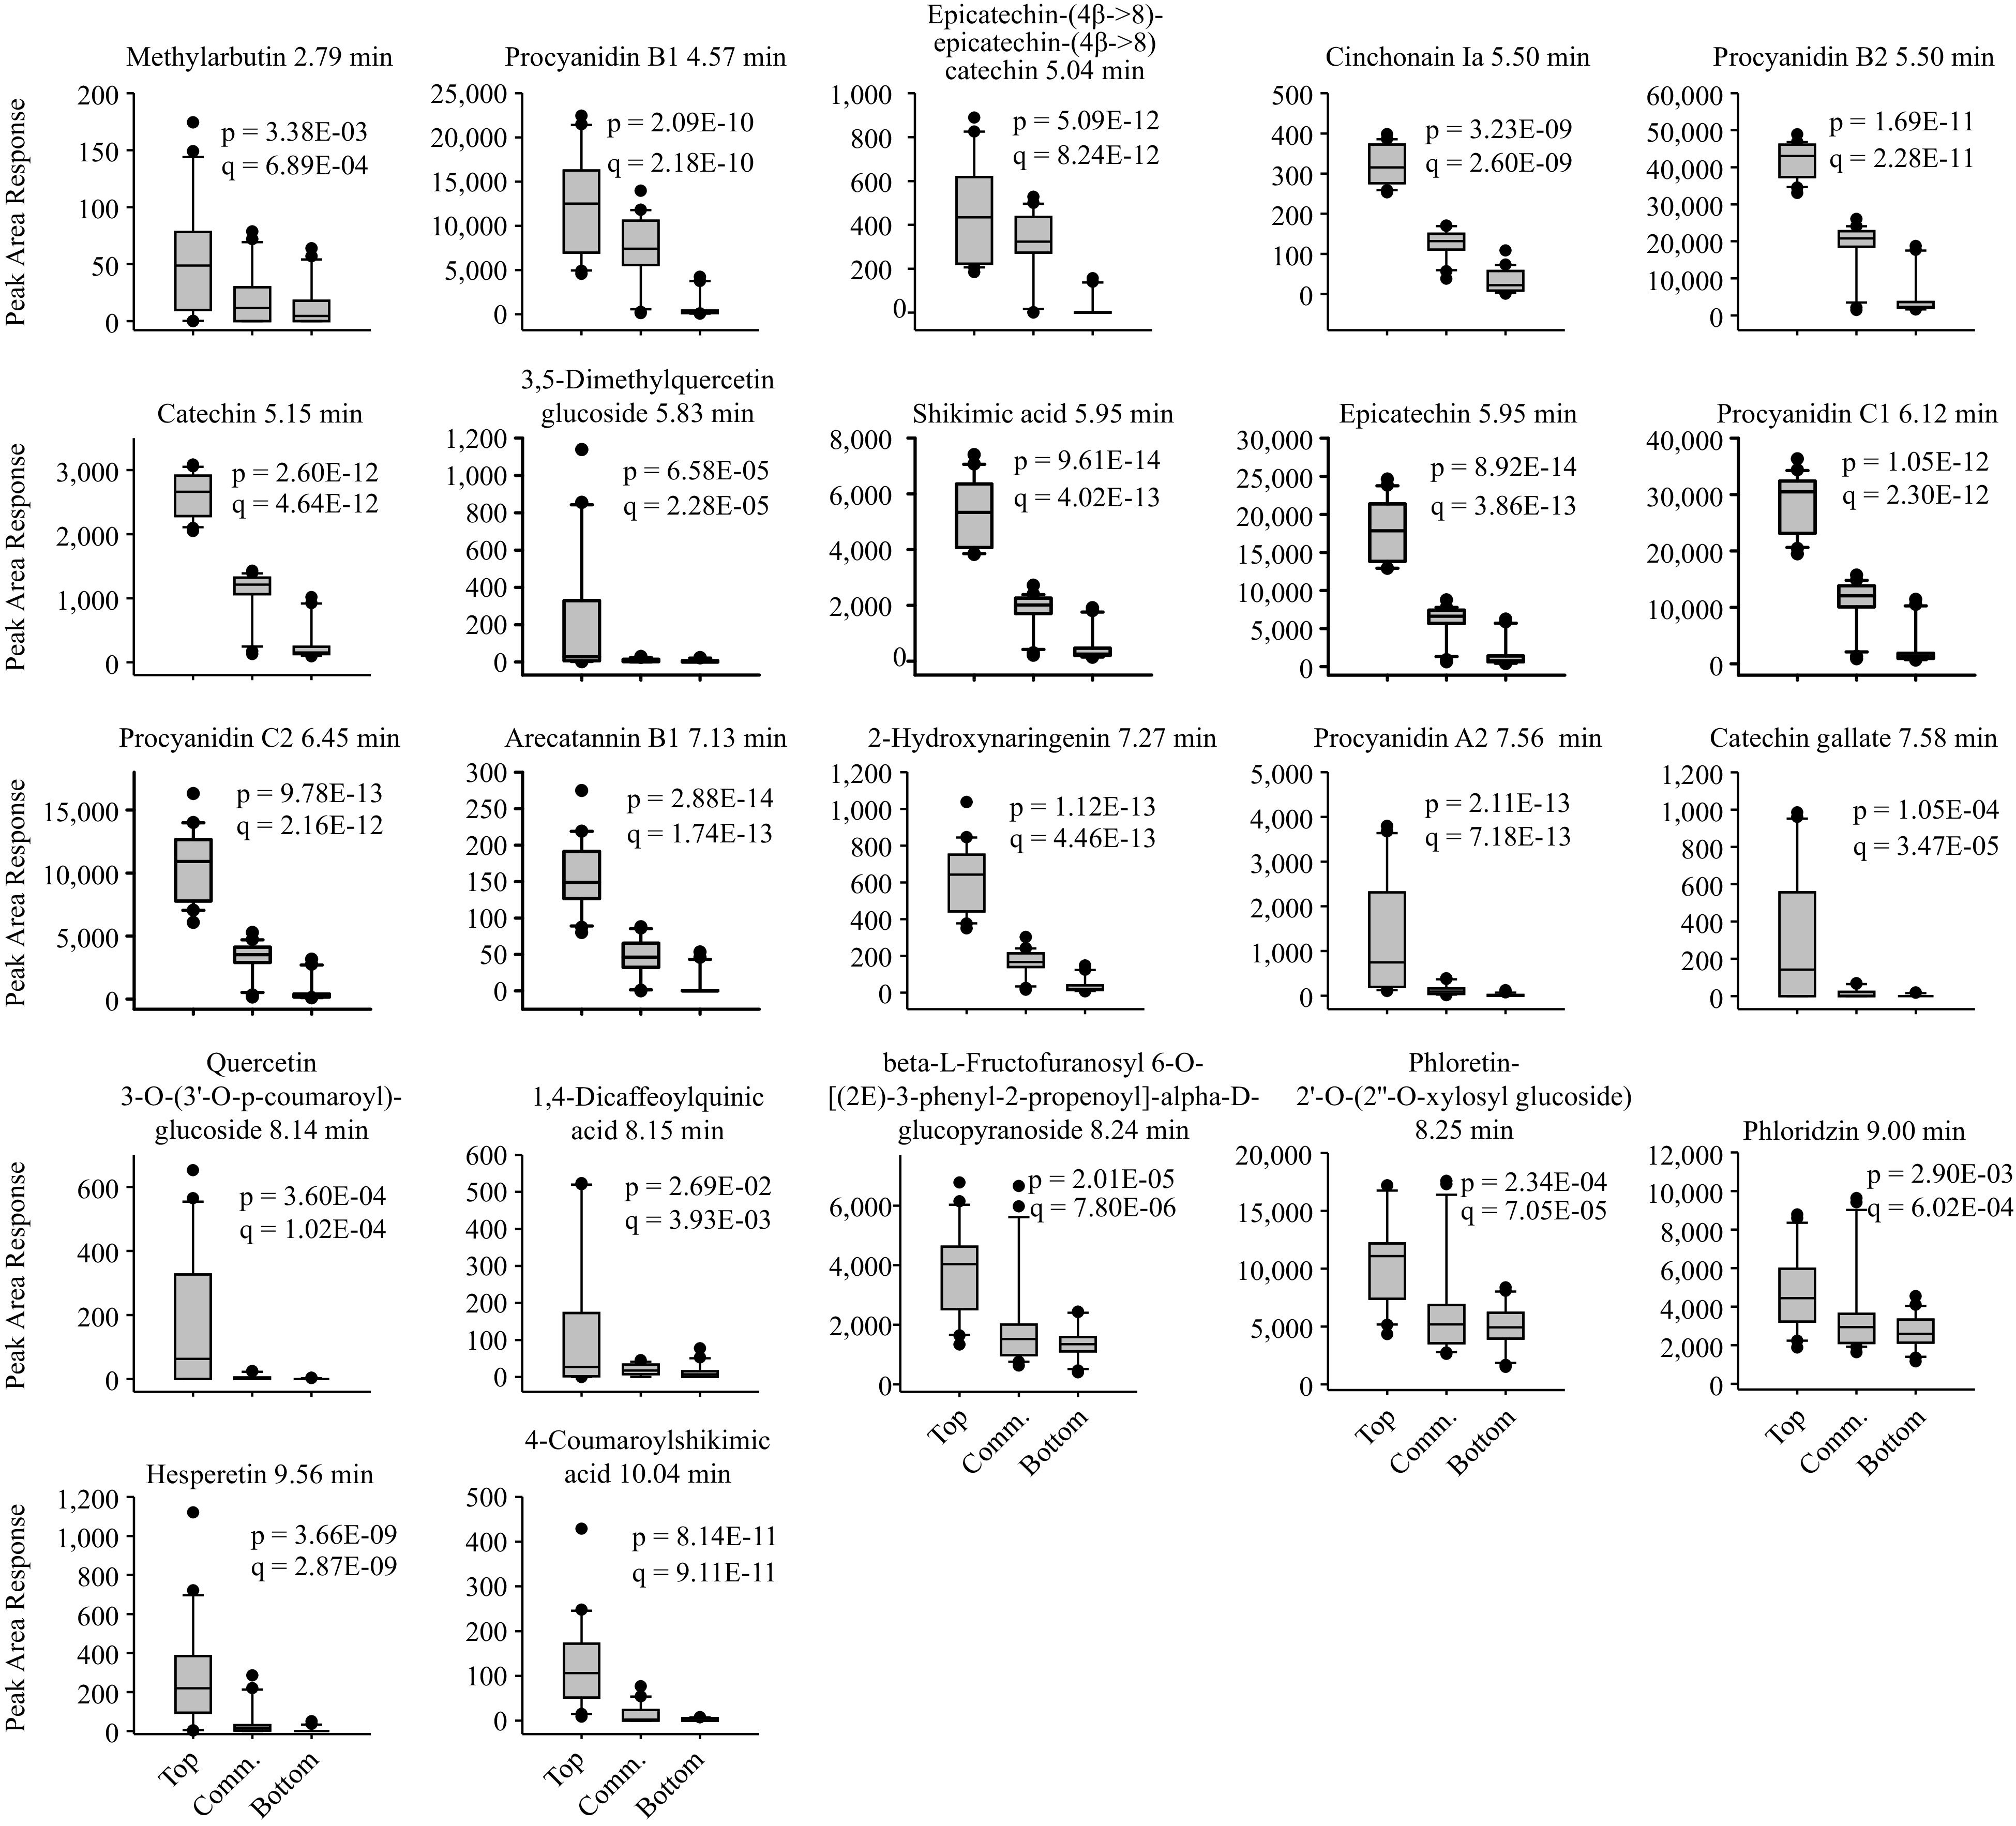
Figure 2.
Boxplots of apple phenolic compounds significantly more abundant in the top TPC and TAC group as compared with the bottom and commercial groups. The statistics p and q represent the unadjusted and multiple means corrected significance values, respectively, for a variance analysis comparing the effects of apple group on phenolic compound content.
-
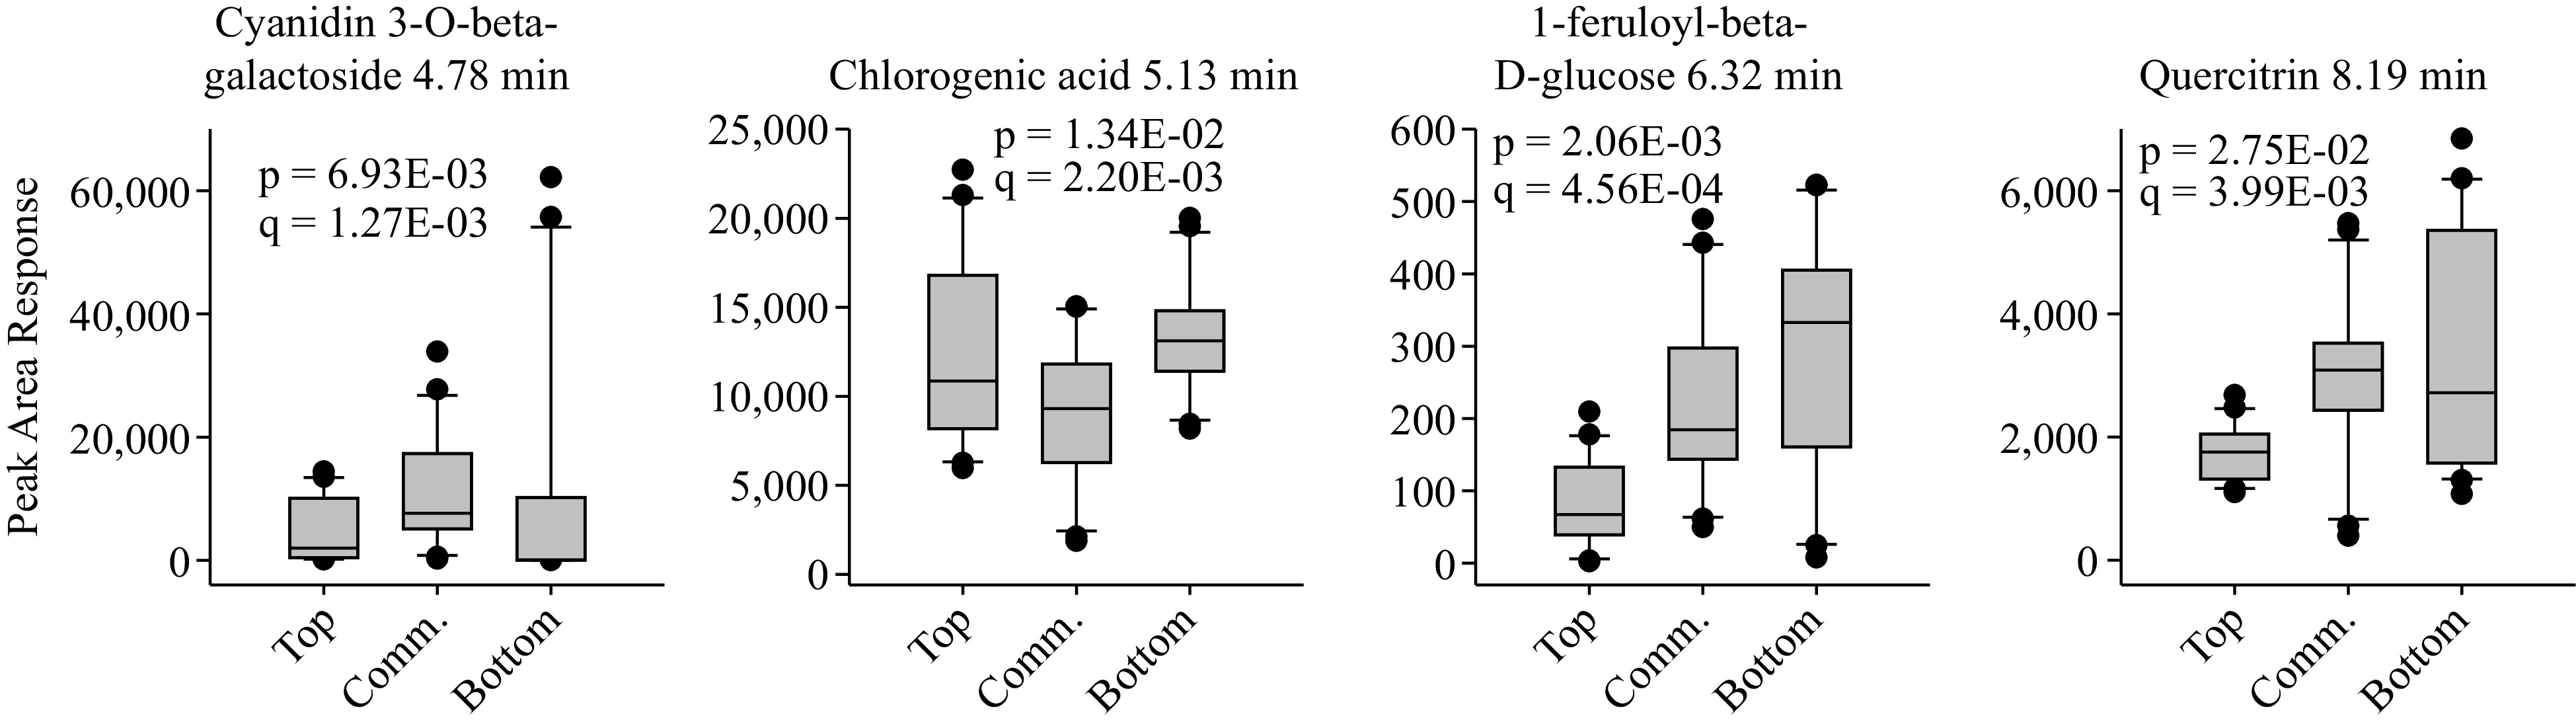
Figure 3.
Boxplots of apple phenolic compounds significantly more abundant in the bottom TPC and TAC group as compared with the top and commercial groups. The statistics p and q represent the unadjusted and multiple means corrected significance values, respectively, for a variance analysis comparing the effects of apple group on phenolic compound content.
-
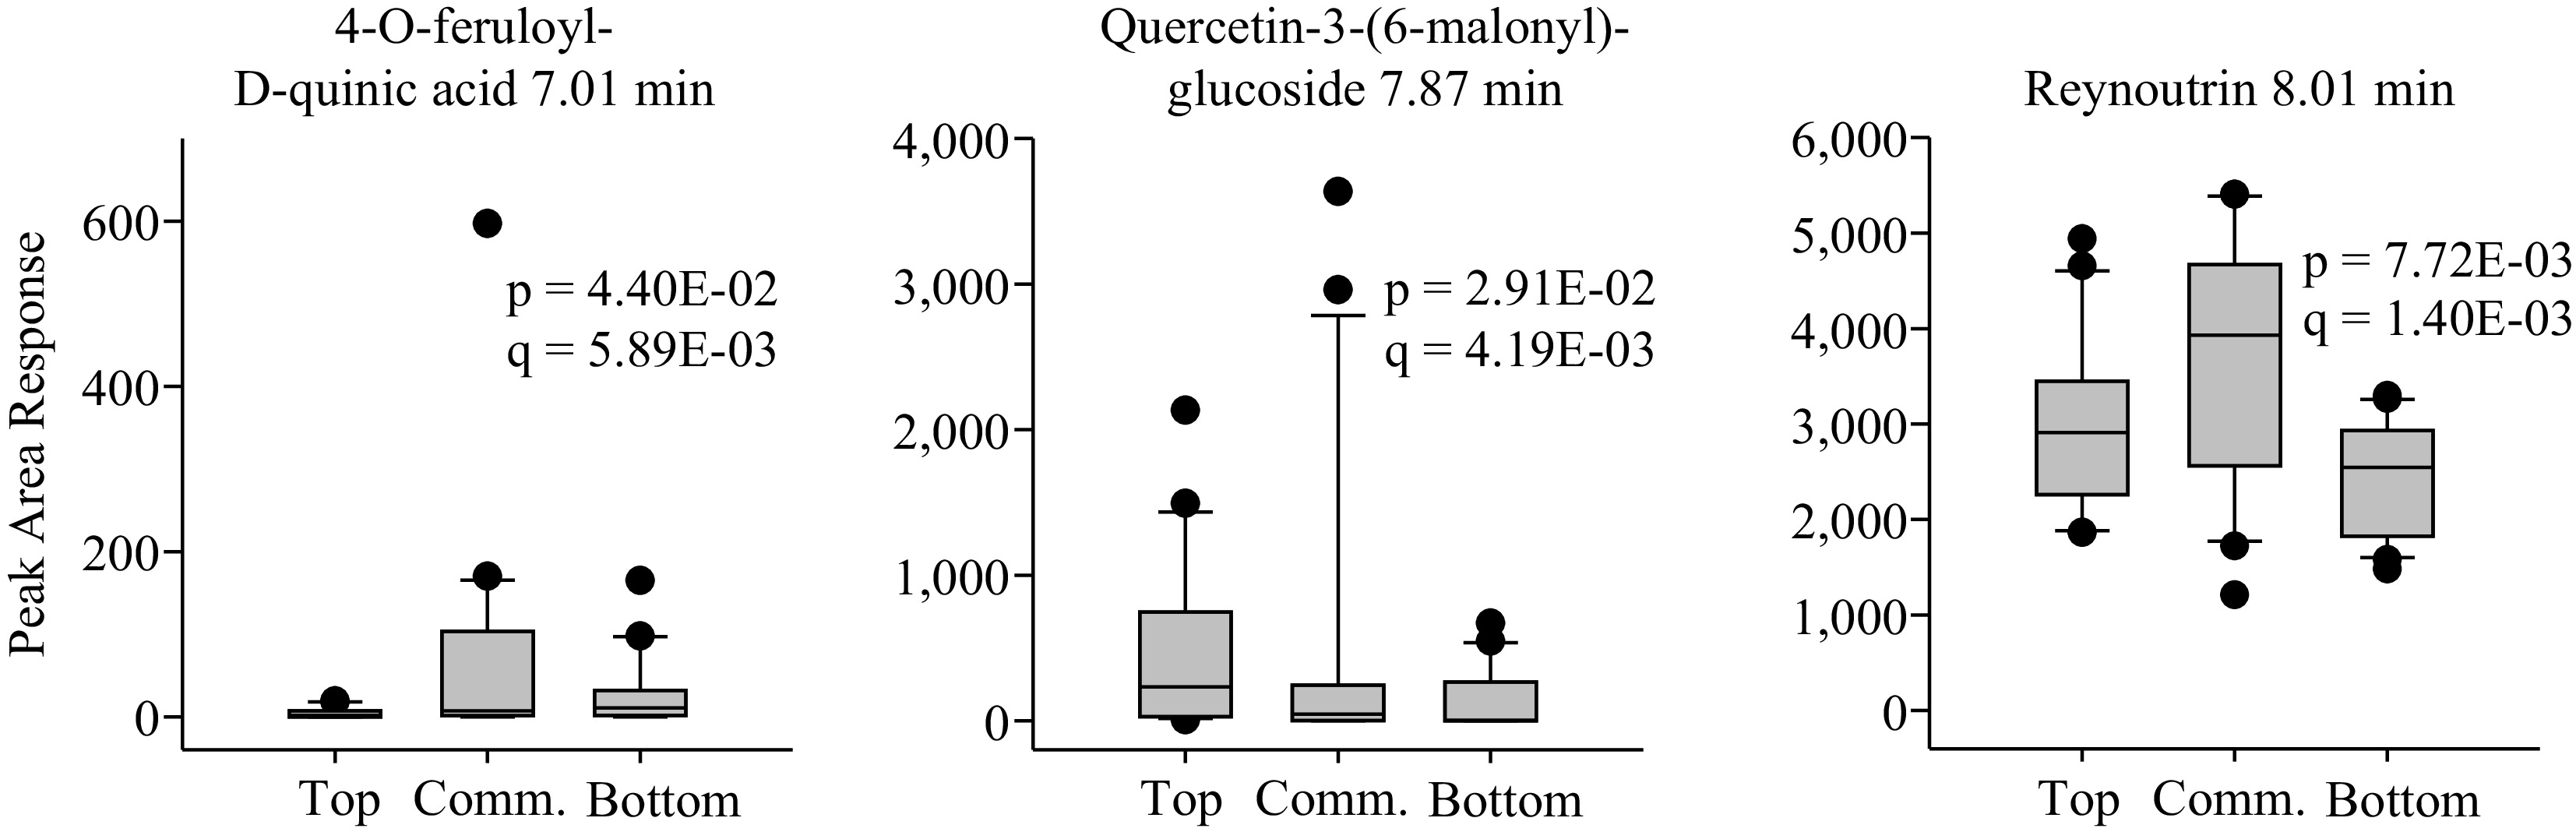
Figure 4.
Boxplots of apple phenolic compounds significantly more abundant in the commercial TPC and TAC group as compared with the top and bottom groups. The statistics p and q represent the unadjusted and multiple means corrected significance values, respectively, for a variance analysis comparing the effects of apple group on phenolic compound content.
-
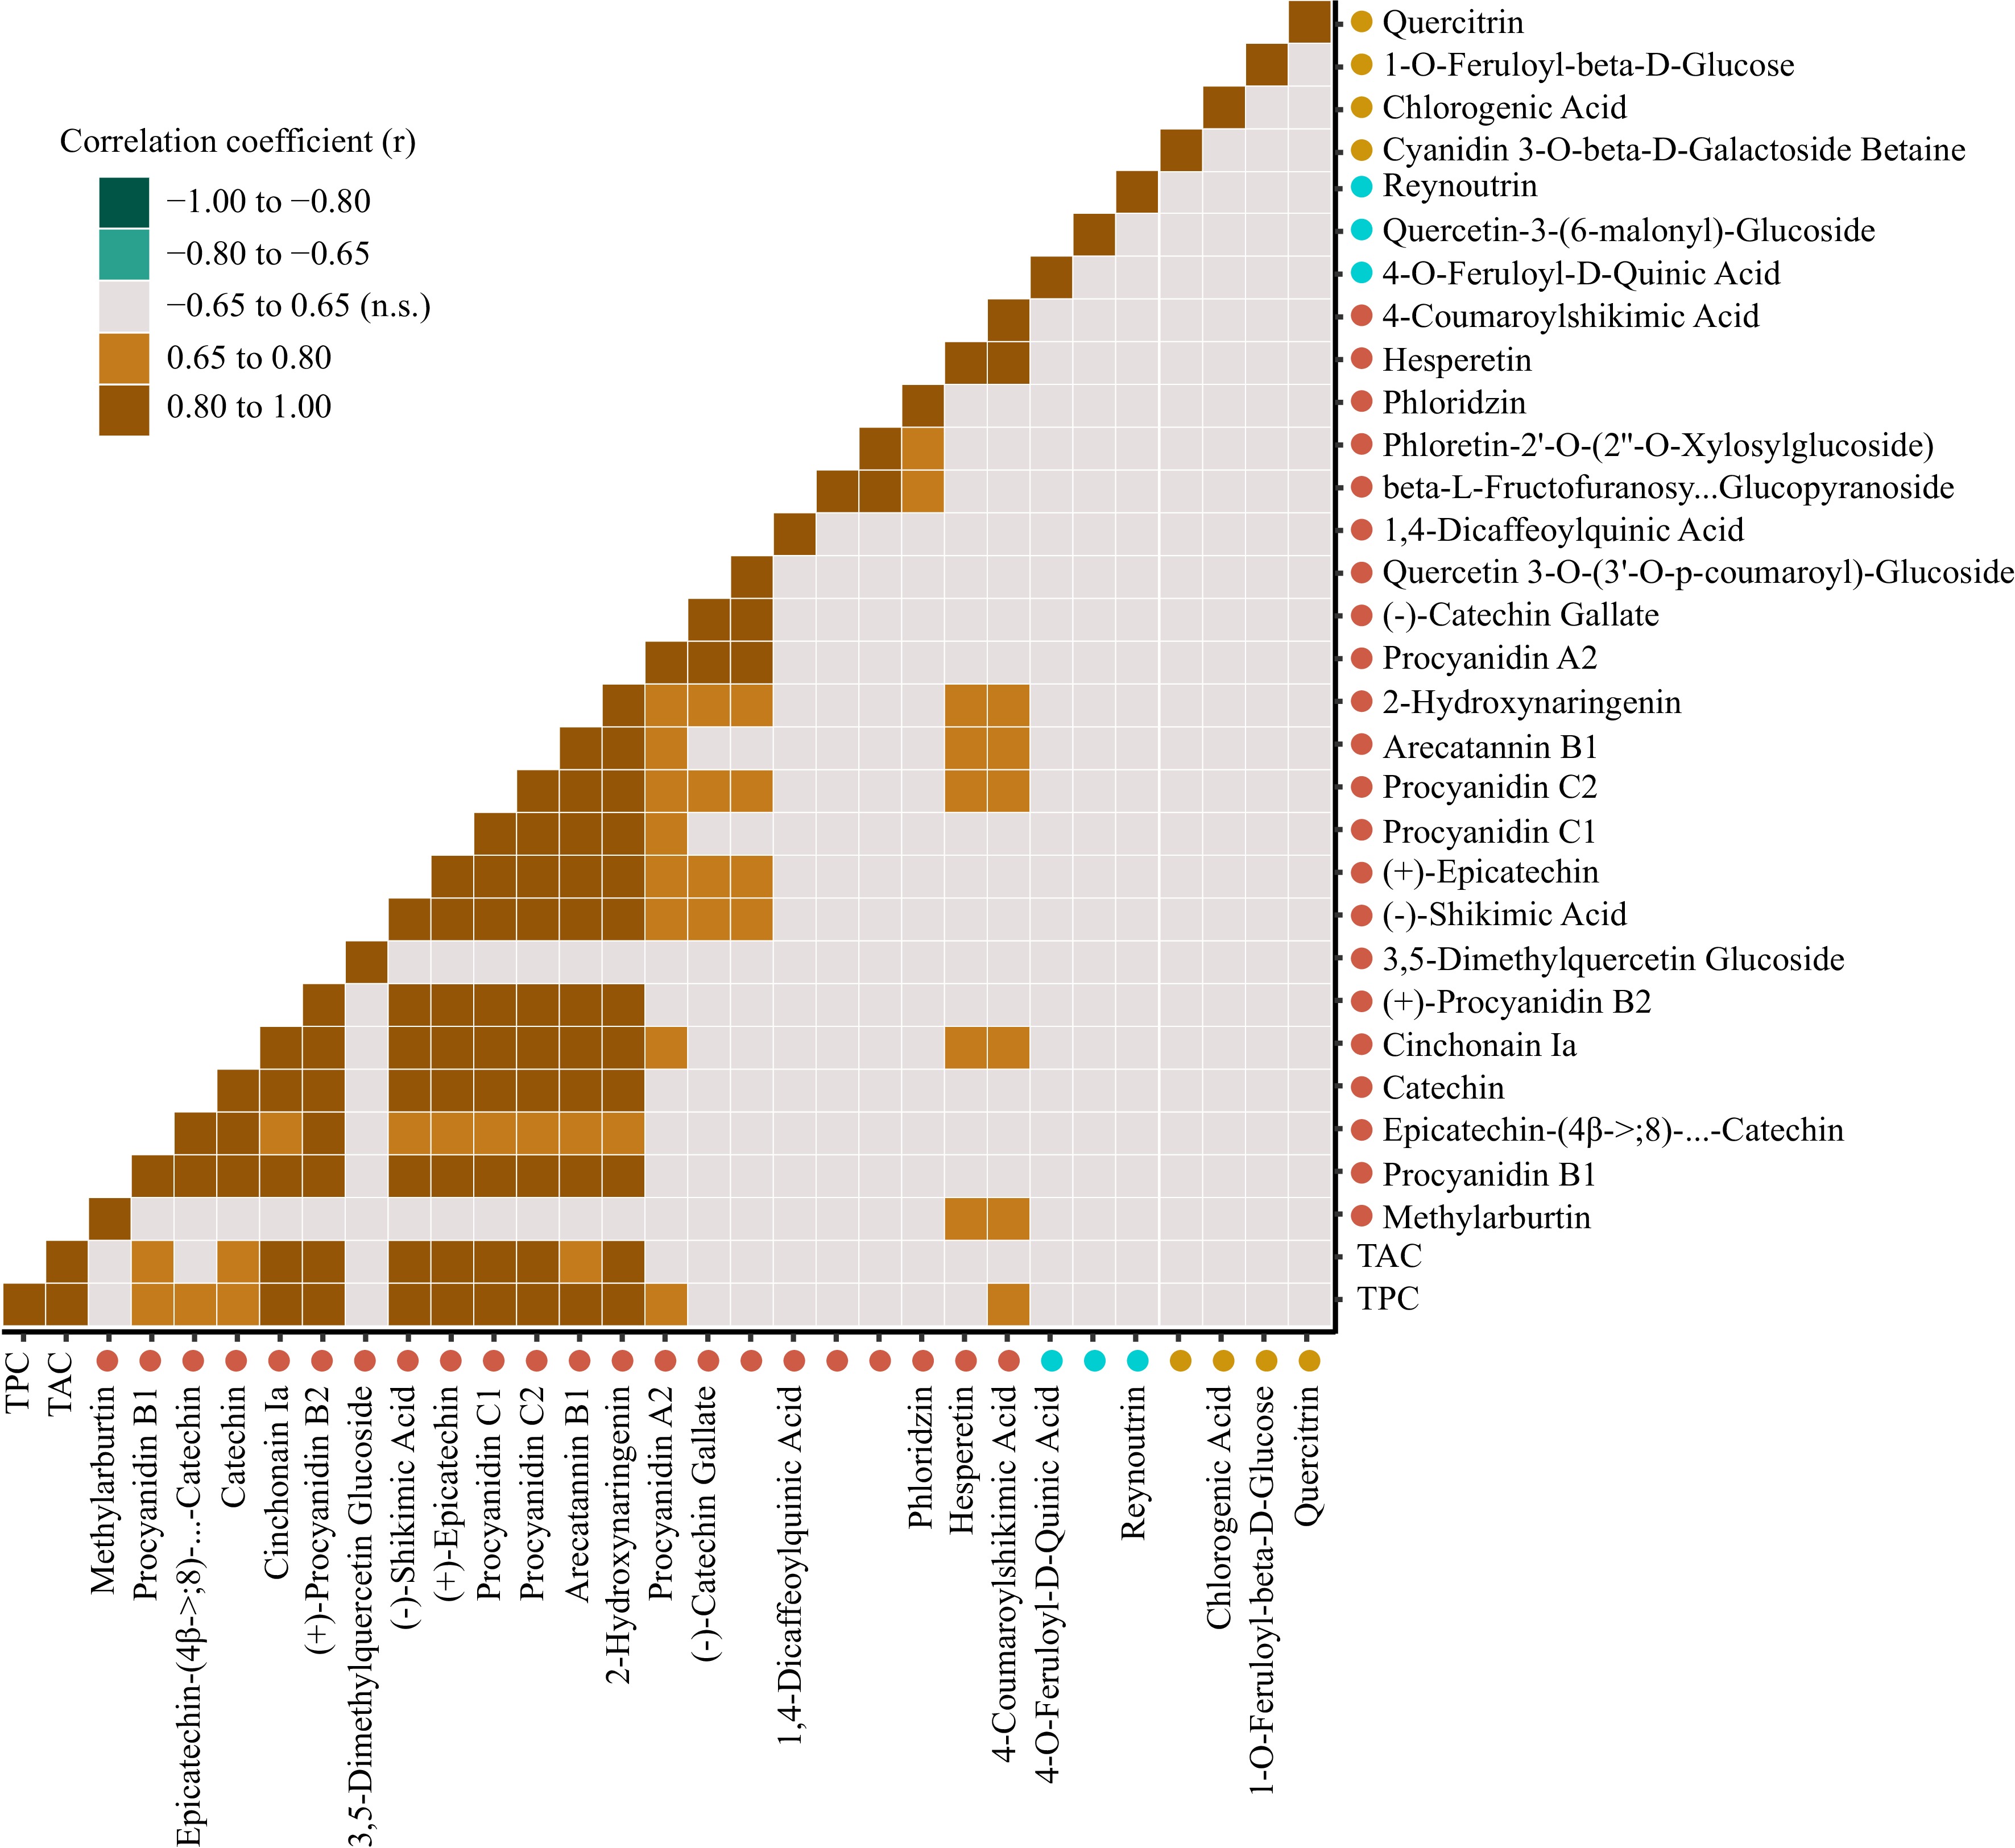
Figure 5.
Pearson correlations between the phenolic compounds significantly associated with top total TPC and TAC apples (red dots), bottom TPC and TAC apples (yellow dots), or commercial apple cultivars (blue dots). Pearson correlation coefficients significant at α = 0.05 are shown.
-
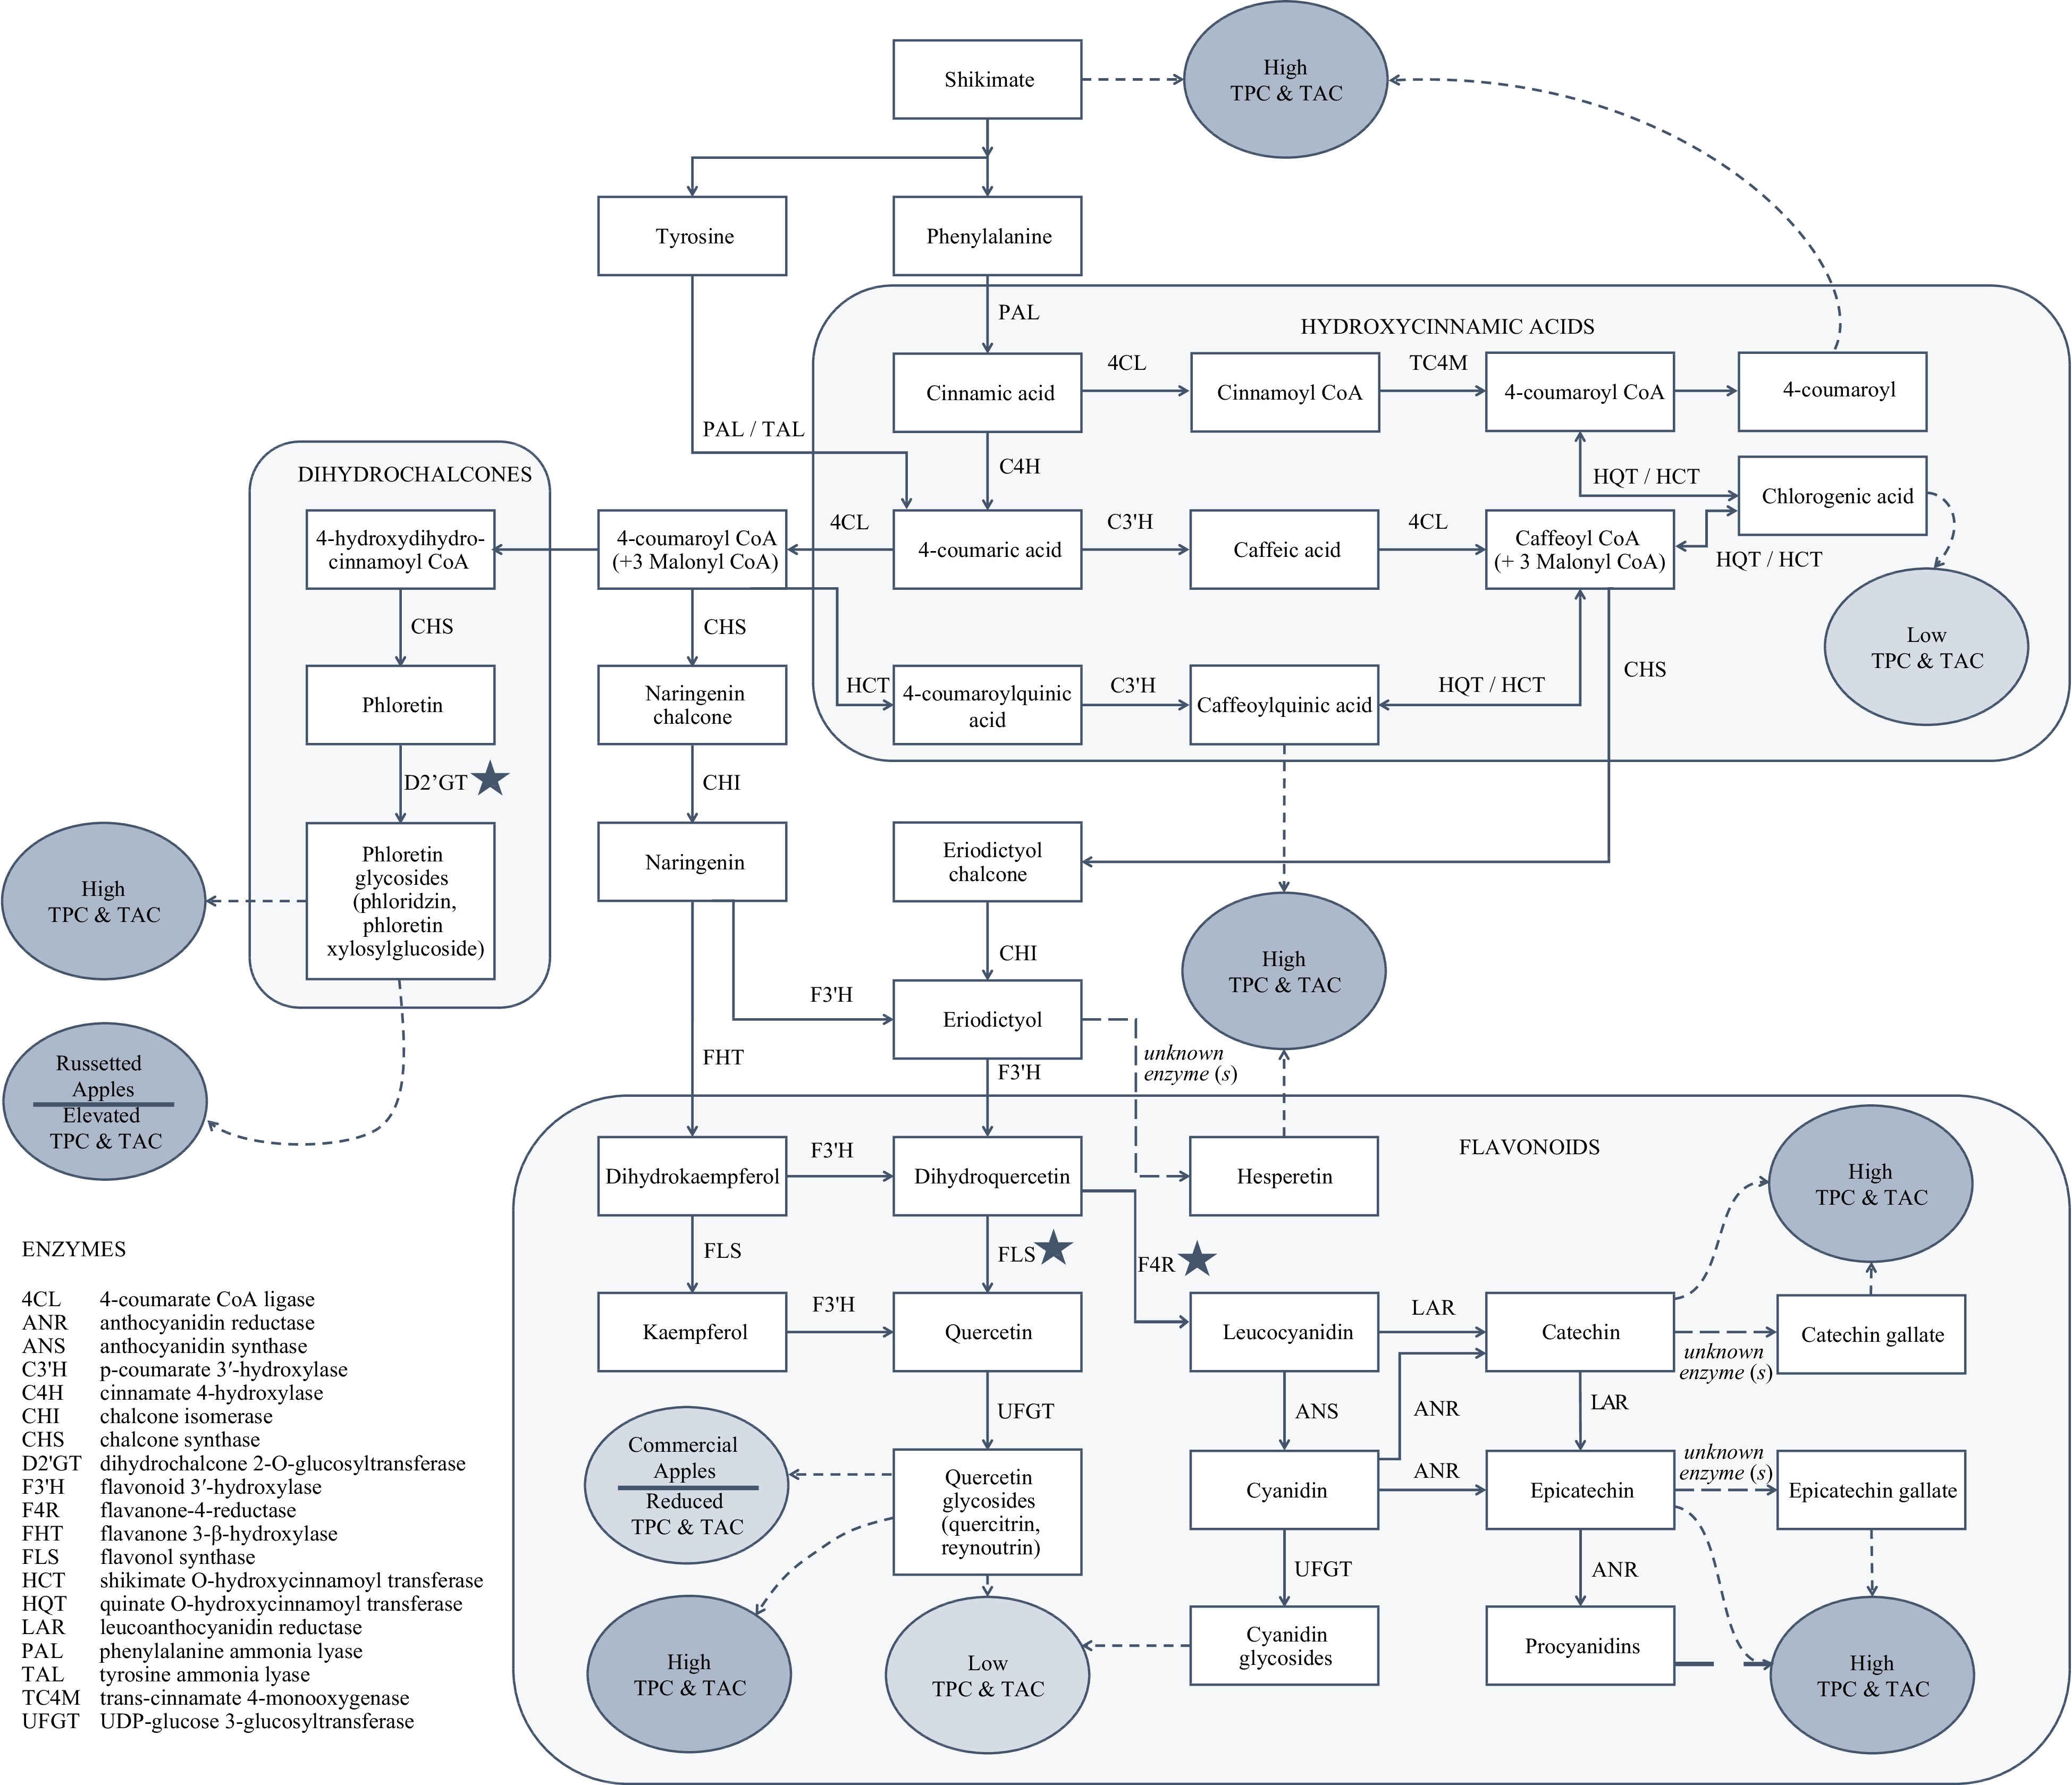
Figure 6.
Diagram of the main phenolic compounds and classes detected in apples with high total phenolic content (TPC) and high total antioxidant capacity (TAC) vs apples with low TPC and TAC. Biosynthetic pathways are briefly depicted where known according to previous reports, including putative enzymes. The main phenolic compounds found primarily in commercial apple cultivars and in russetted apples are also listed. Starred (★) enzymes may represent key branch points between high vs low TPC and TAC apples. The diagram is modified from Verdu et al. (diagram structure) [14], Liao et al. (LAR) [35], Henry-Kirk et al. (LAR and ANR) [16], Liao et al. [40] and Hoffmann et al. [39] (HCT / HQT), KEGG pathways[47].
Figures
(6)
Tables
(0)