-
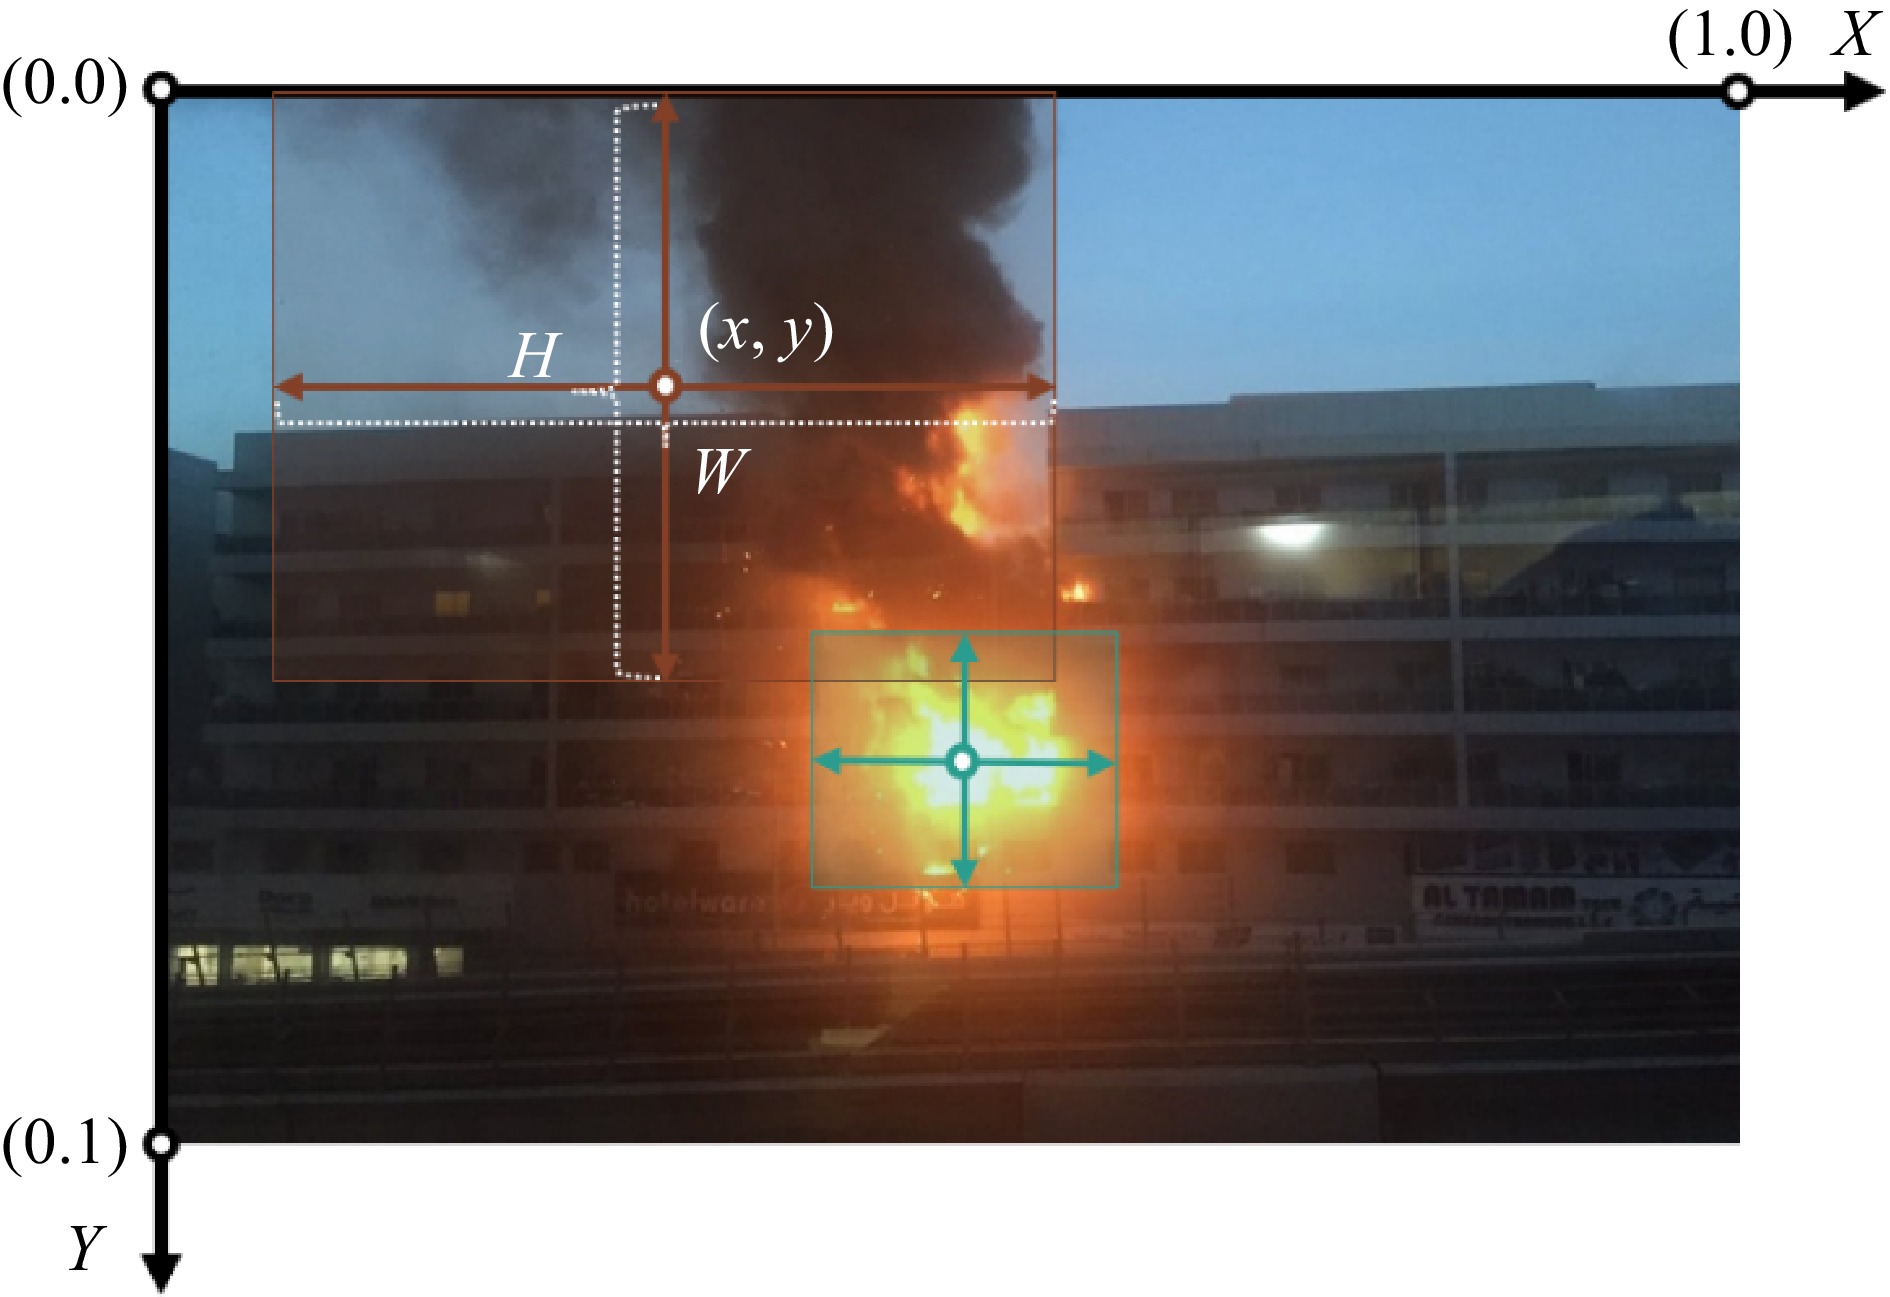
Figure 1.
Relationship between labeling parameters and image.
-
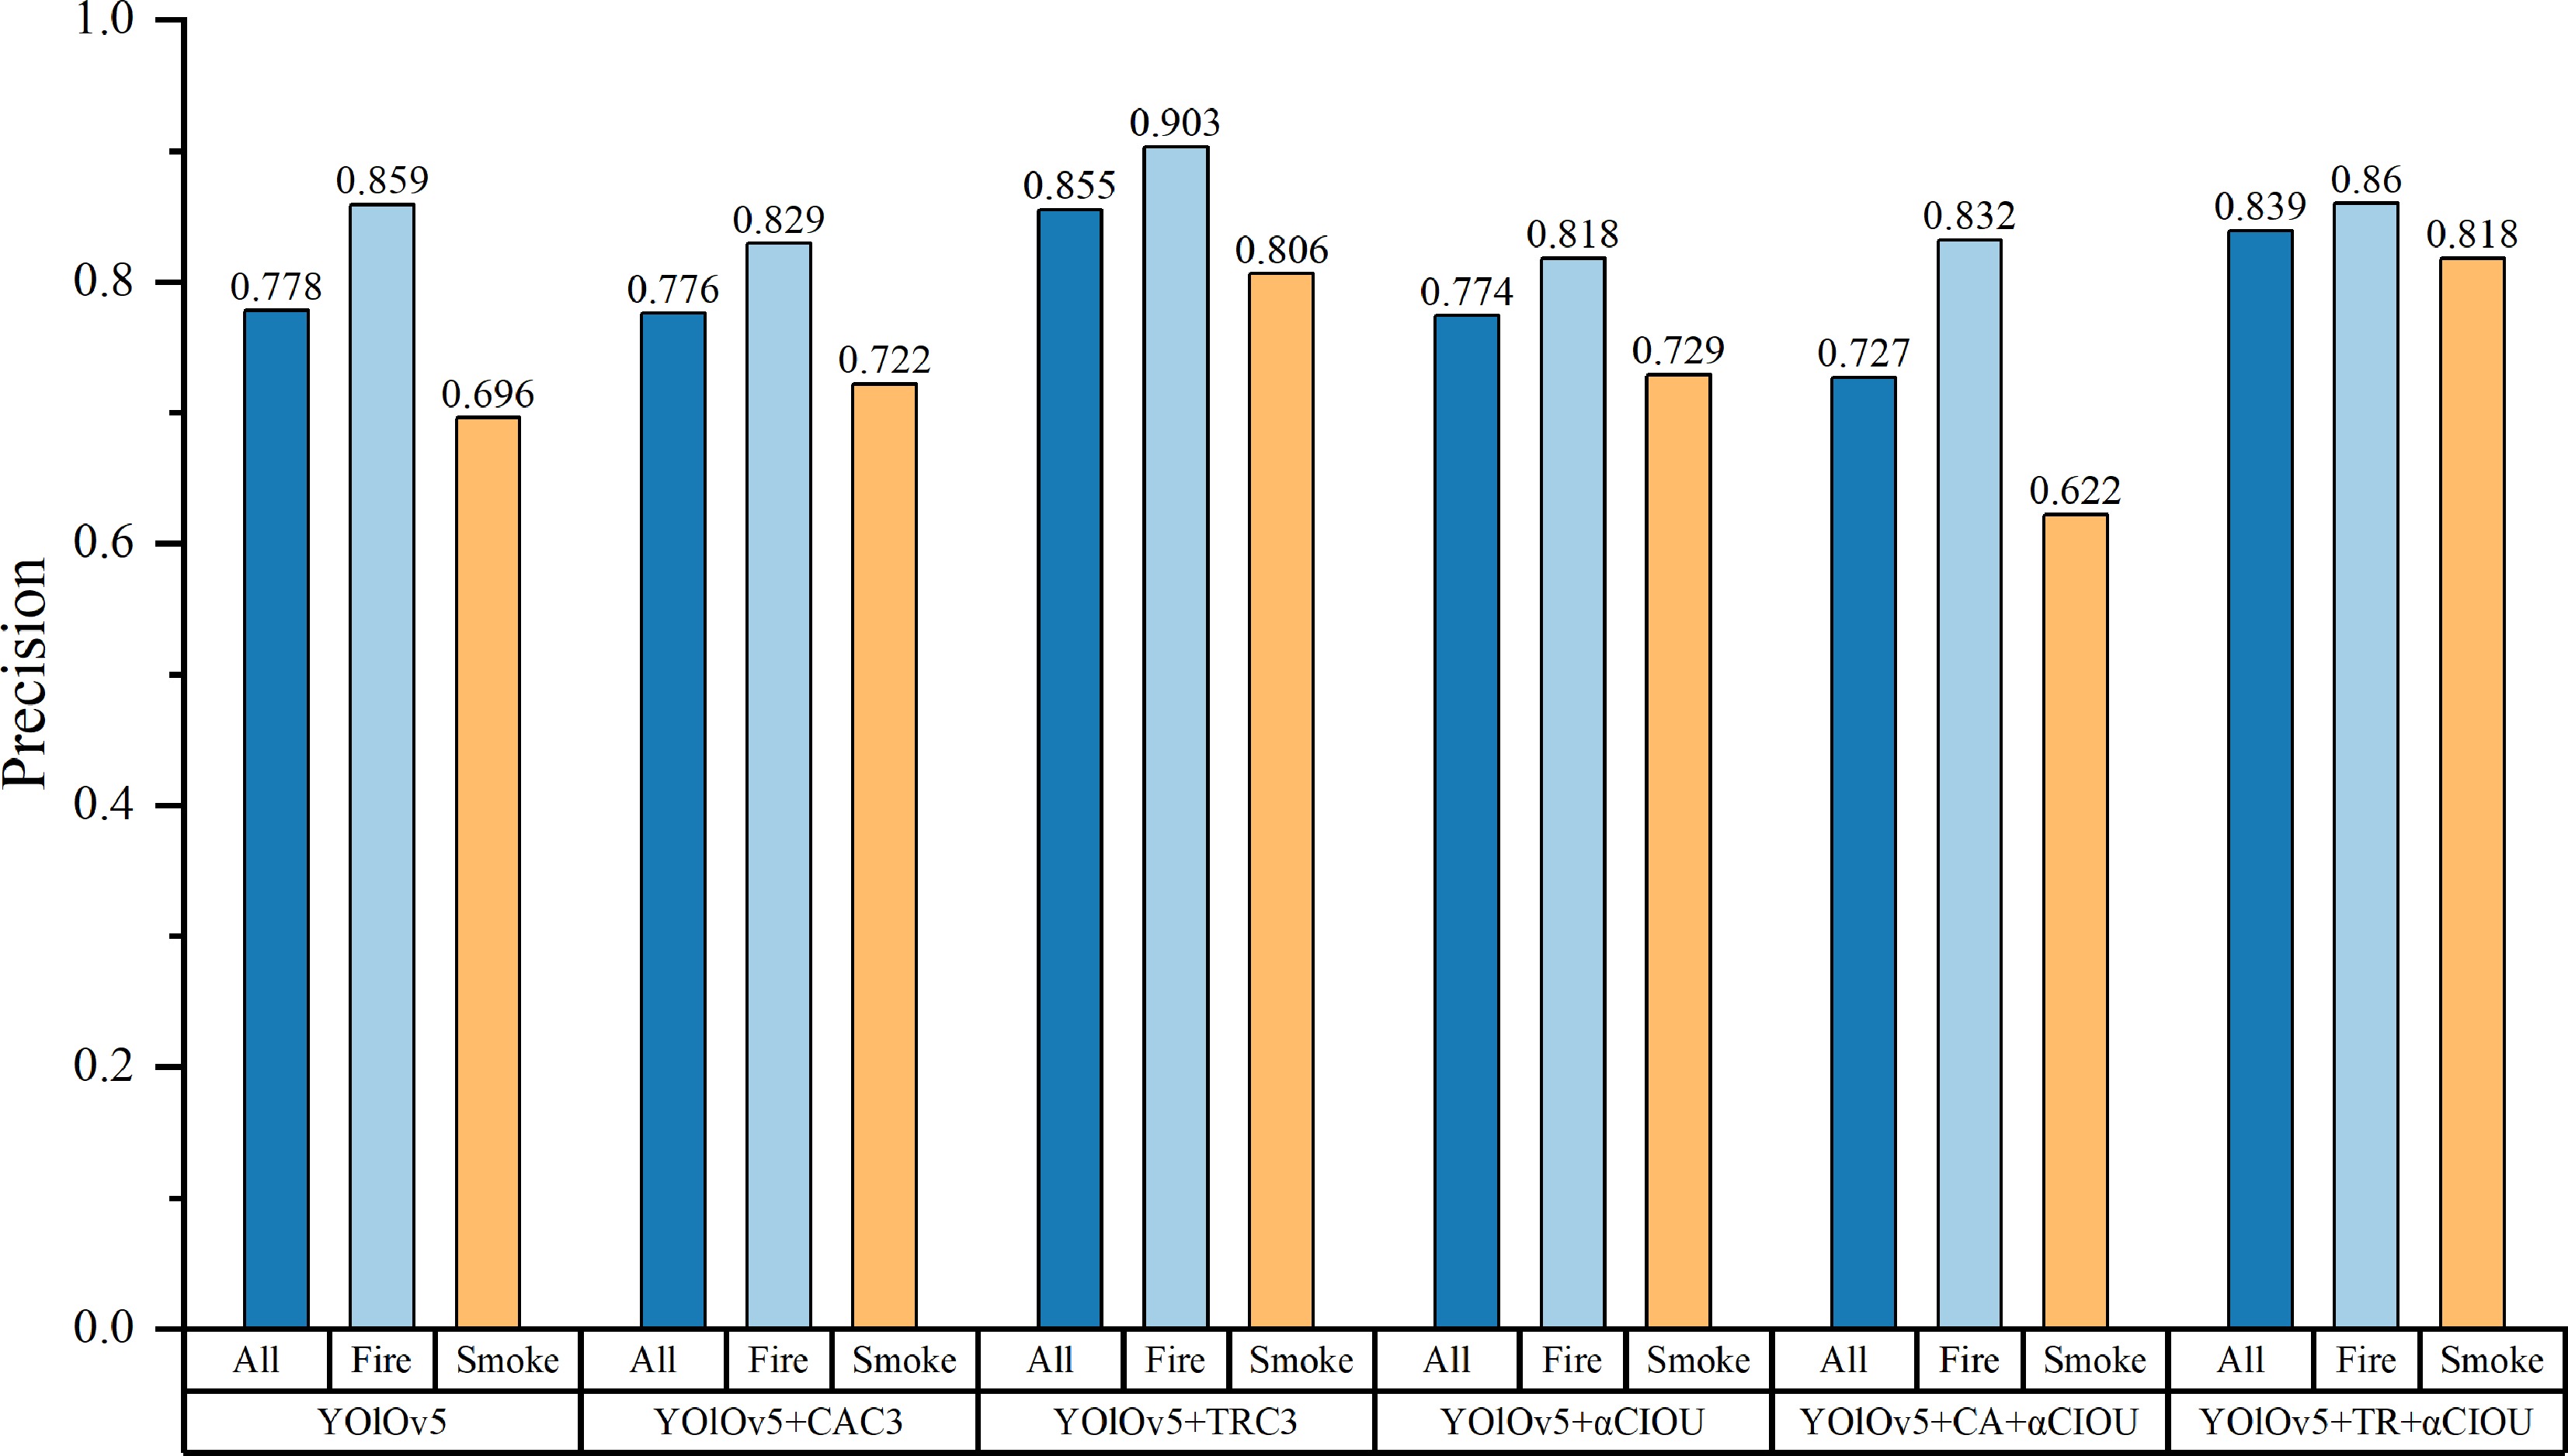
Figure 2.
Precision of fire and smoke detection in the six algorithms.
-
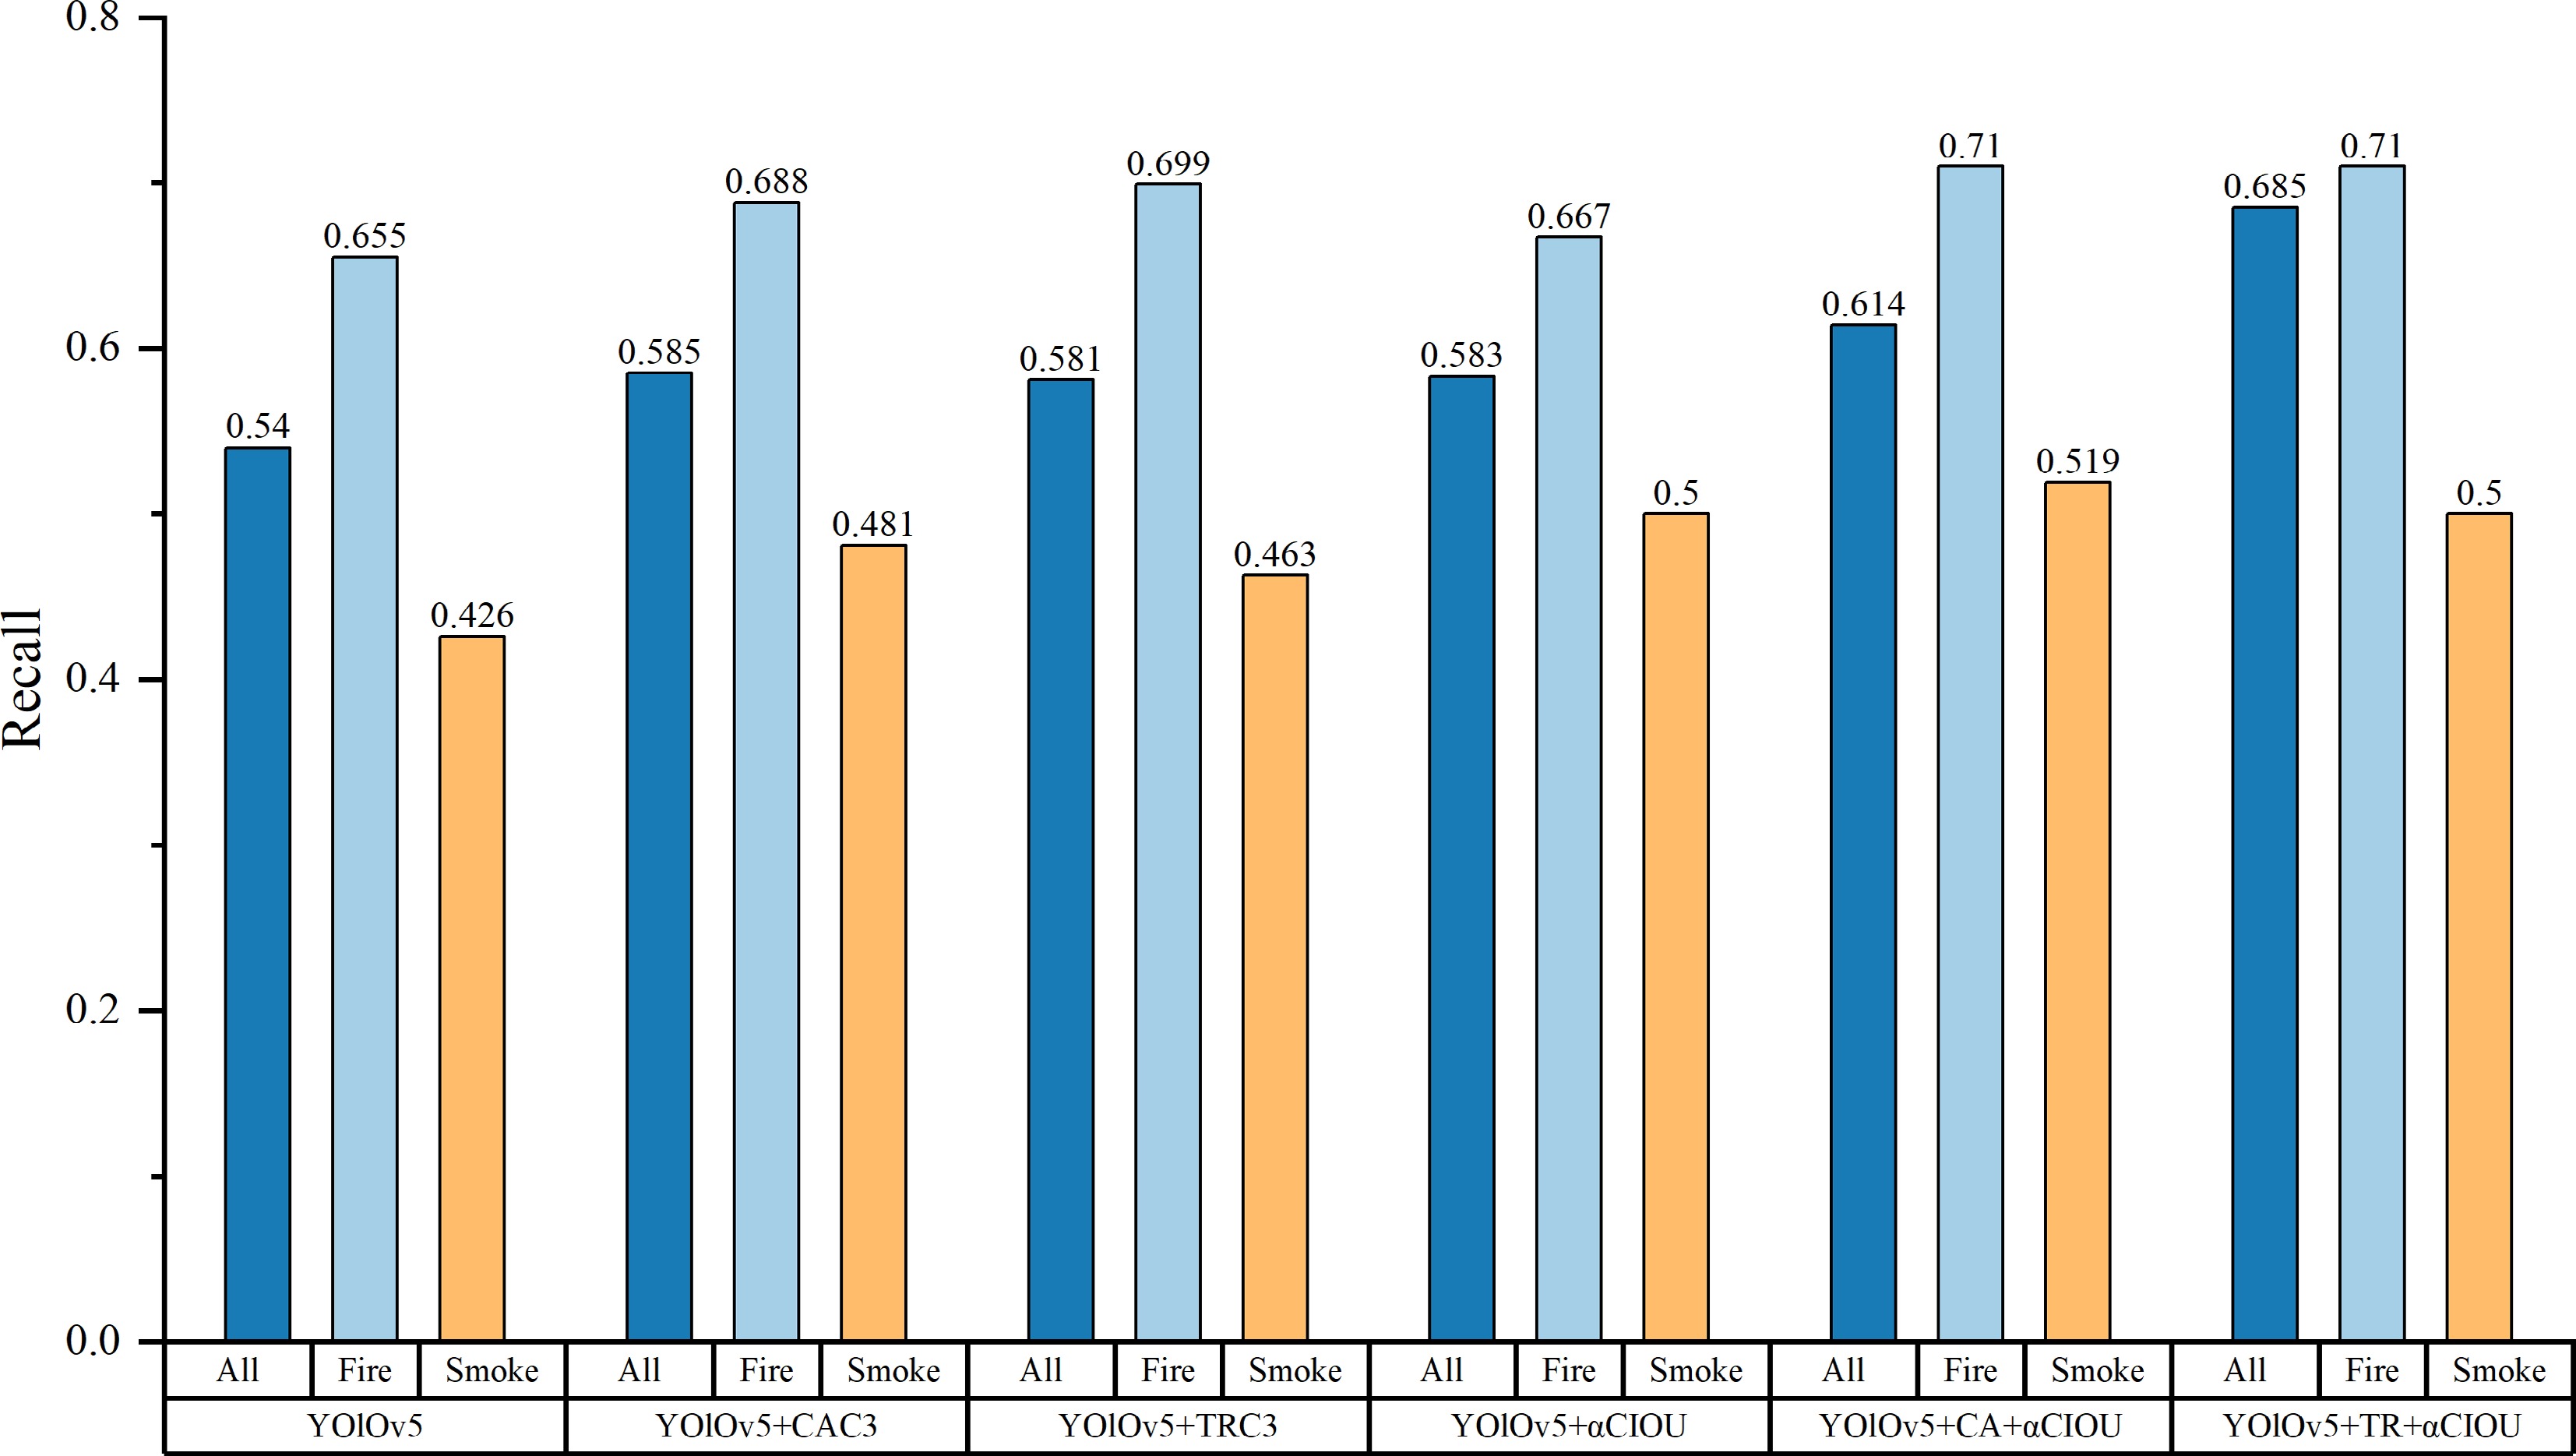
Figure 3.
Recall rate of fire and smoke detection in the six algorithms.
-
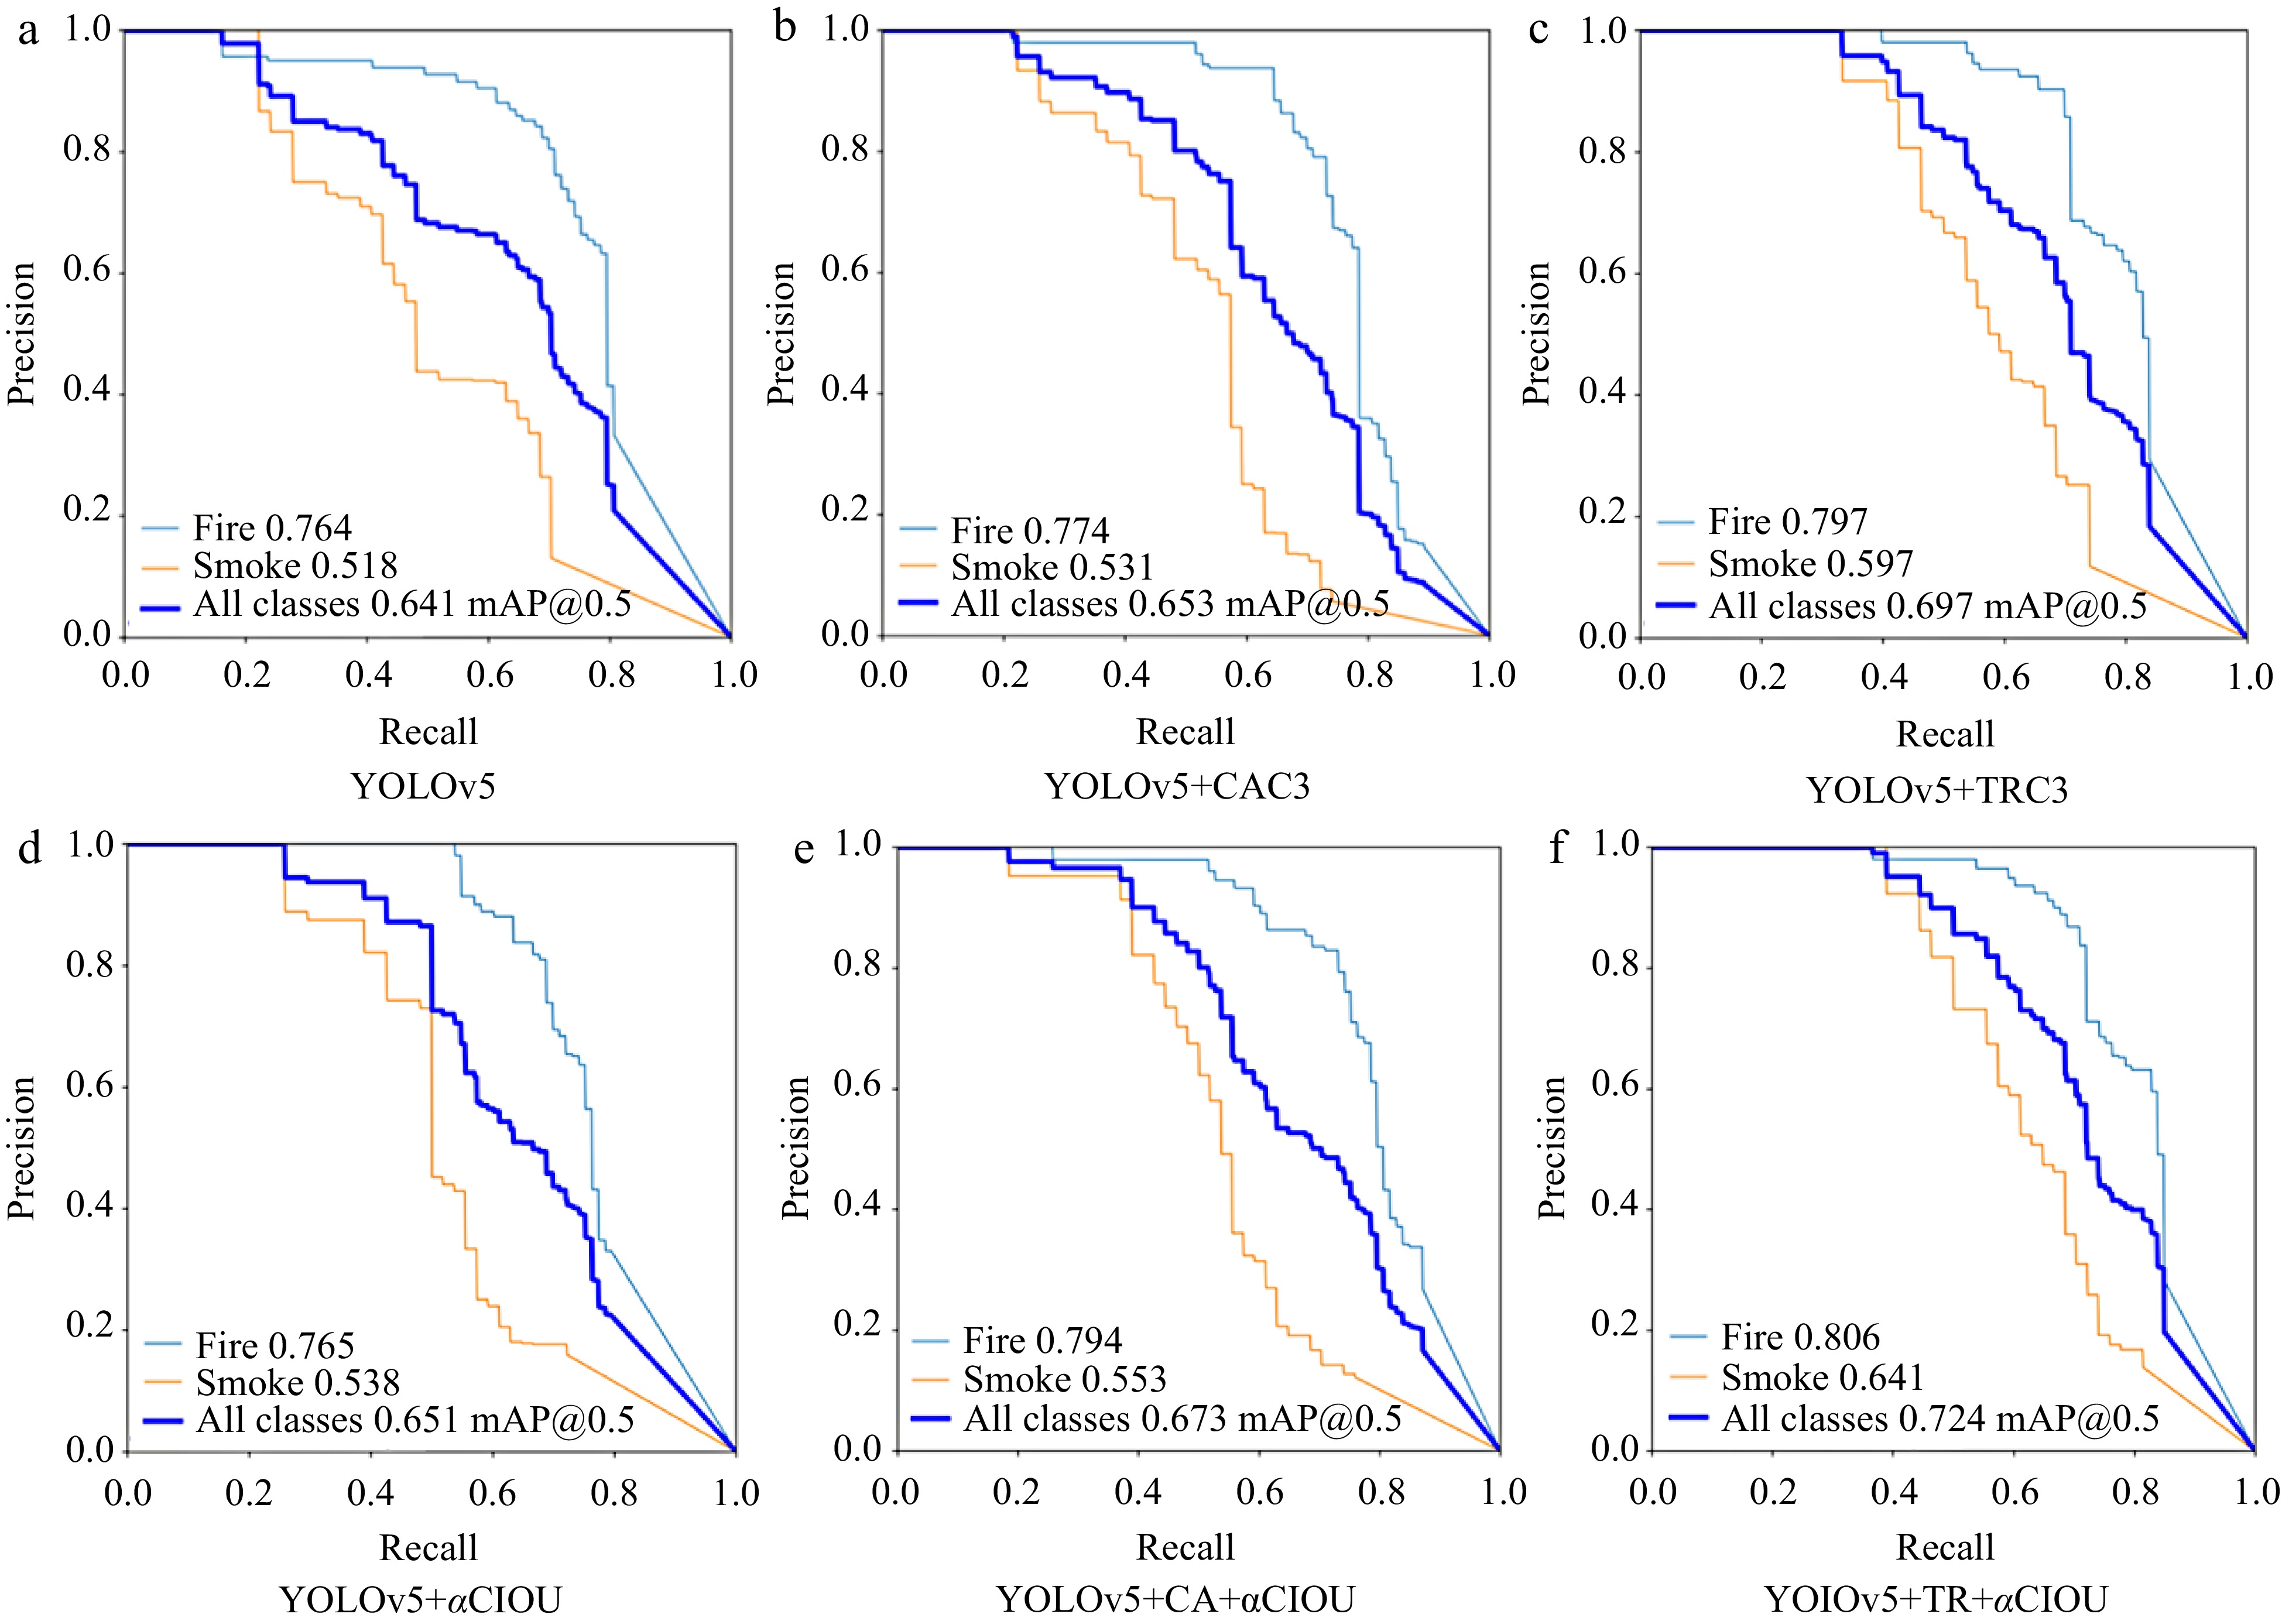
Figure 4.
Precision-Recall curves of six fire detection algorithms.
-
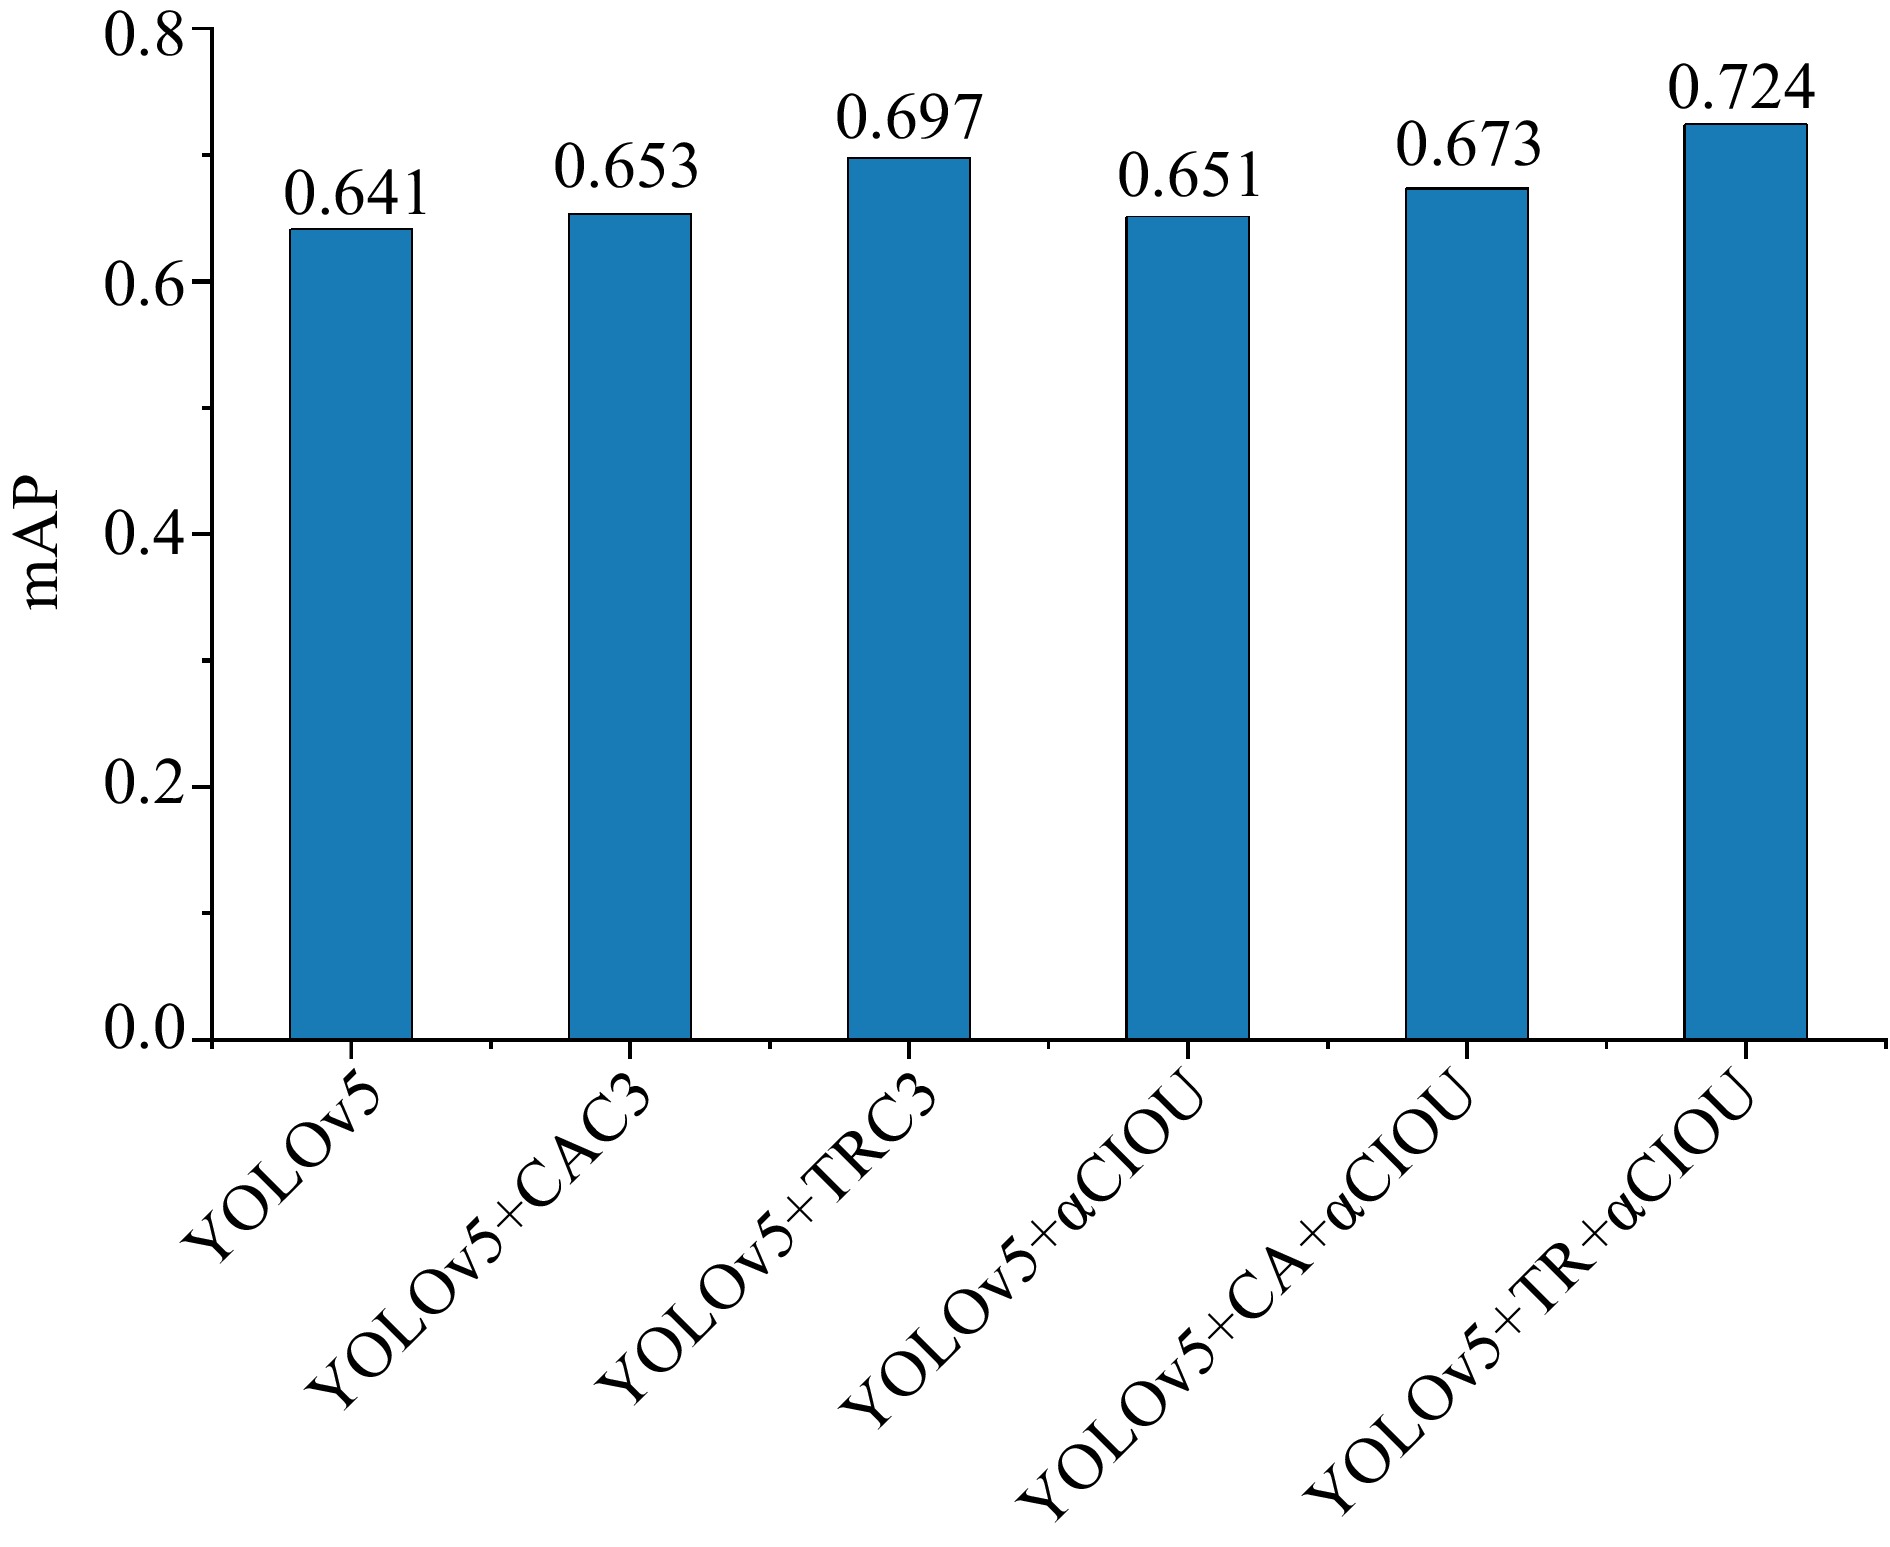
Figure 5.
mAP of the six fire detection algorithms.
-
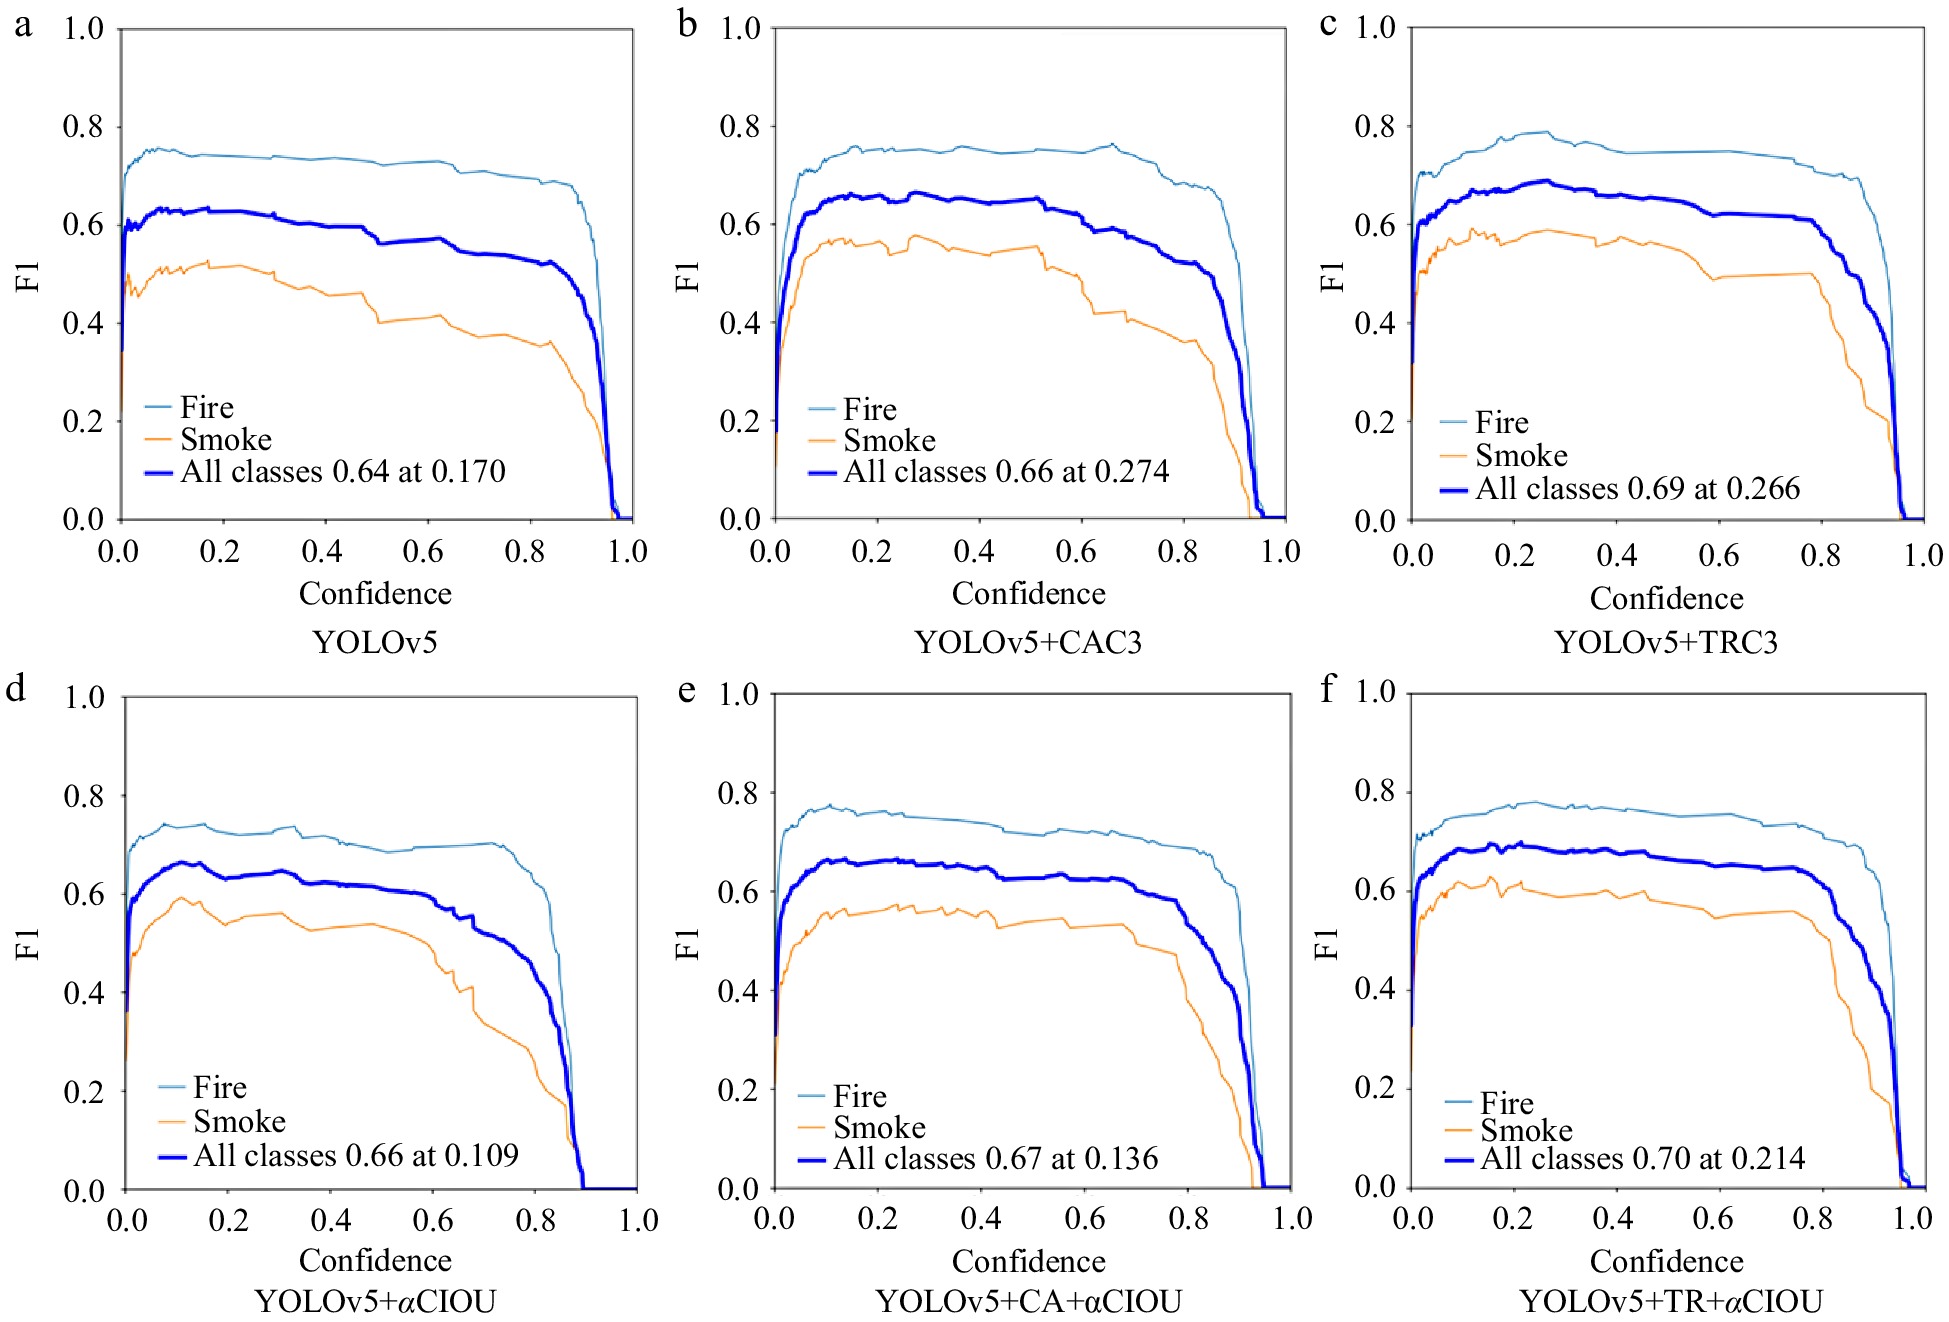
Figure 6.
F1 curves of six fire detection algorithms.
-
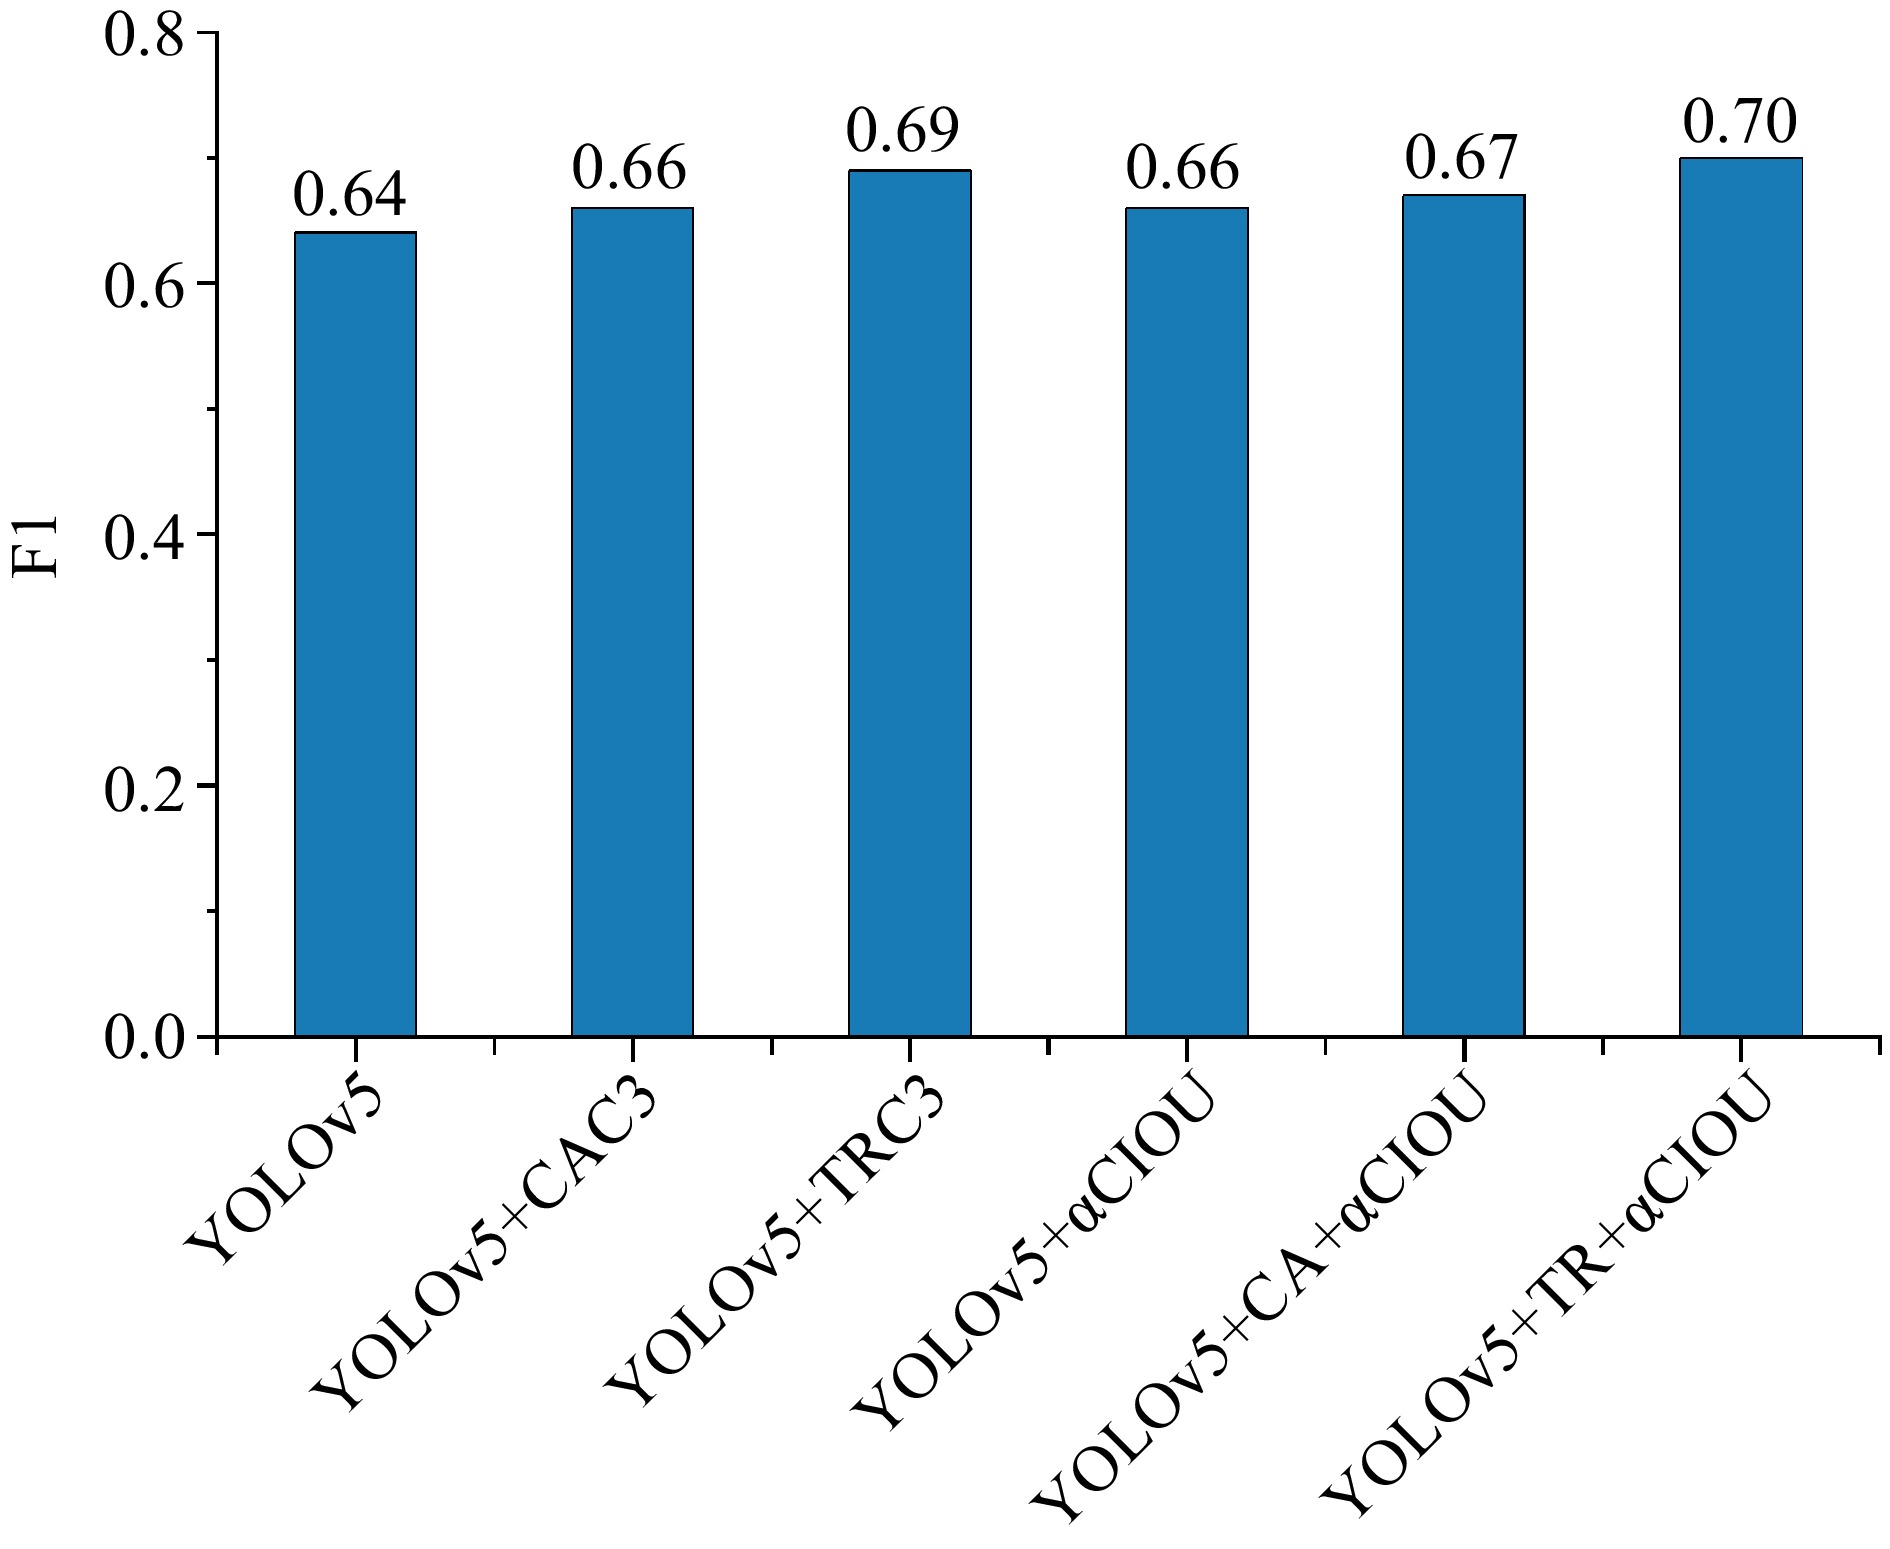
Figure 7.
F1 of six fire detection algorithms.
-
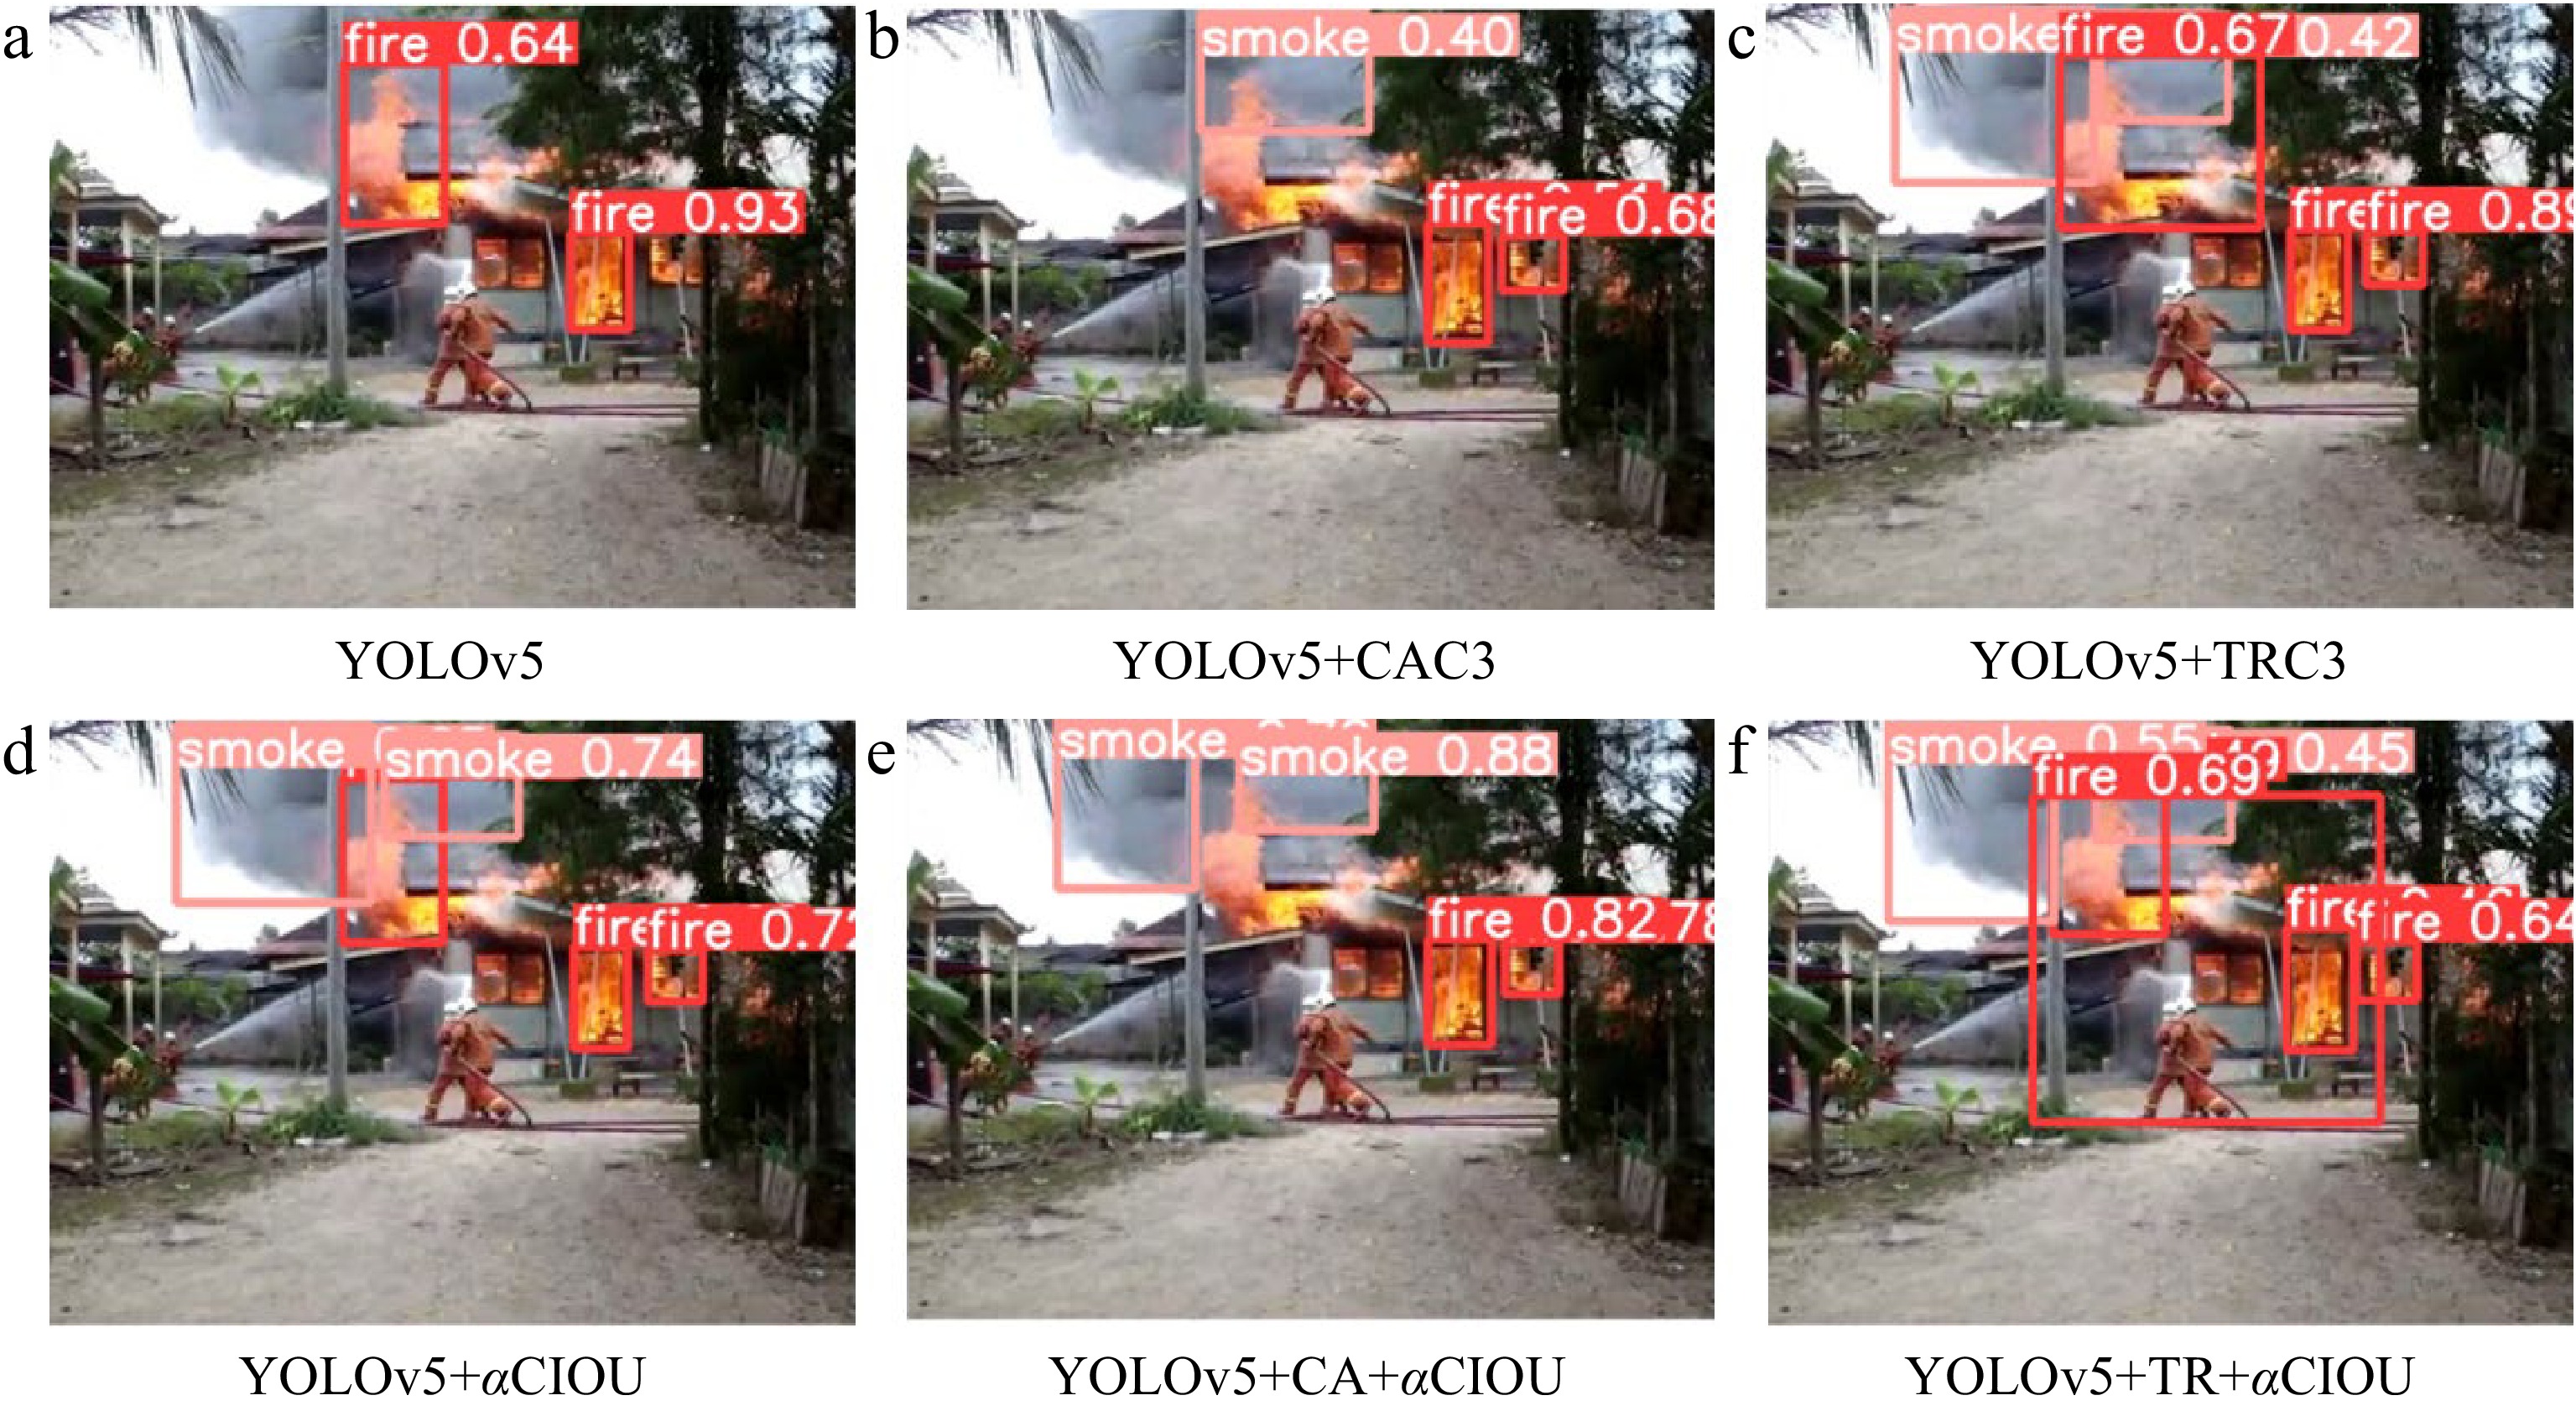
Figure 8.
Detection effect of the six algorithms for a building fire.
-
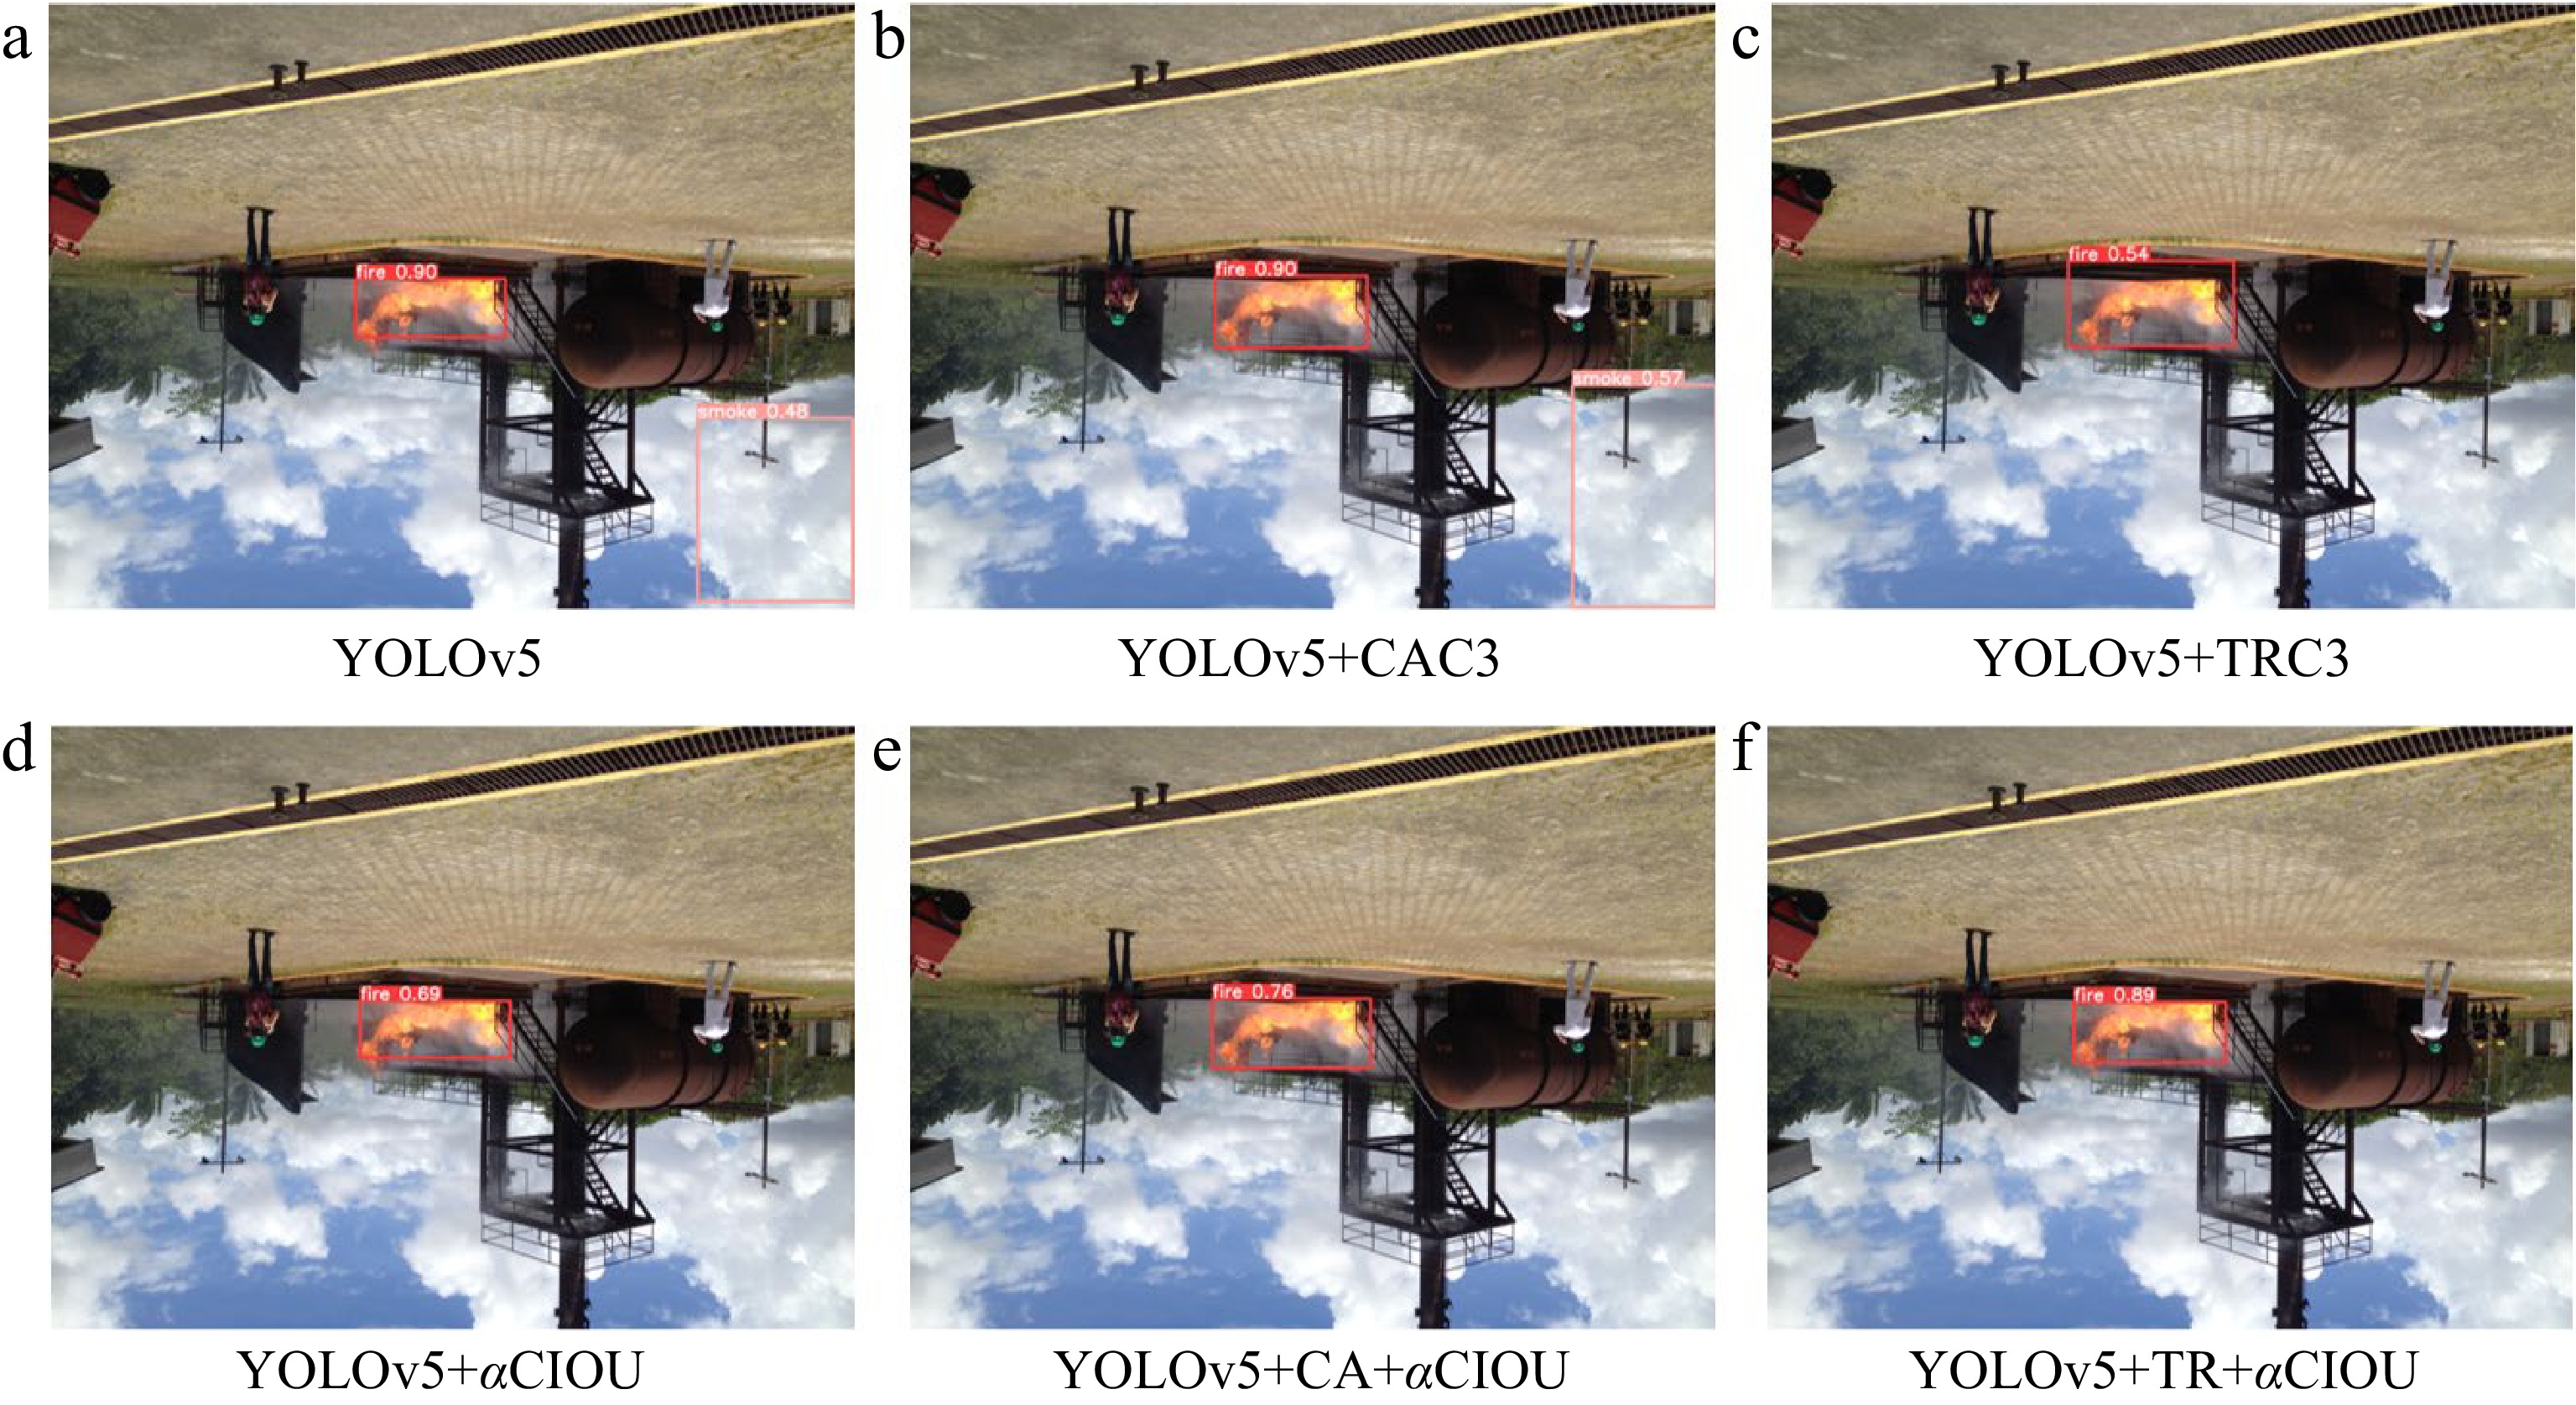
Figure 9.
Detection effect of the six algorithms for a single overturned flame.
-
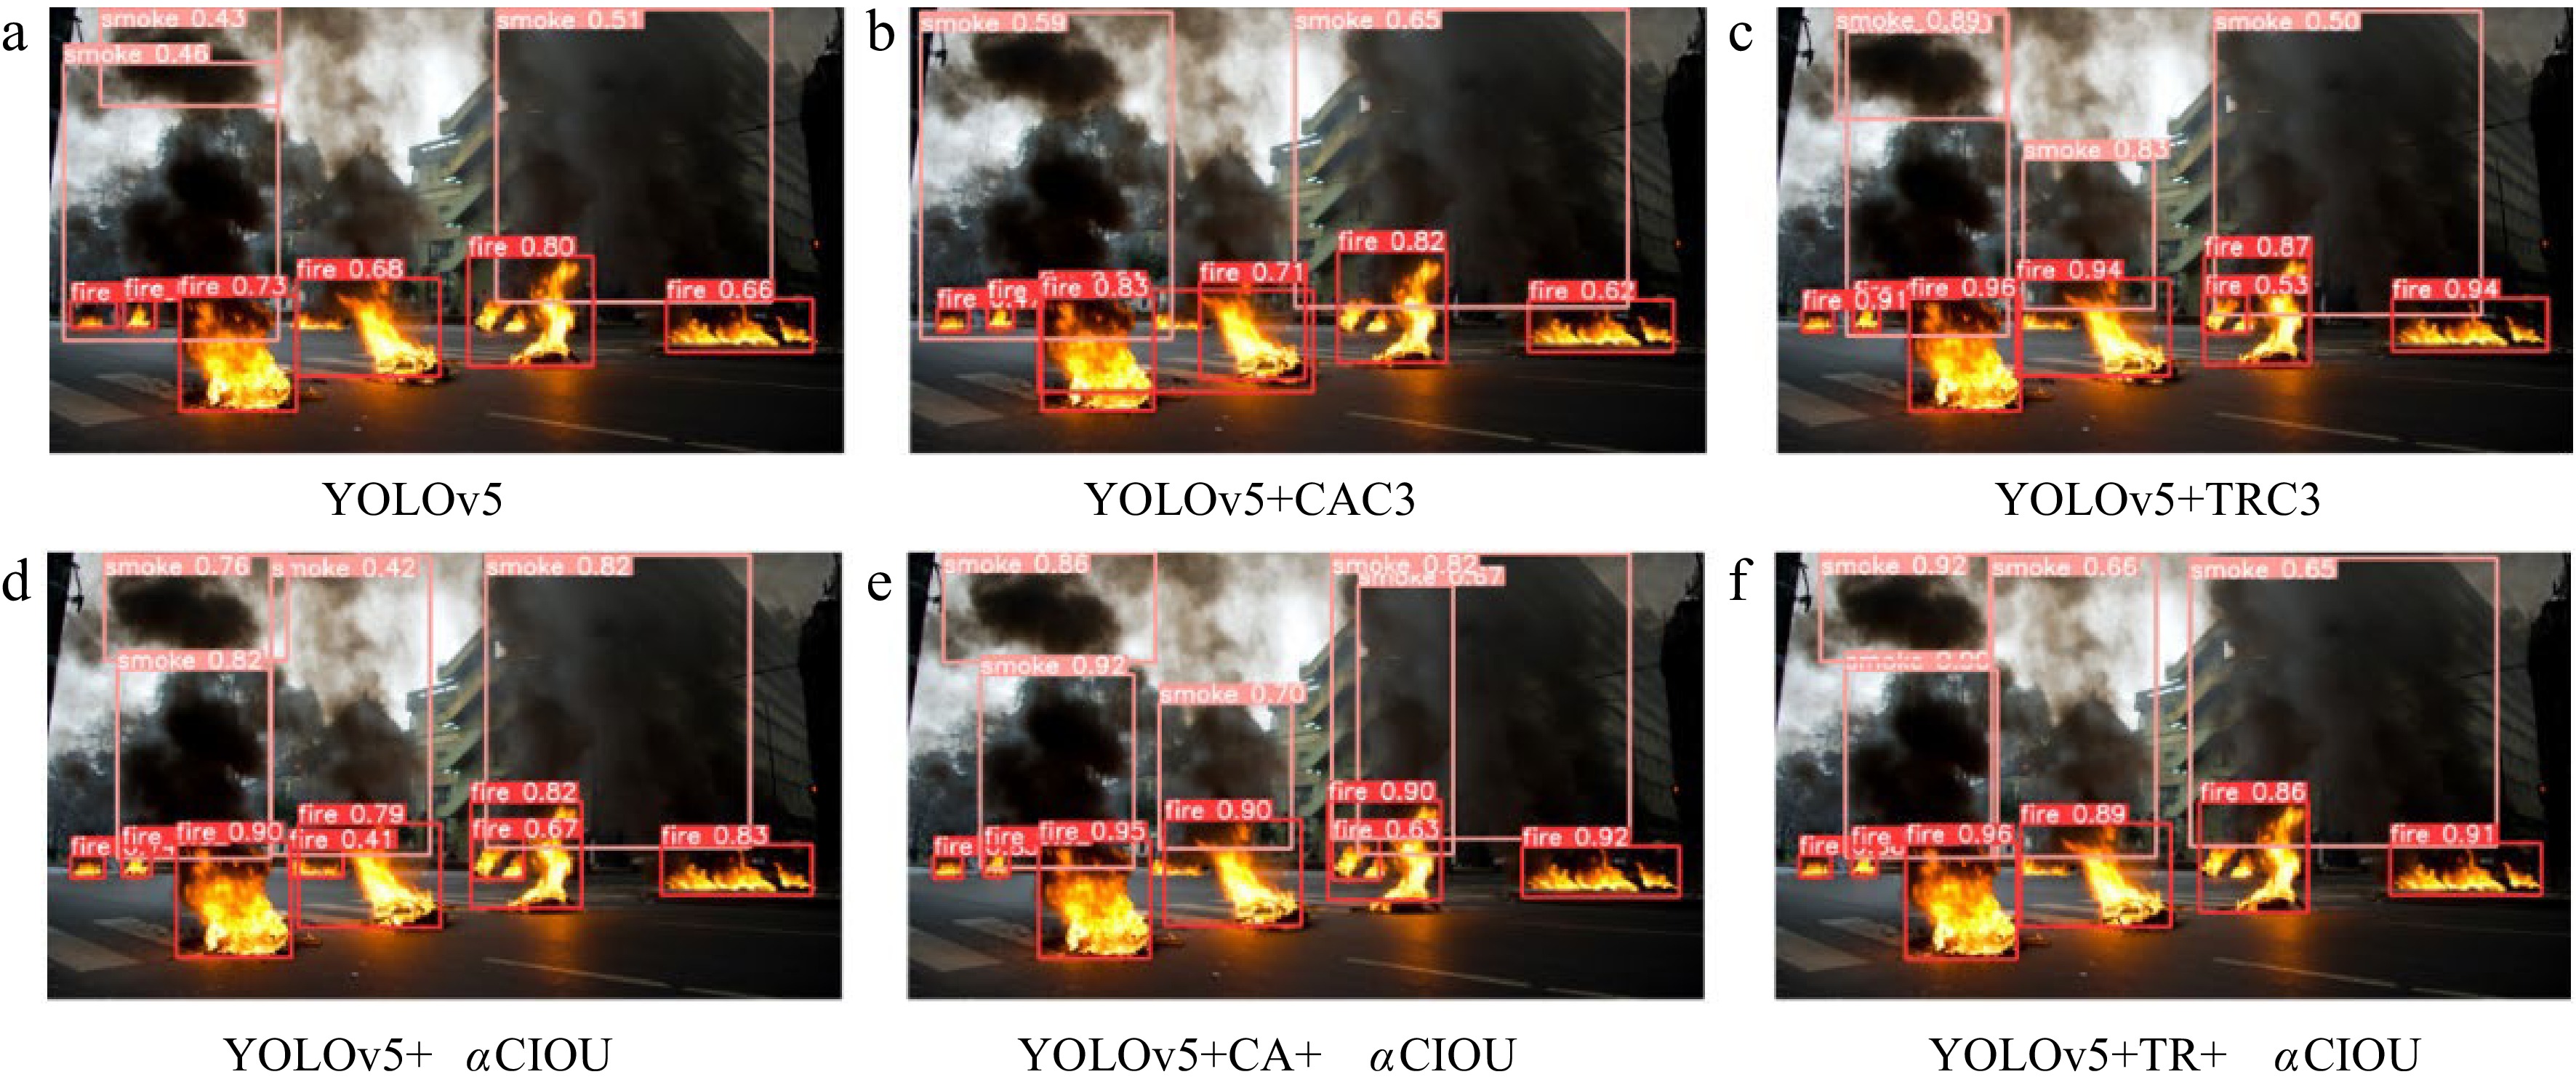
Figure 10.
Detection effect of the six algorithms for multiple fire and smoke targets.
-
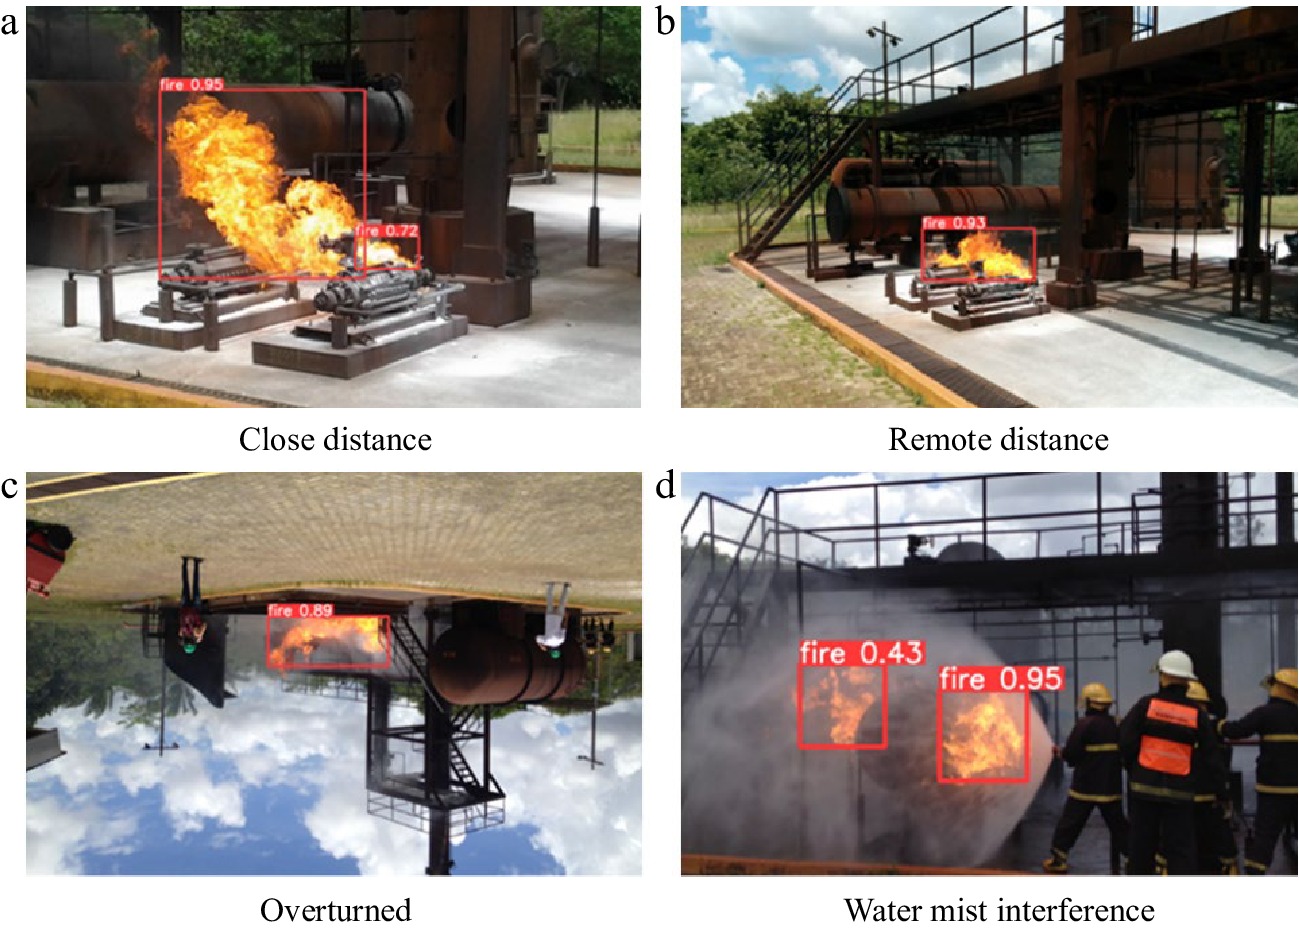
Figure 11.
Detection effect of YOLOv5 + TR + αCIOU algorithm in Bowfire dataset.
-
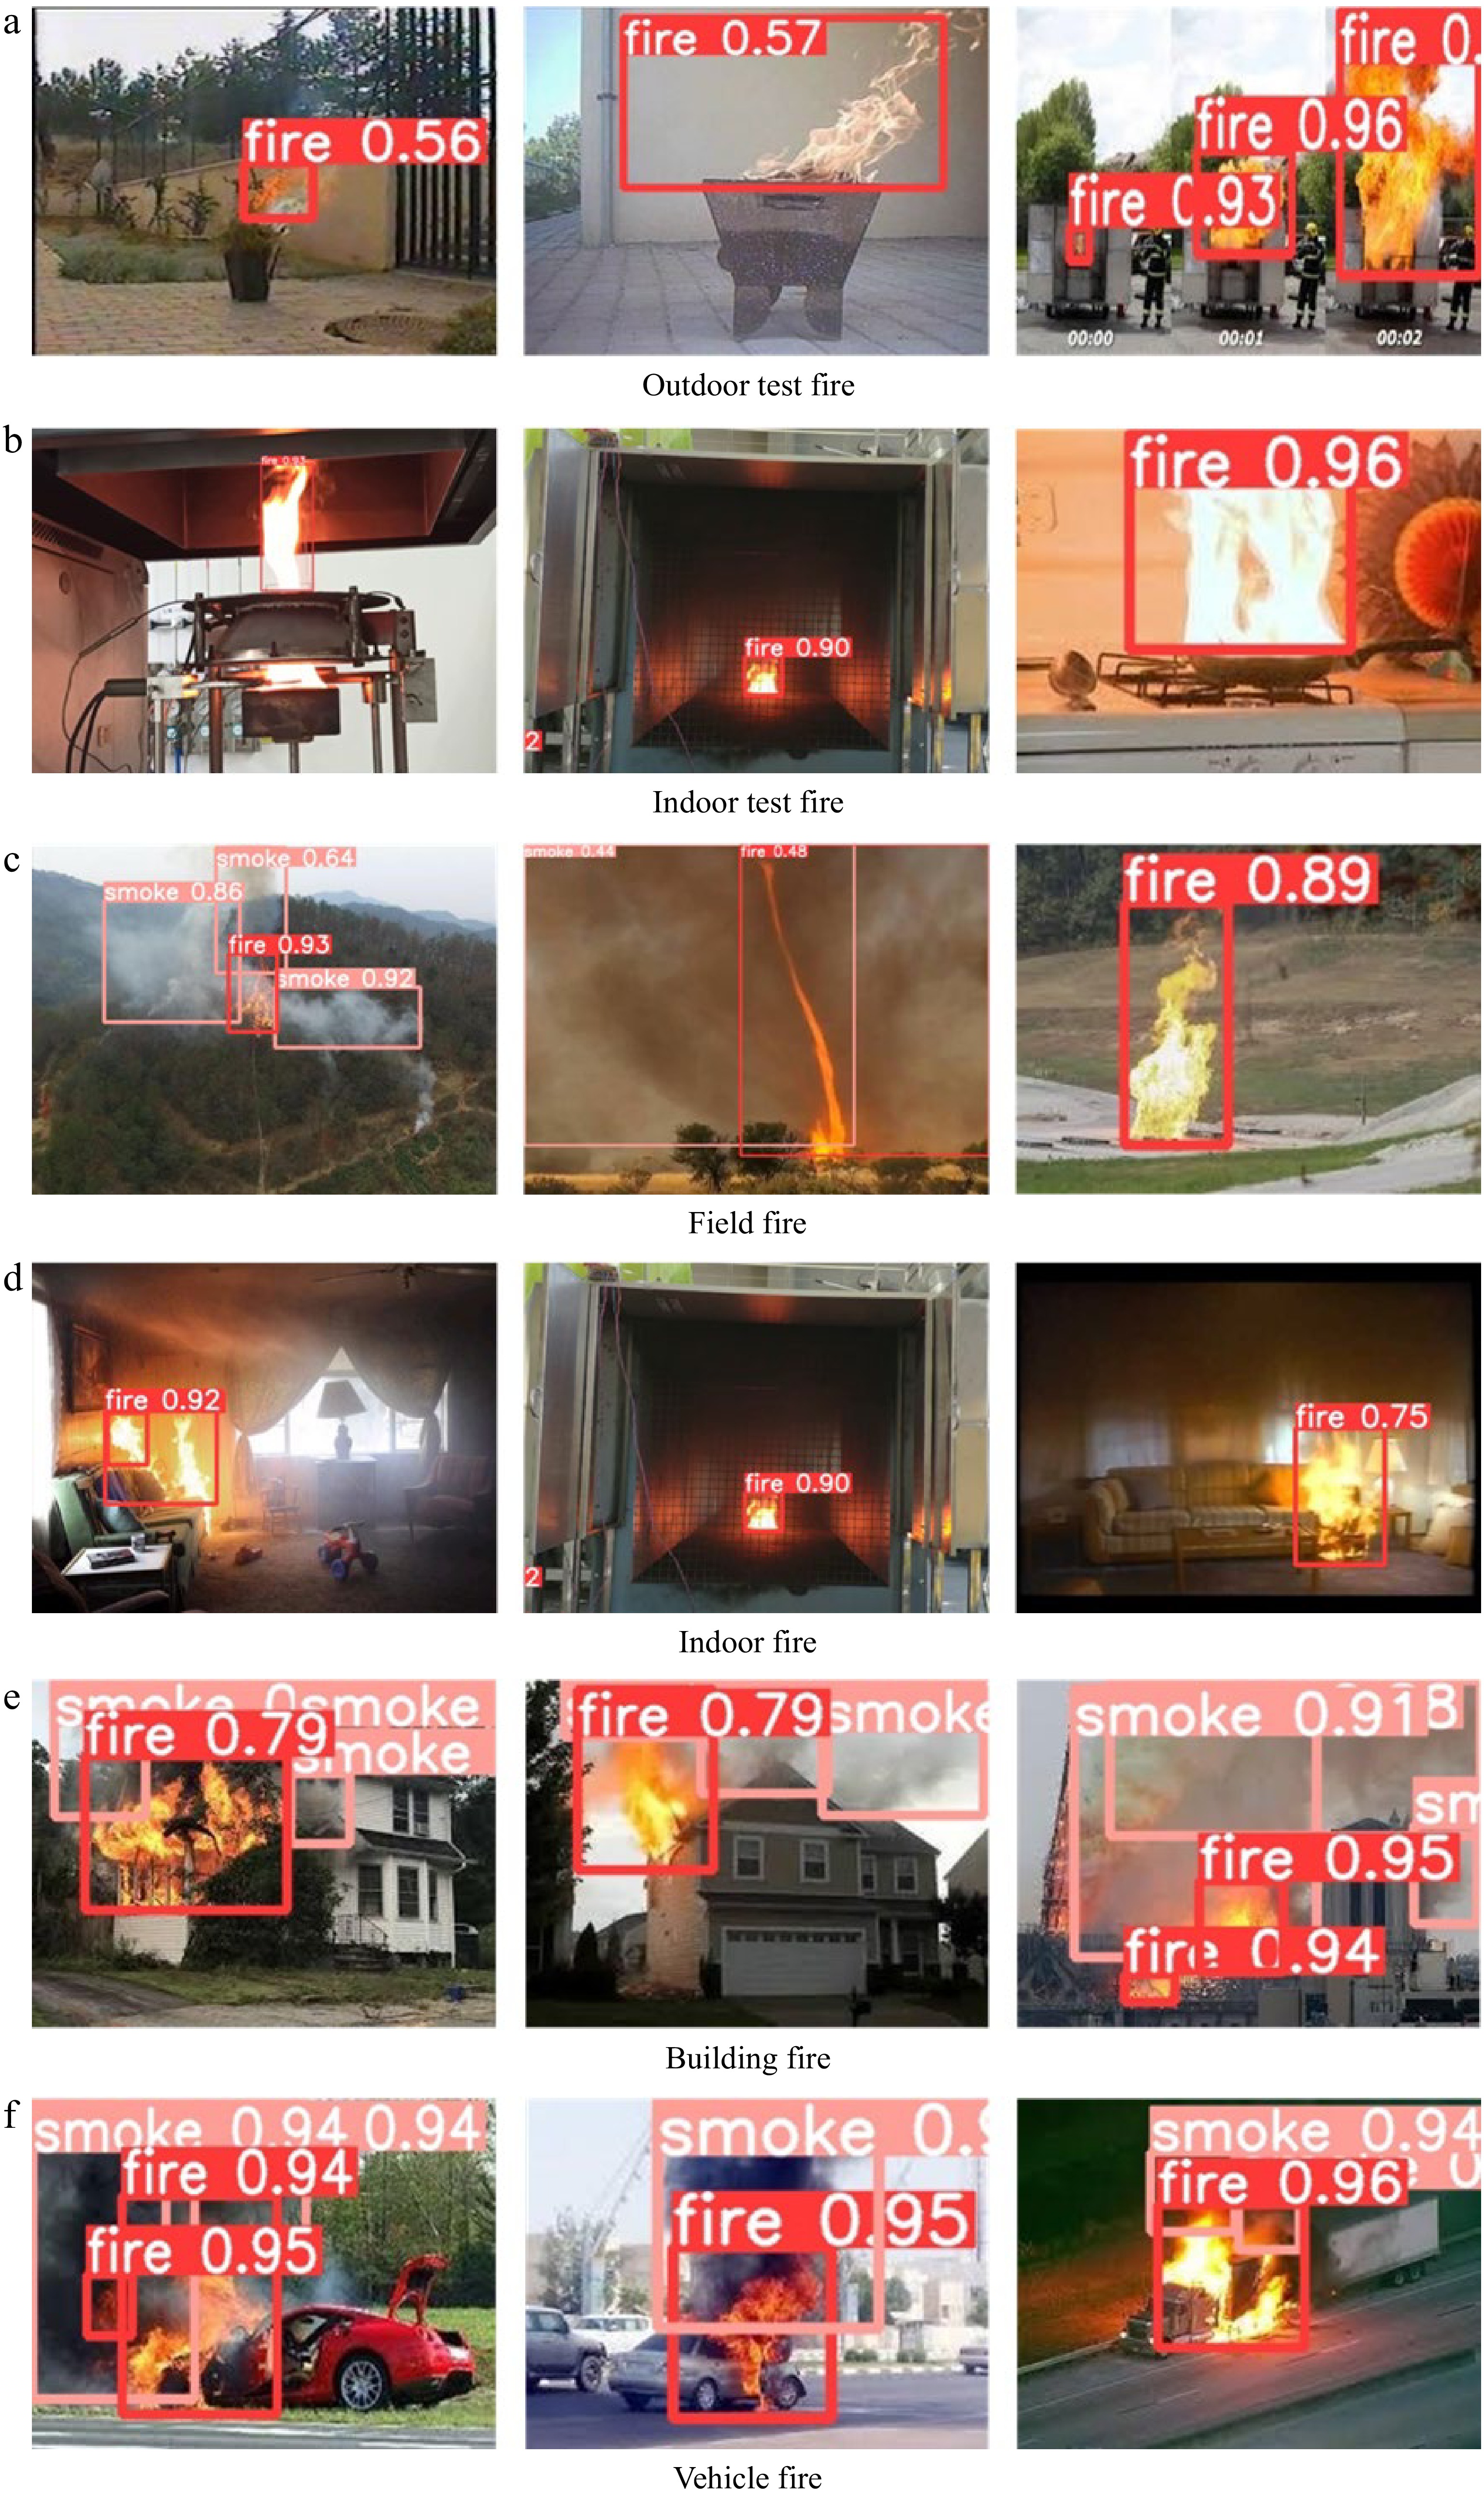
Figure 12.
Fire detection effects of the YOLOv5 + TR + αCIOU algorithm for different types of scenarios.
-
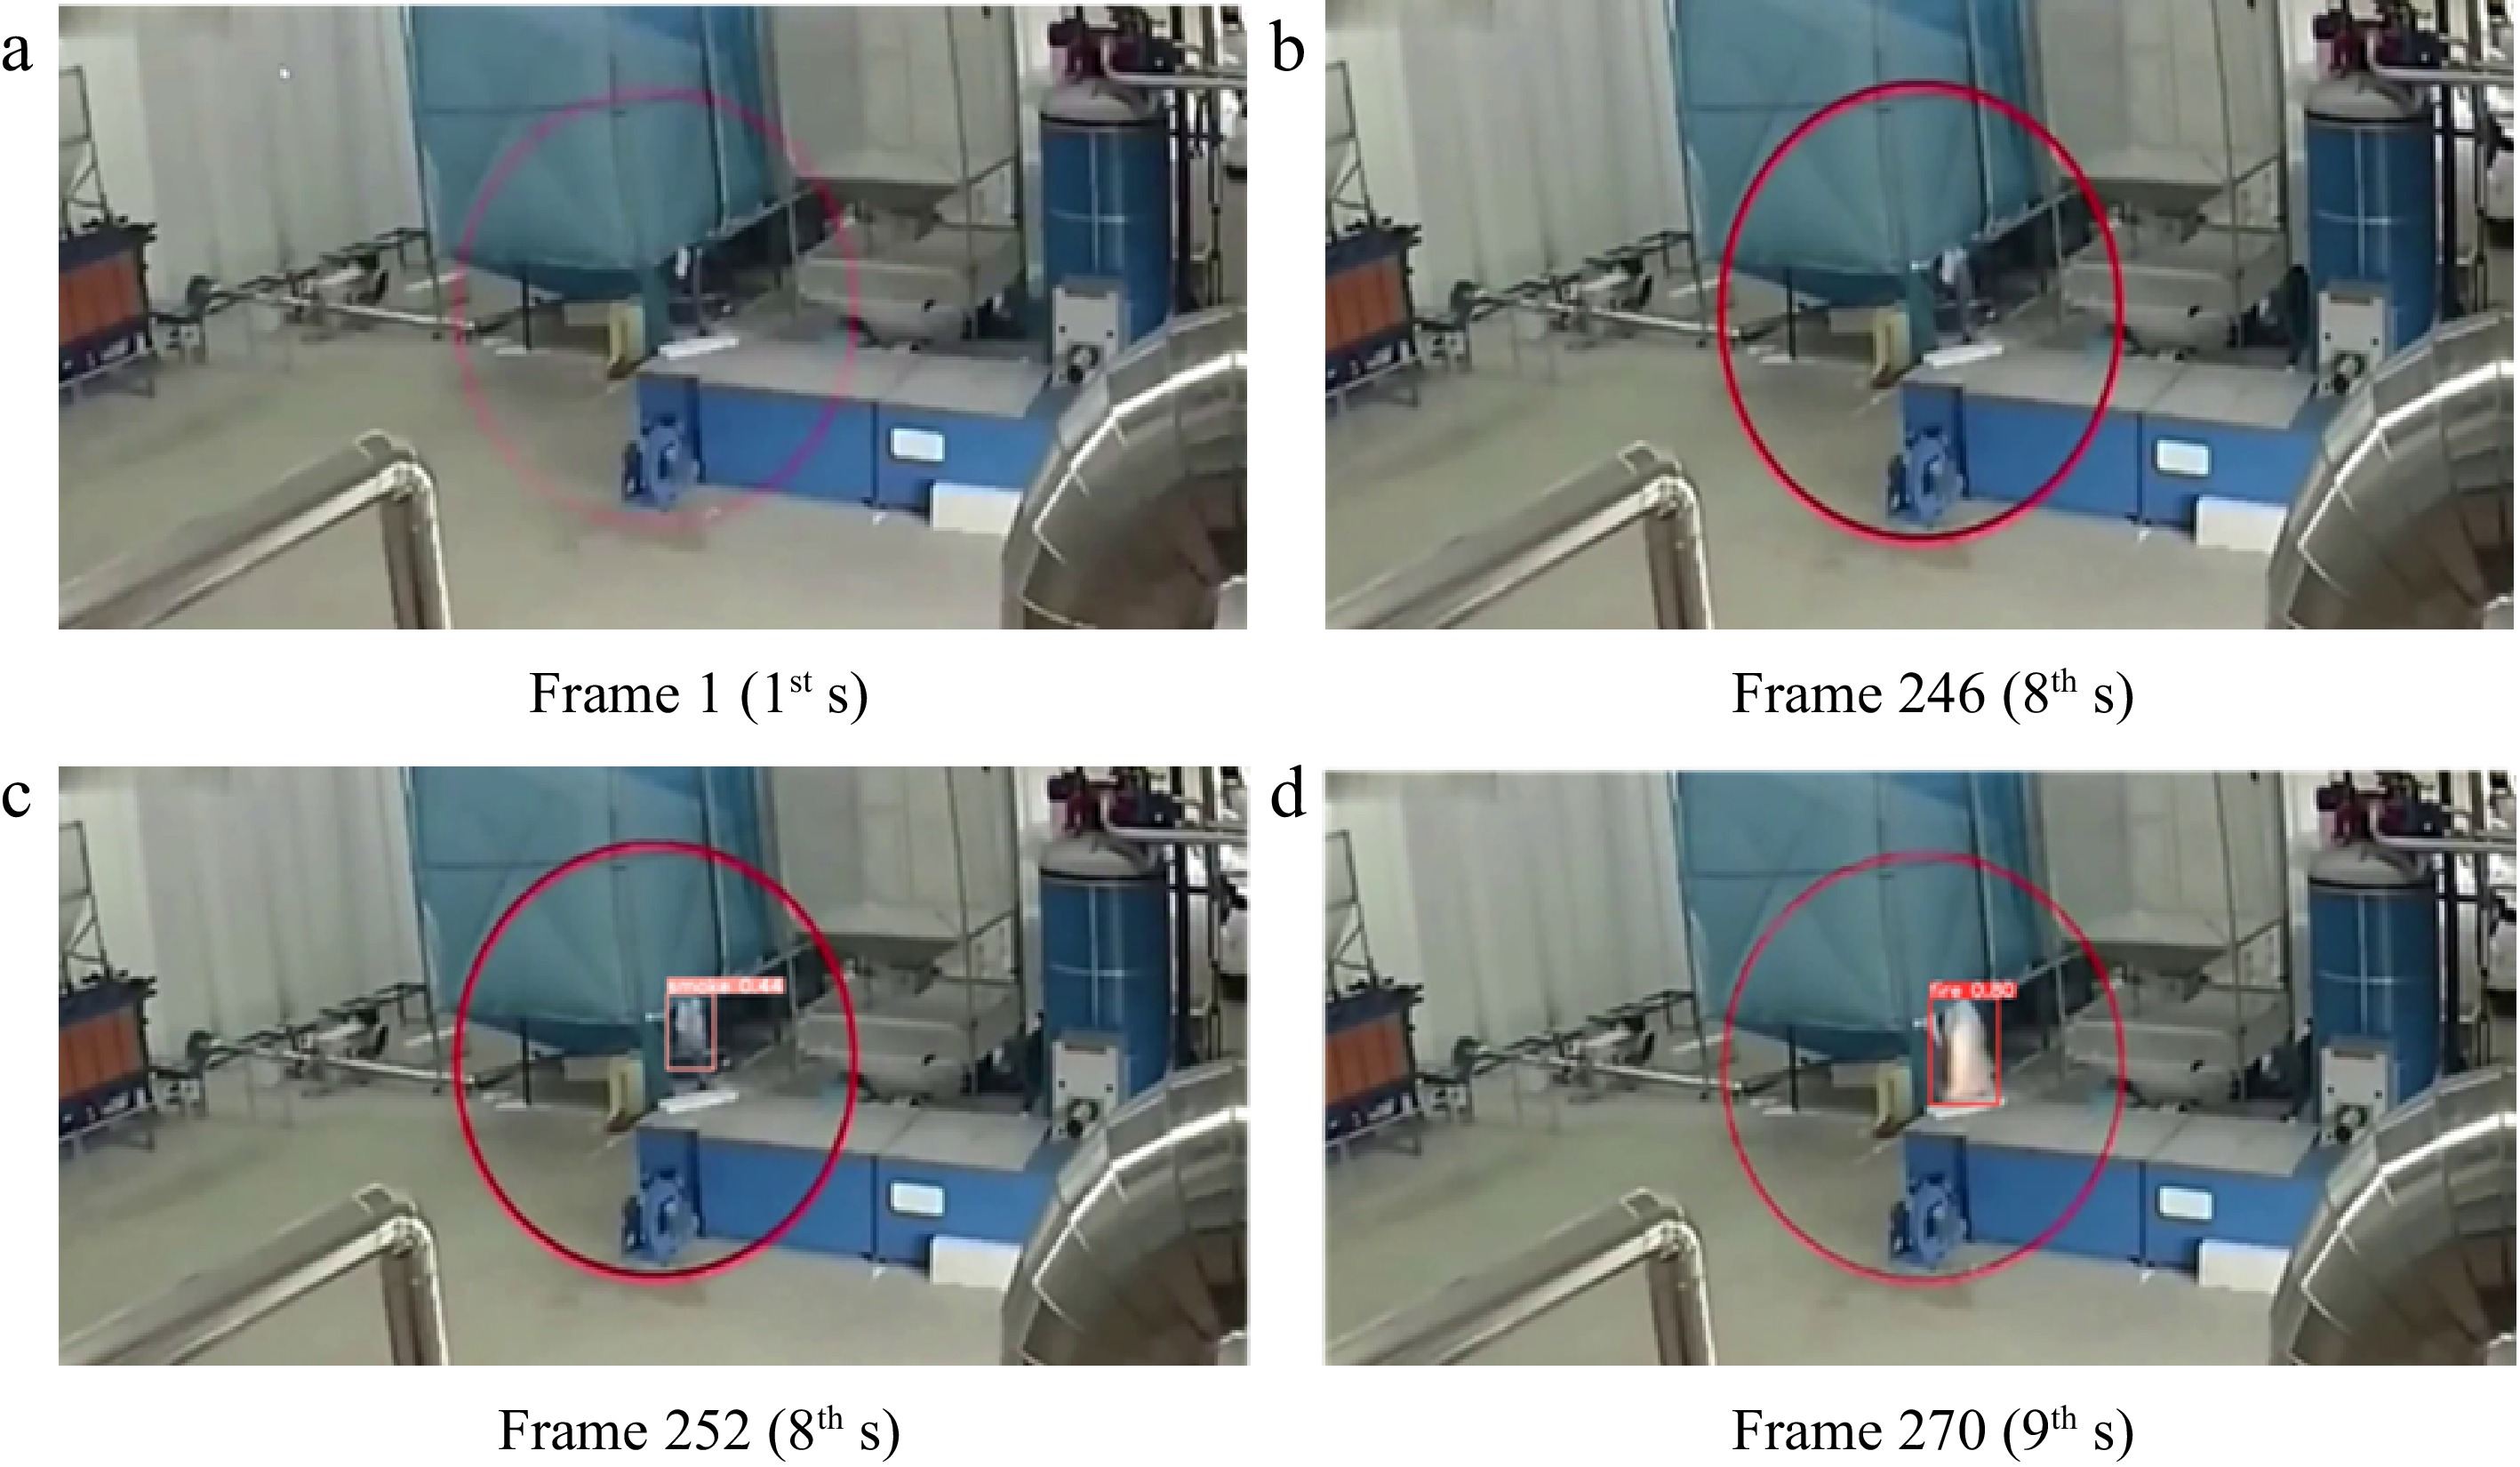
Figure 13.
Incipient stage of the factory fire.
-
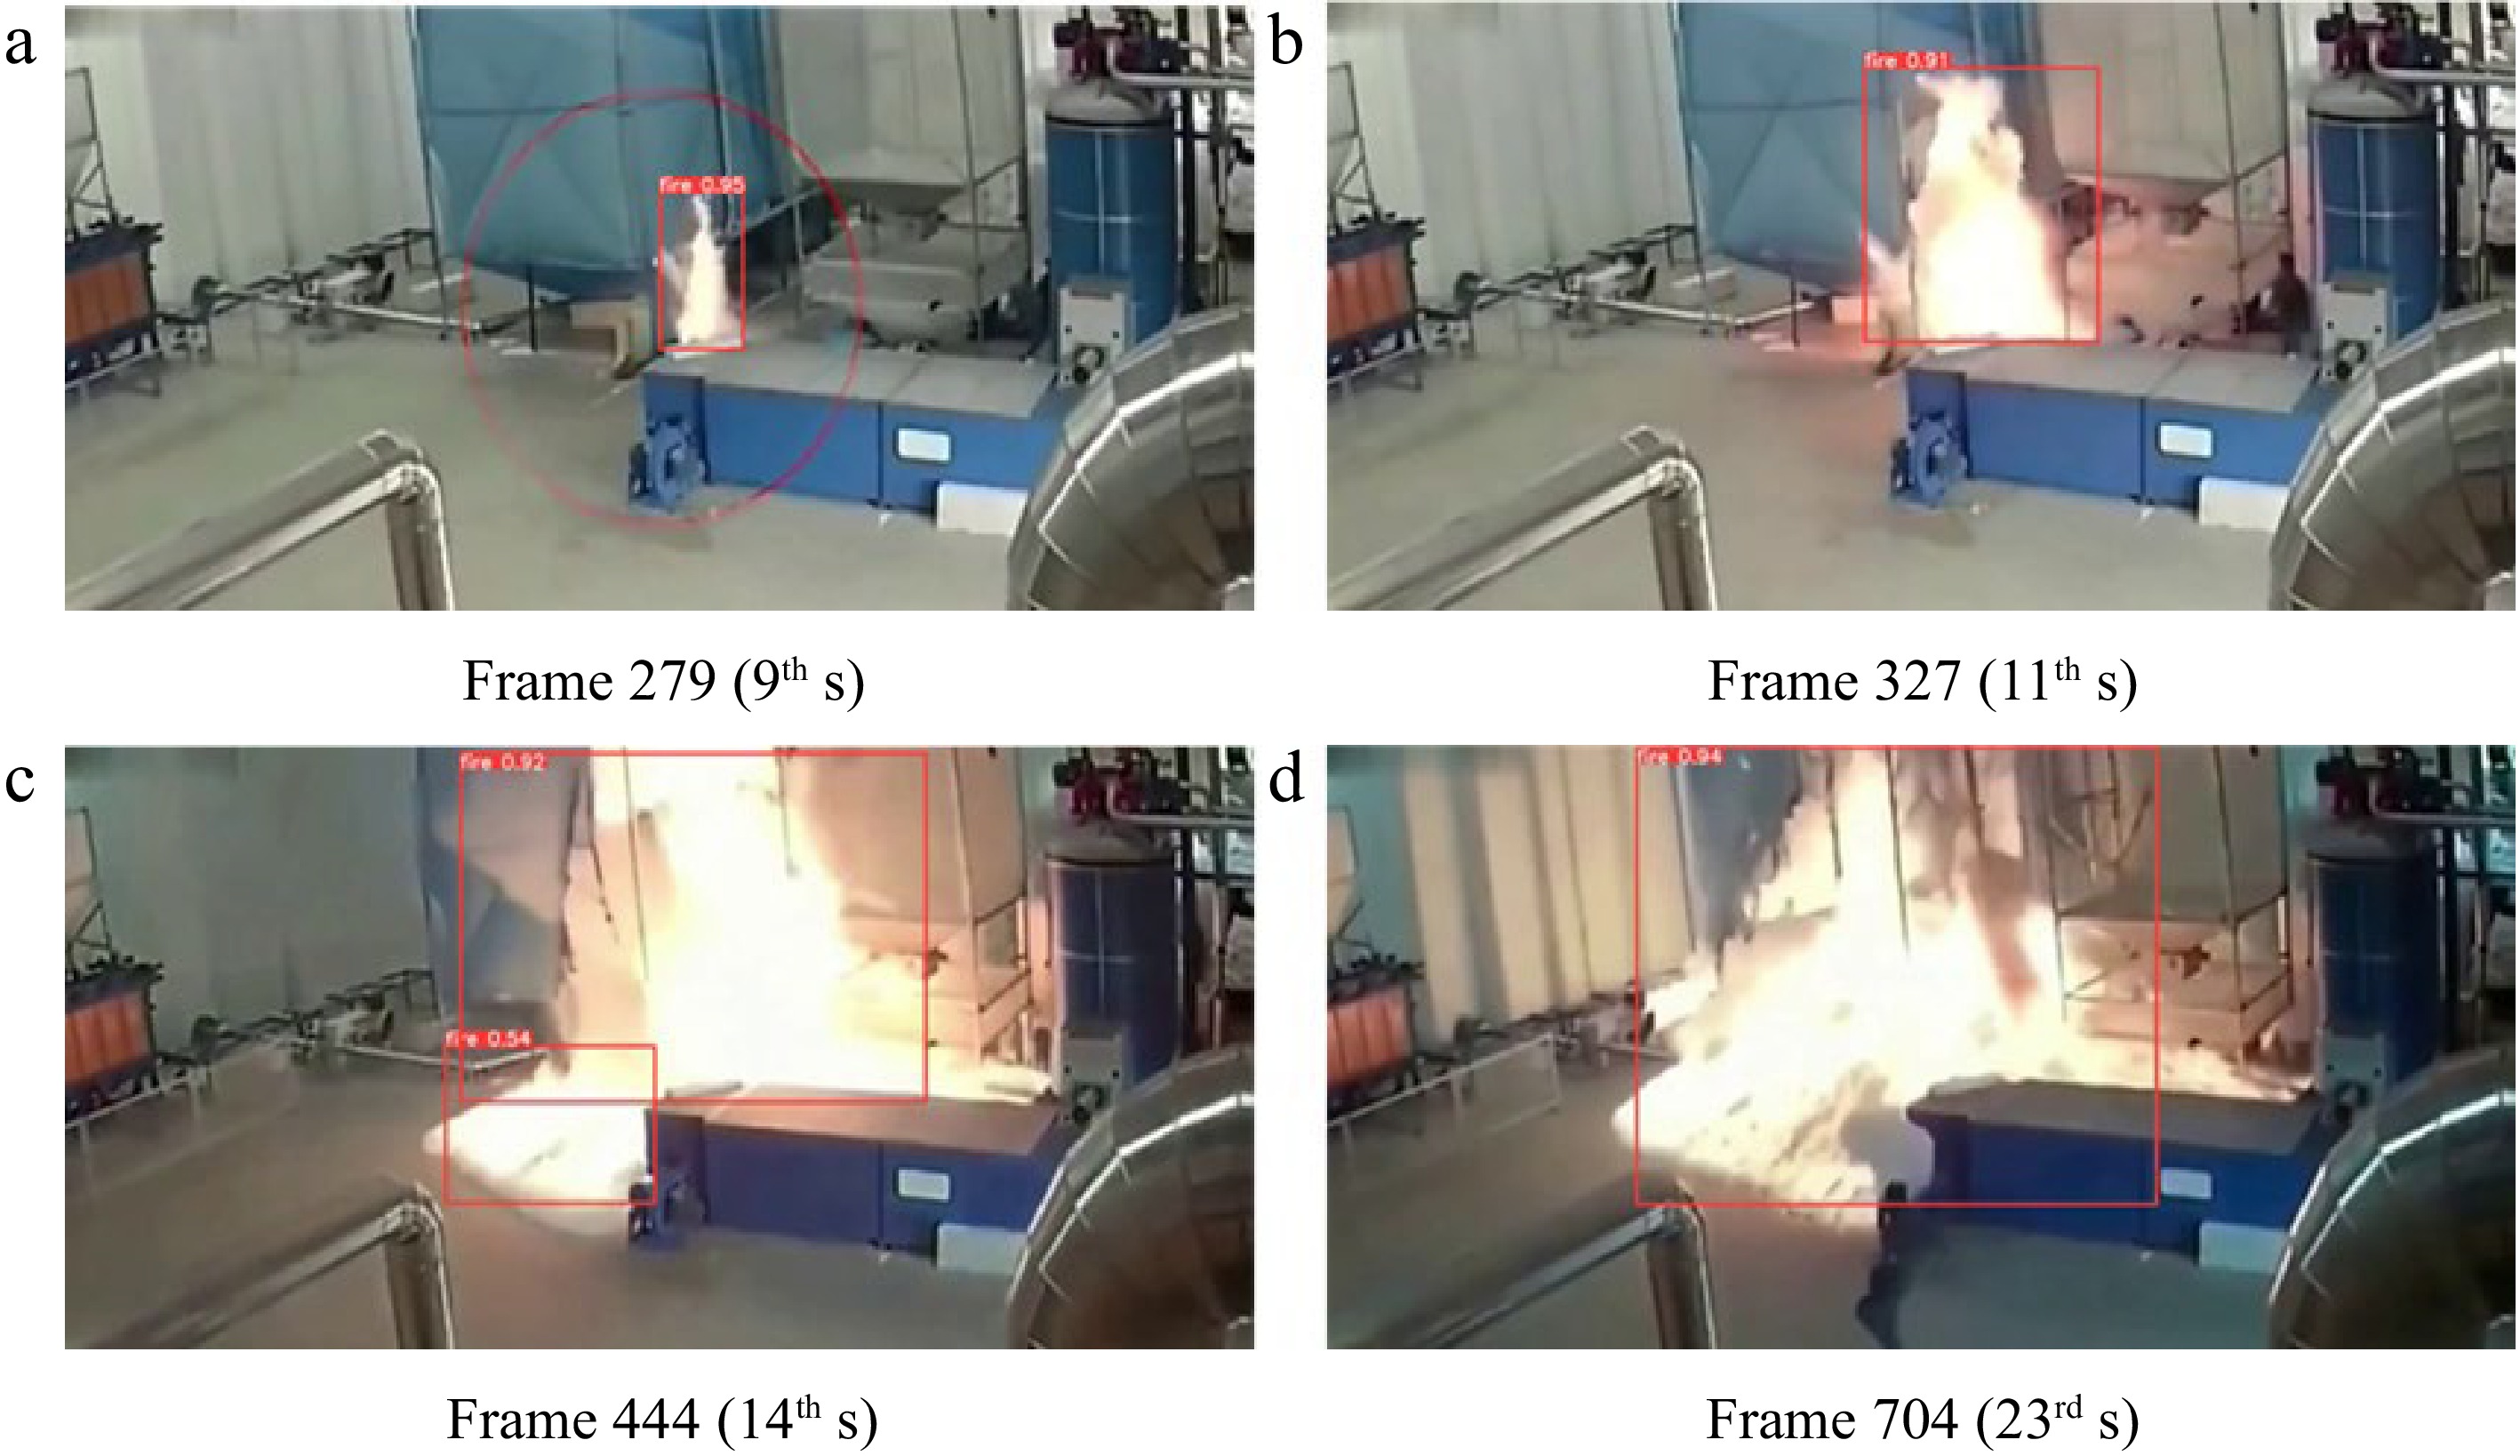
Figure 14.
Developing stage of the factory fire.
-
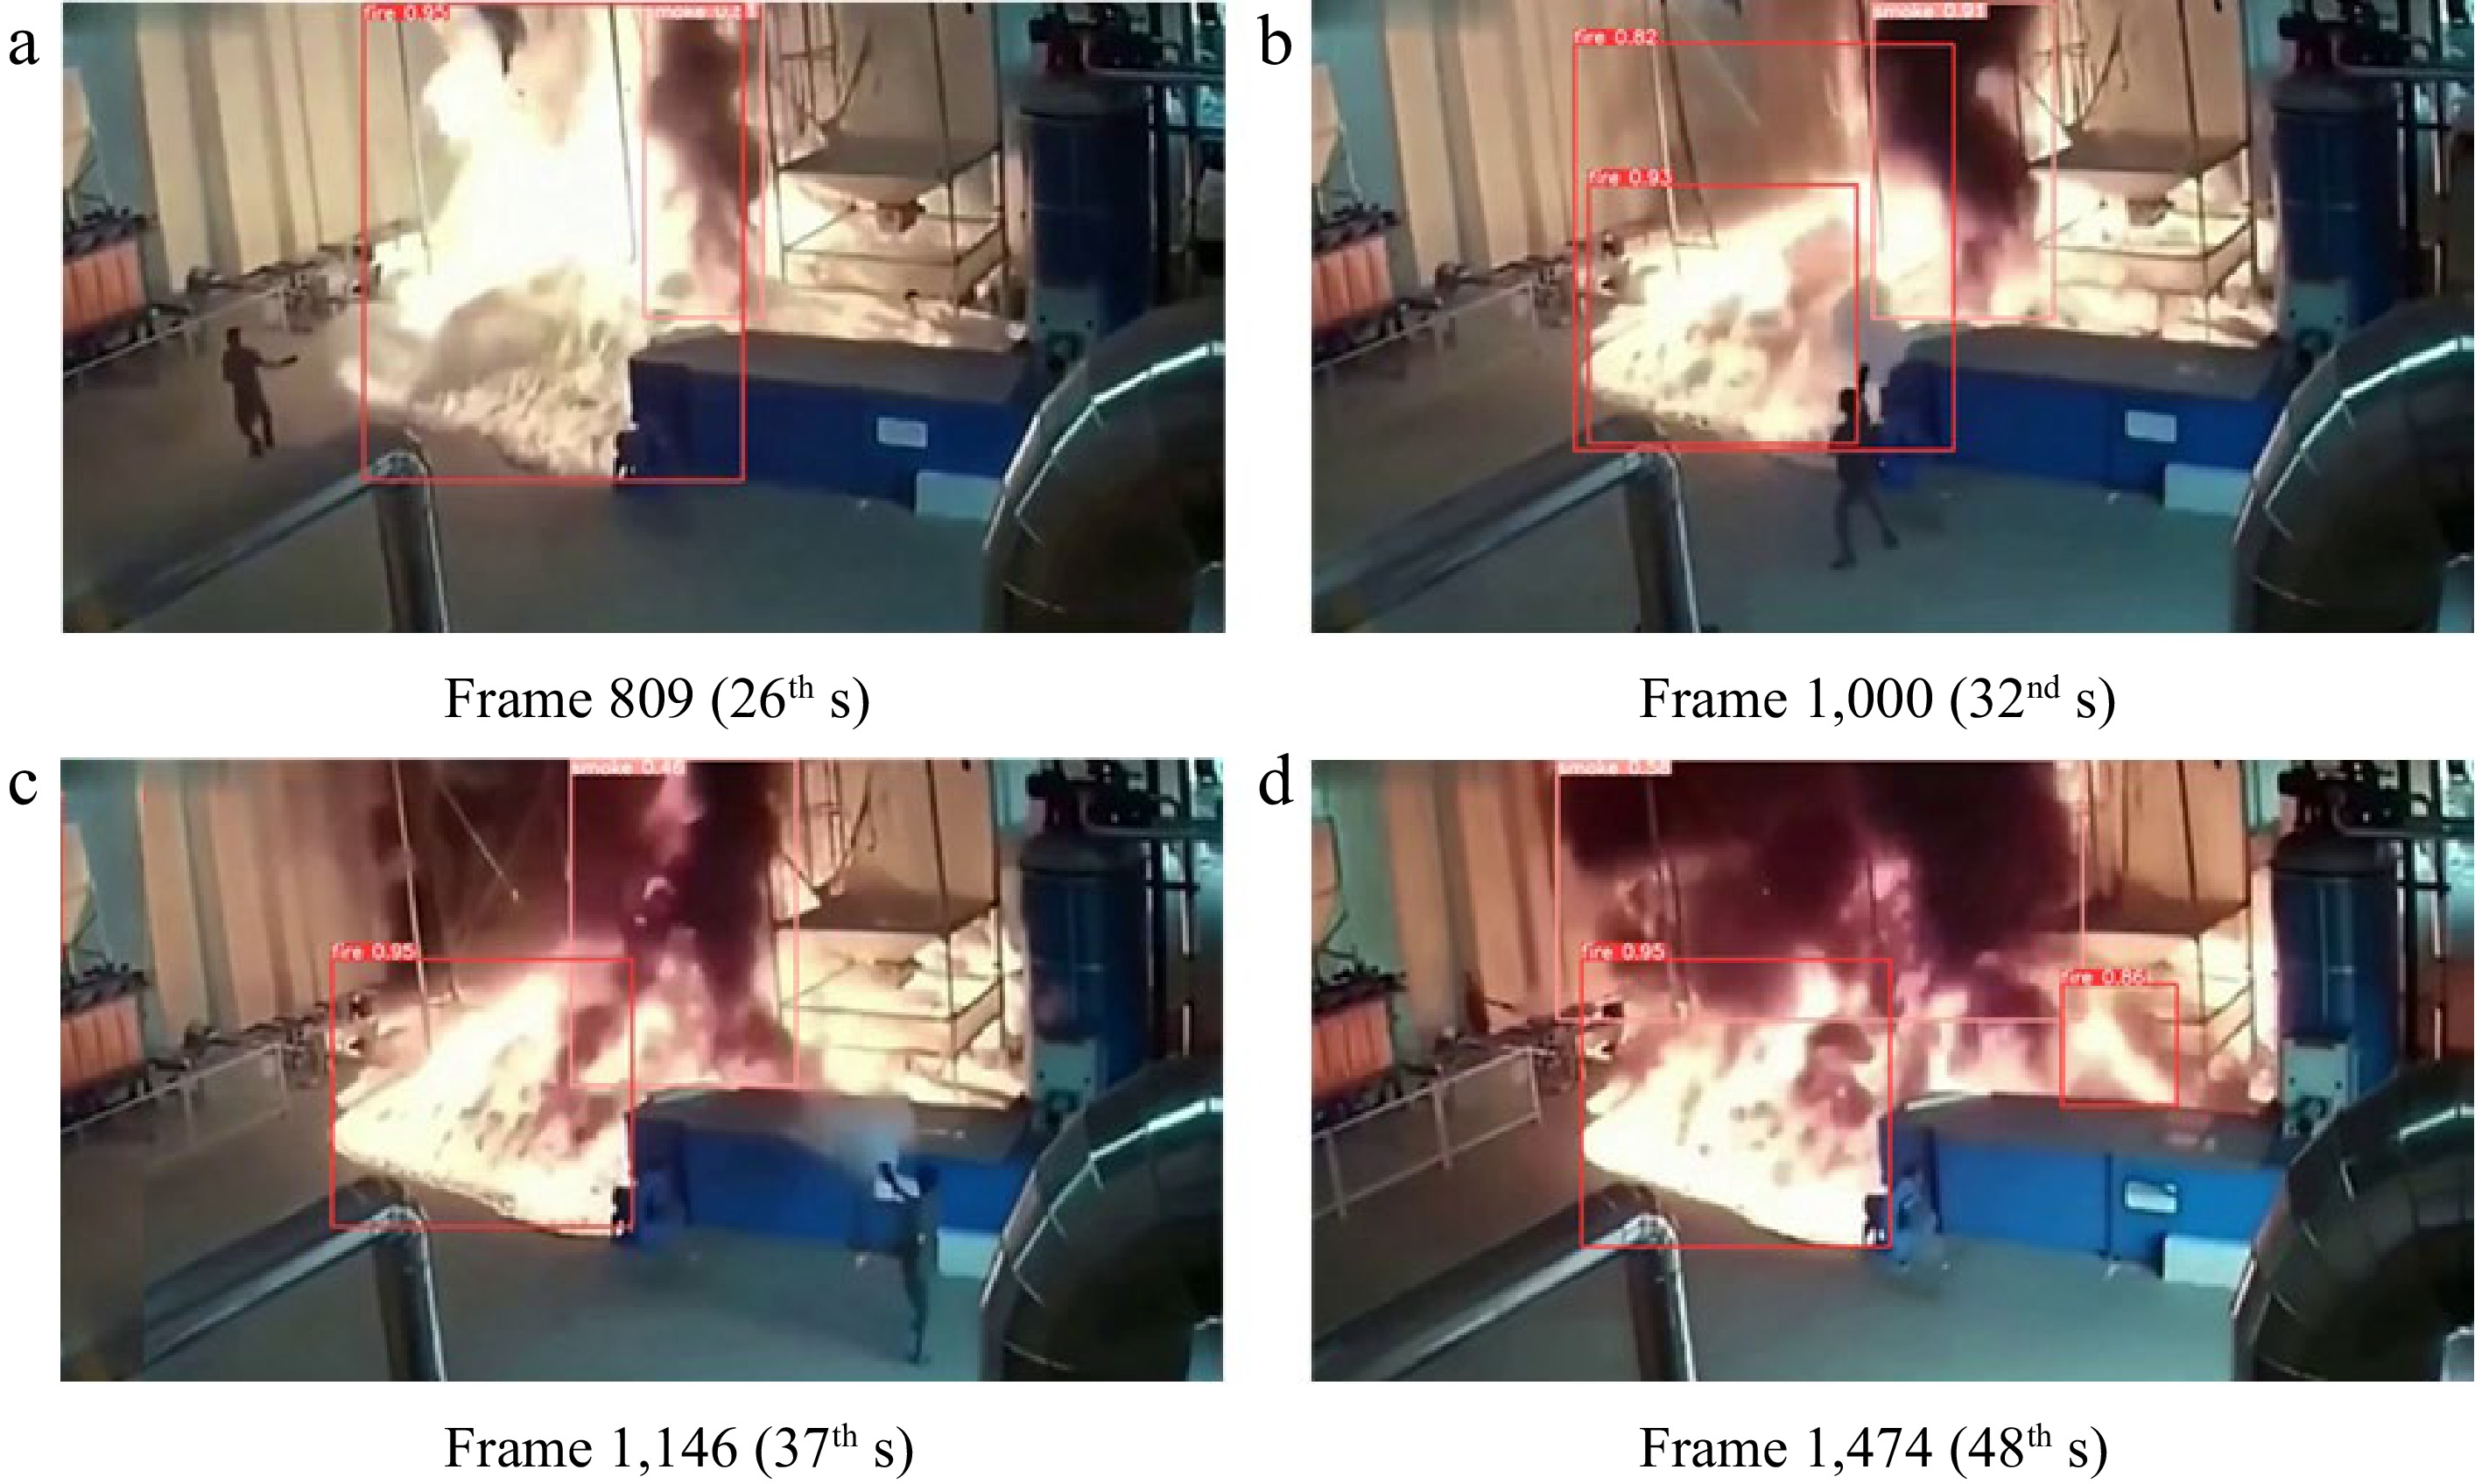
Figure 15.
Fully developed stage of the factory fire.
-
True value Positive
(real target)Negative
( non-target)Predicted value Positive True Positive (TP) False Positive (FP) Negative False Negative (FN) True Negative (TN) Table 1.
Confusion matrix.
-
Model Class P R MAP
@0.5F1 FPS/Frame
per secondWeight/
MBYOlOv5 All 0.778 0.540 0.641 0.64 64.1 14.5 Fire 0.859 0.655 0.764 Smoke 0.696 0.426 0.518 YOlOv5
+ CAC3All 0.776 0.585 0.653 0.66 72.5 13.8 Fire 0.829 0.688 0.774 Smoke 0.722 0.481 0.531 YOlOv5
+ TRC3All 0.855 0.581 0.697 0.69 54.6 14.5 Fire 0.903 0.699 0.797 Smoke 0.806 0.463 0.597 YOlOv5
+ αCIOUAll 0.774 0.583 0.651 0.66 61.3 14.5 Fire 0.818 0.667 0.765 Smoke 0.729 0.500 0.538 YOlOv5
+ CA
+ αCIOUAll 0.727 0.614 0.673 0.67 60.6 13.8 Fire 0.832 0.710 0.794 Smoke 0.622 0.519 0.553 YOlOv5
+ TR
+ αCIOUAll 0.839 0.685 0.724 0.70 58.8 14.5 Fire 0.860 0.710 0.806 Smoke 0.818 0.500 0.641 Table 2.
Experimental results based on YOLOv5 and 5 optimization algorithms.
Figures
(15)
Tables
(2)