-
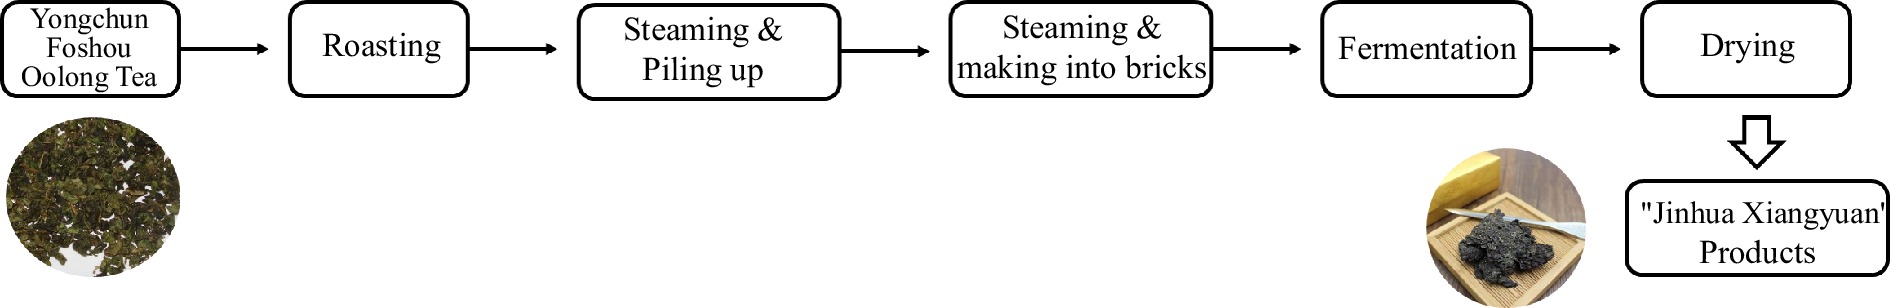
Figure 1.
The process of JHXY products.
-
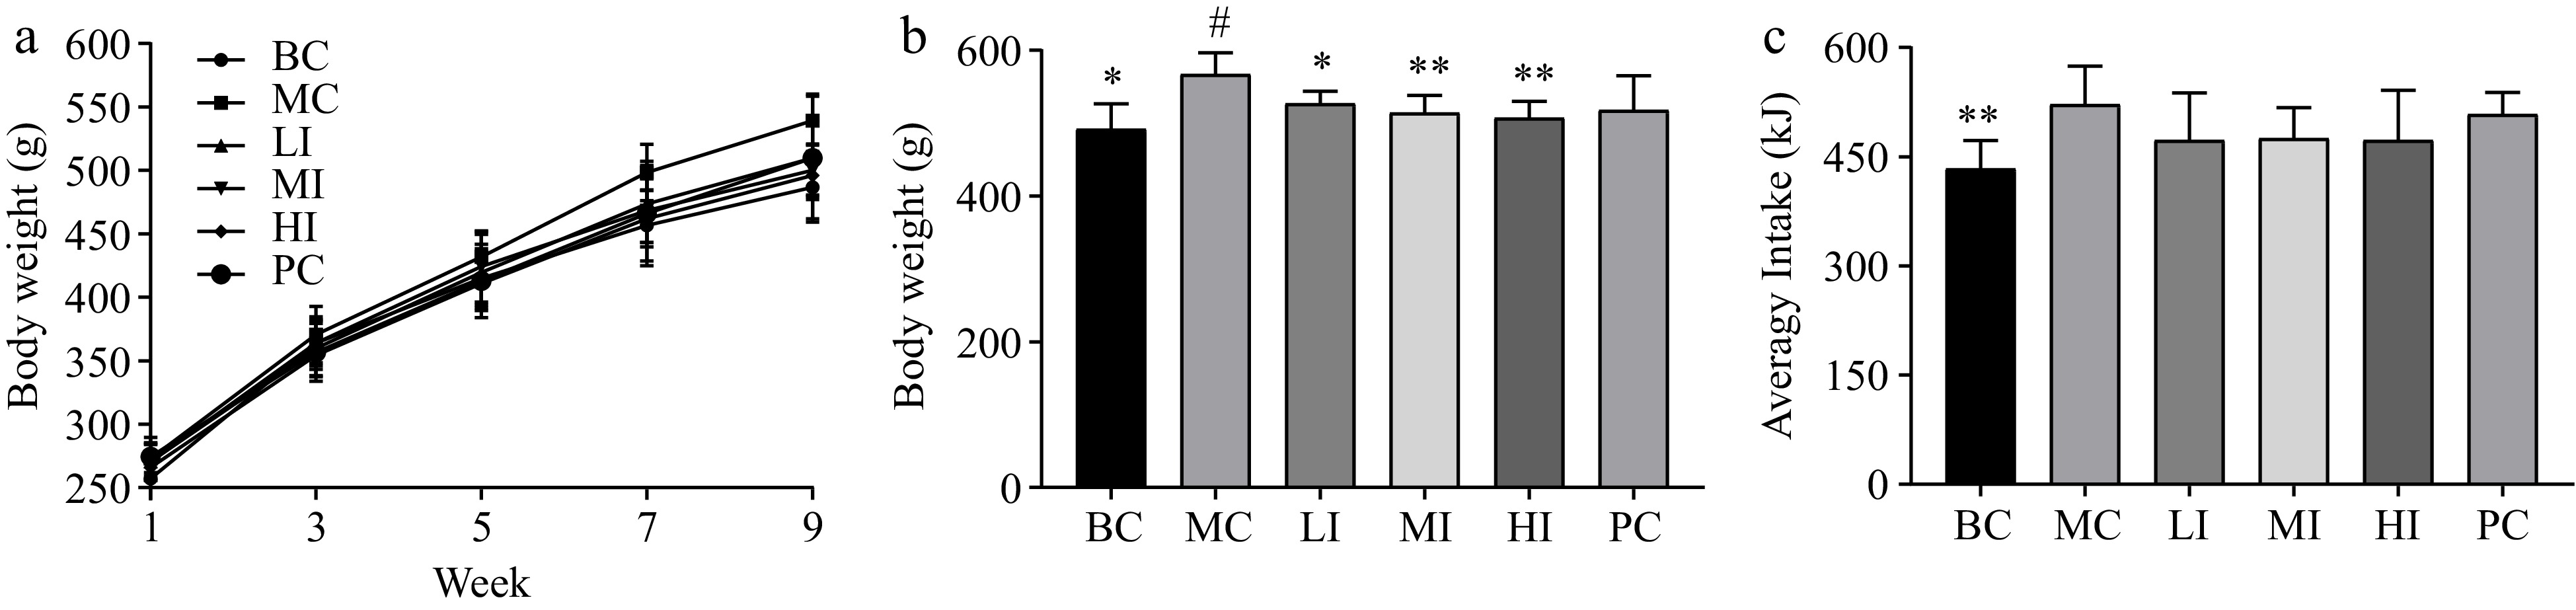
Figure 2.
Effects of JHXY on body weight and food intake. (a) The weight gain of rats in the BC, MC, LI, MI, HI, and PC groups. (b) The rats' body weight in the 10th week. The differences were denoted as follows: # p < 0.05, compared to the BC group; * p < 0.05, ** p < 0.01 compared to the MC group. (c) The average food intake of rats in BC, MC, LI, MI, HI, and PC.
-
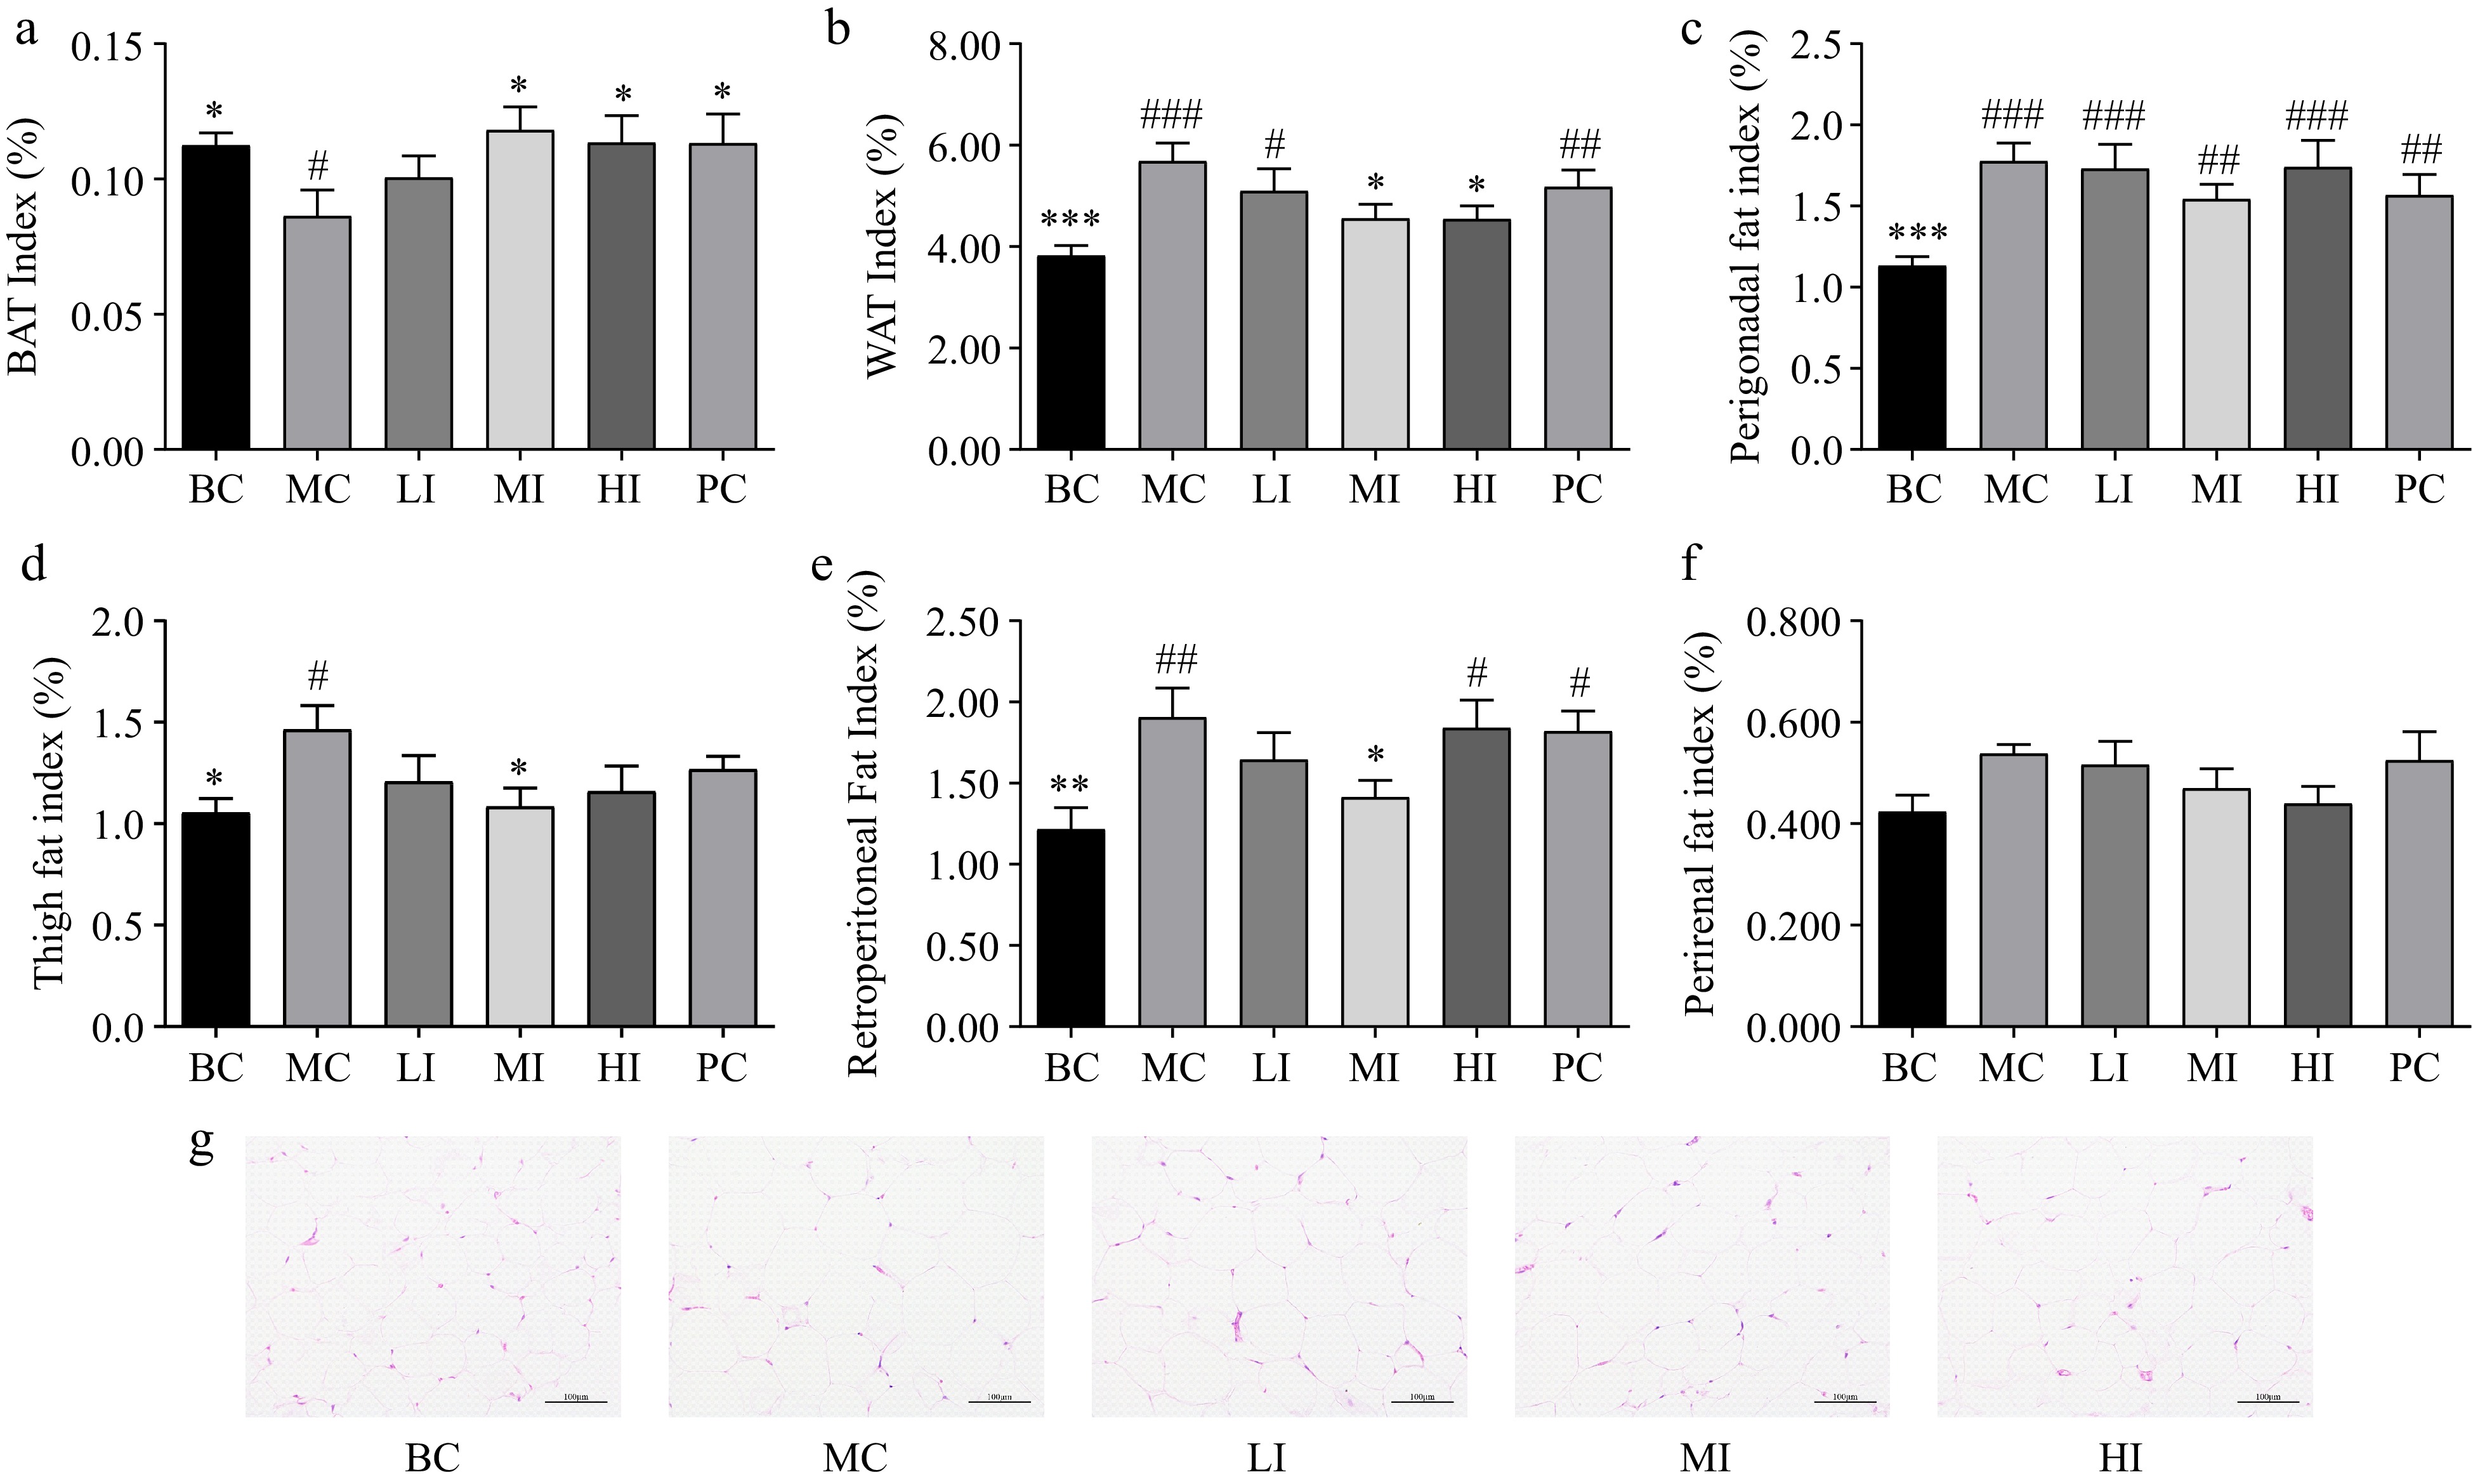
Figure 3.
Effects of JHXY on fat mass index and distribution. (a) - (f) Effects of JHXY tea on brown adipose tissue (BAT) index, white adipose tissue (WAT) index, perigonadal fat index (PGFI), thigh fat index (TFI), retroperitoneal fat index (RPFI), and perirenal fat index (PRFI) after sacrifice. The differences were denoted as follows: # p < 0.05, ## p < 0.01, ### p < 0.001 versus the BC group; * p < 0.05, ** p < 0.01, *** p < 0.001 versus the MC group. (g) The histology of the WAT from rats treated with BC, MC, LI, MI, and HI for 10 weeks. (Magnification, 200×)
-
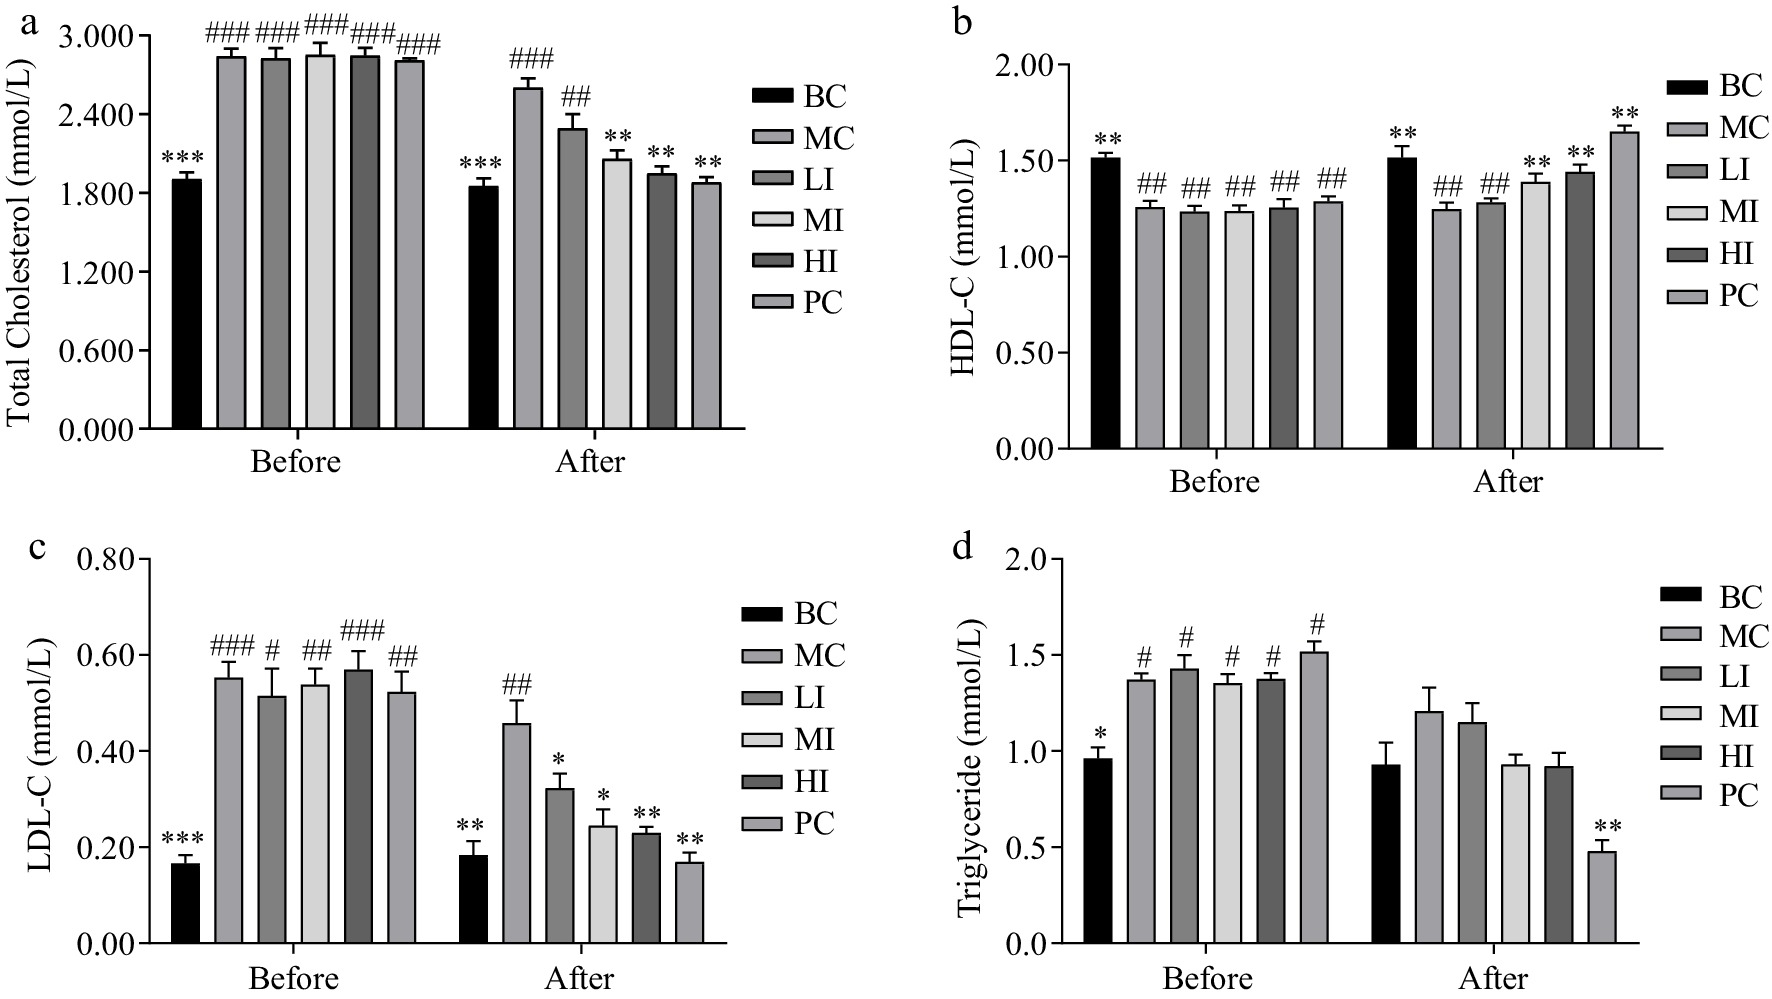
Figure 4.
Effects of JHXY on blood lipid profiles. (a) TC, (b) HDL-C, (c) LDL-C, and (d) TG levels before and after JHXY intervention. The differences were denoted as follows: # p < 0.05, ## p < 0.01, ### p < 0.001 compared to the BC group; * p < 0.05, ** p < 0.01, *** p < 0.001 compared to the MC group.
-
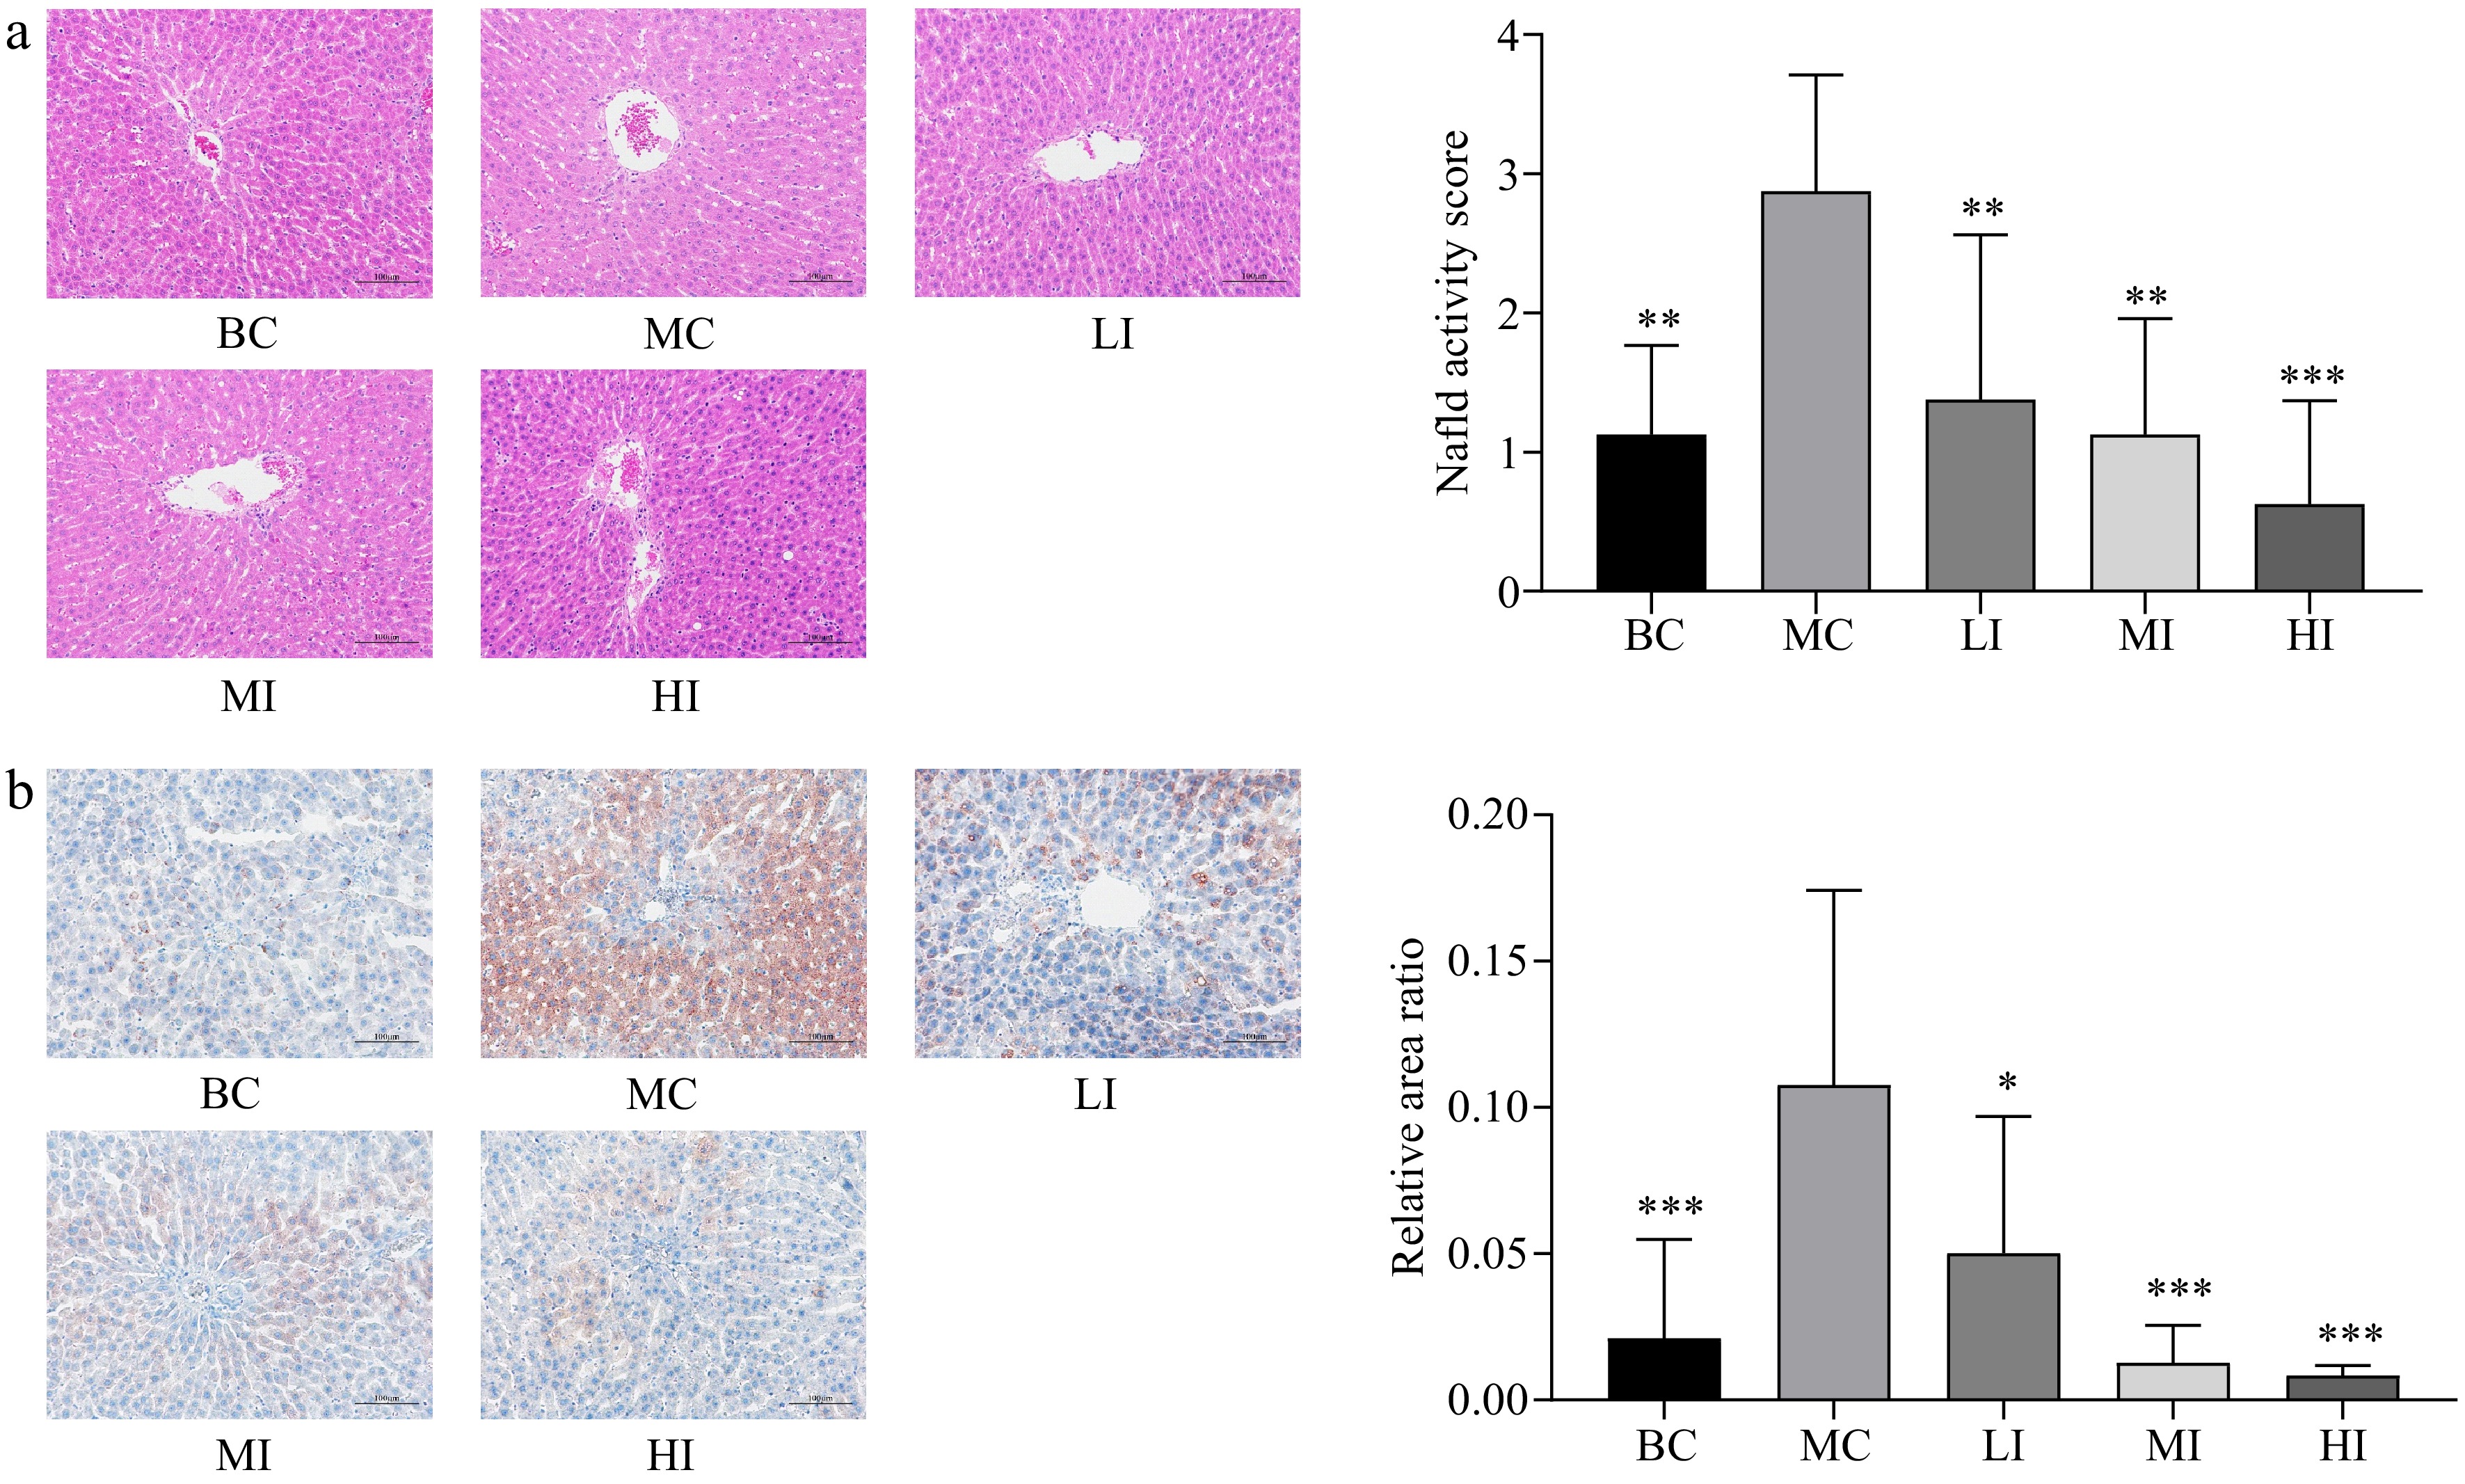
Figure 5.
Histology and oil red staining of the liver. (a) The histology of the liver from rats treated with BC, MC, LI, MI, and HI for 10 weeks. (Magnification, 200×); NAFLD scores were analyzed. The differences were denoted as follows: * p < 0.05, ** p < 0.01, *** p < 0.001 compared to the MC group. (b) The liver was stained with oil O red to observe the effects of different treatments on rats. (Magnification, 200×); the relative area ratio of positive areas was analyzed using Image J software. The differences were denoted as follows: * p < 0.05, ** p < 0.01, *** p < 0.001 versus the MC group.
-
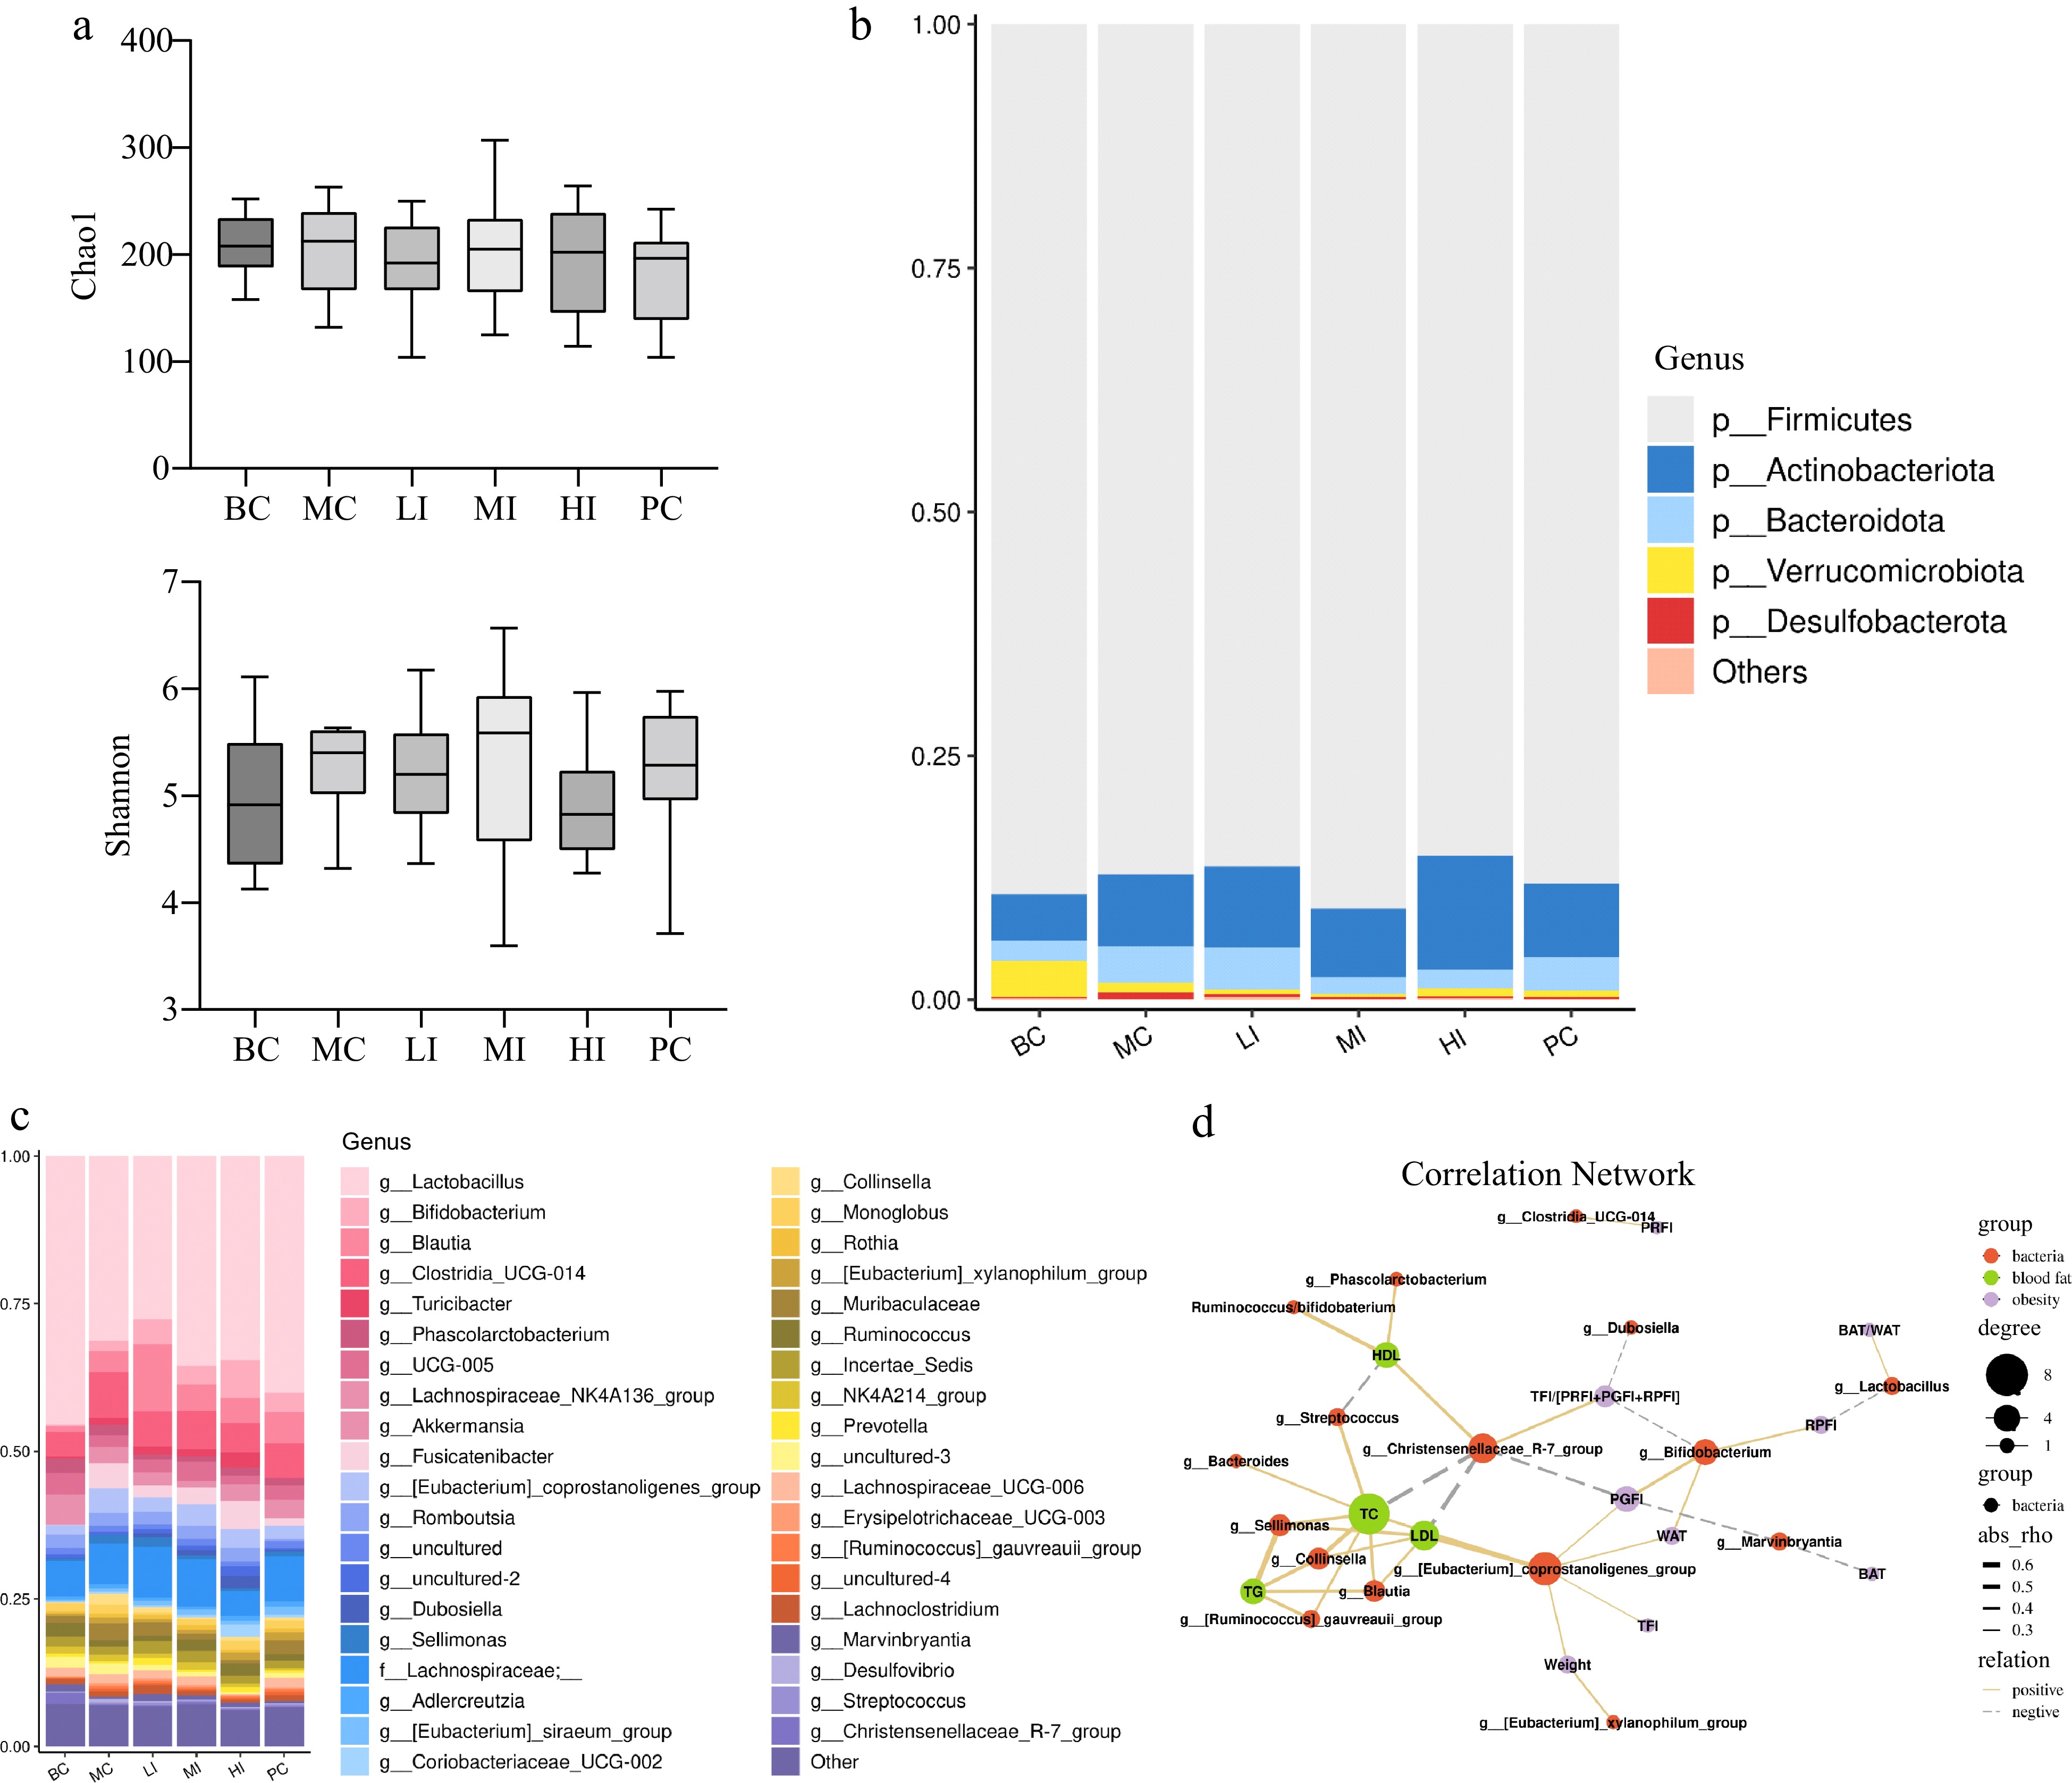
Figure 6.
Effects of JHXY on gut microbiota. (a) The α-diversity of gut microbiota in various groups. (b) Relative abundance of bacteria at the phylum level. (c) Relative abundance of bacteria at the genus level (top 40 genera analysis). (d) Spearman correlation analysis of microorganisms and physical indexes (solid line indicates positive correlation, dotted line indicates negative correlation).
-
Raw materials Products C (mg/g) 0.92 0.49 EC (mg/g) 1.96 0.64 EGC (mg/g) 5.72 3.53 ECG (mg/g) 1.08 0.43 EGCG (mg/g) 10.82 3.80 TFs (mg/g) 1.20 0.50 Tea polysaccharides (%) 1.20 3.90 Reducing sugar (%) 6.26 1.25 Caffeine (%) 1.81 1.58 Total flavonoids (%) 4.37 2.90 Polyphenol (%) 13.33 8.70 Table 1.
Main components in JHXY raw materials and products.
Figures
(6)
Tables
(1)