-
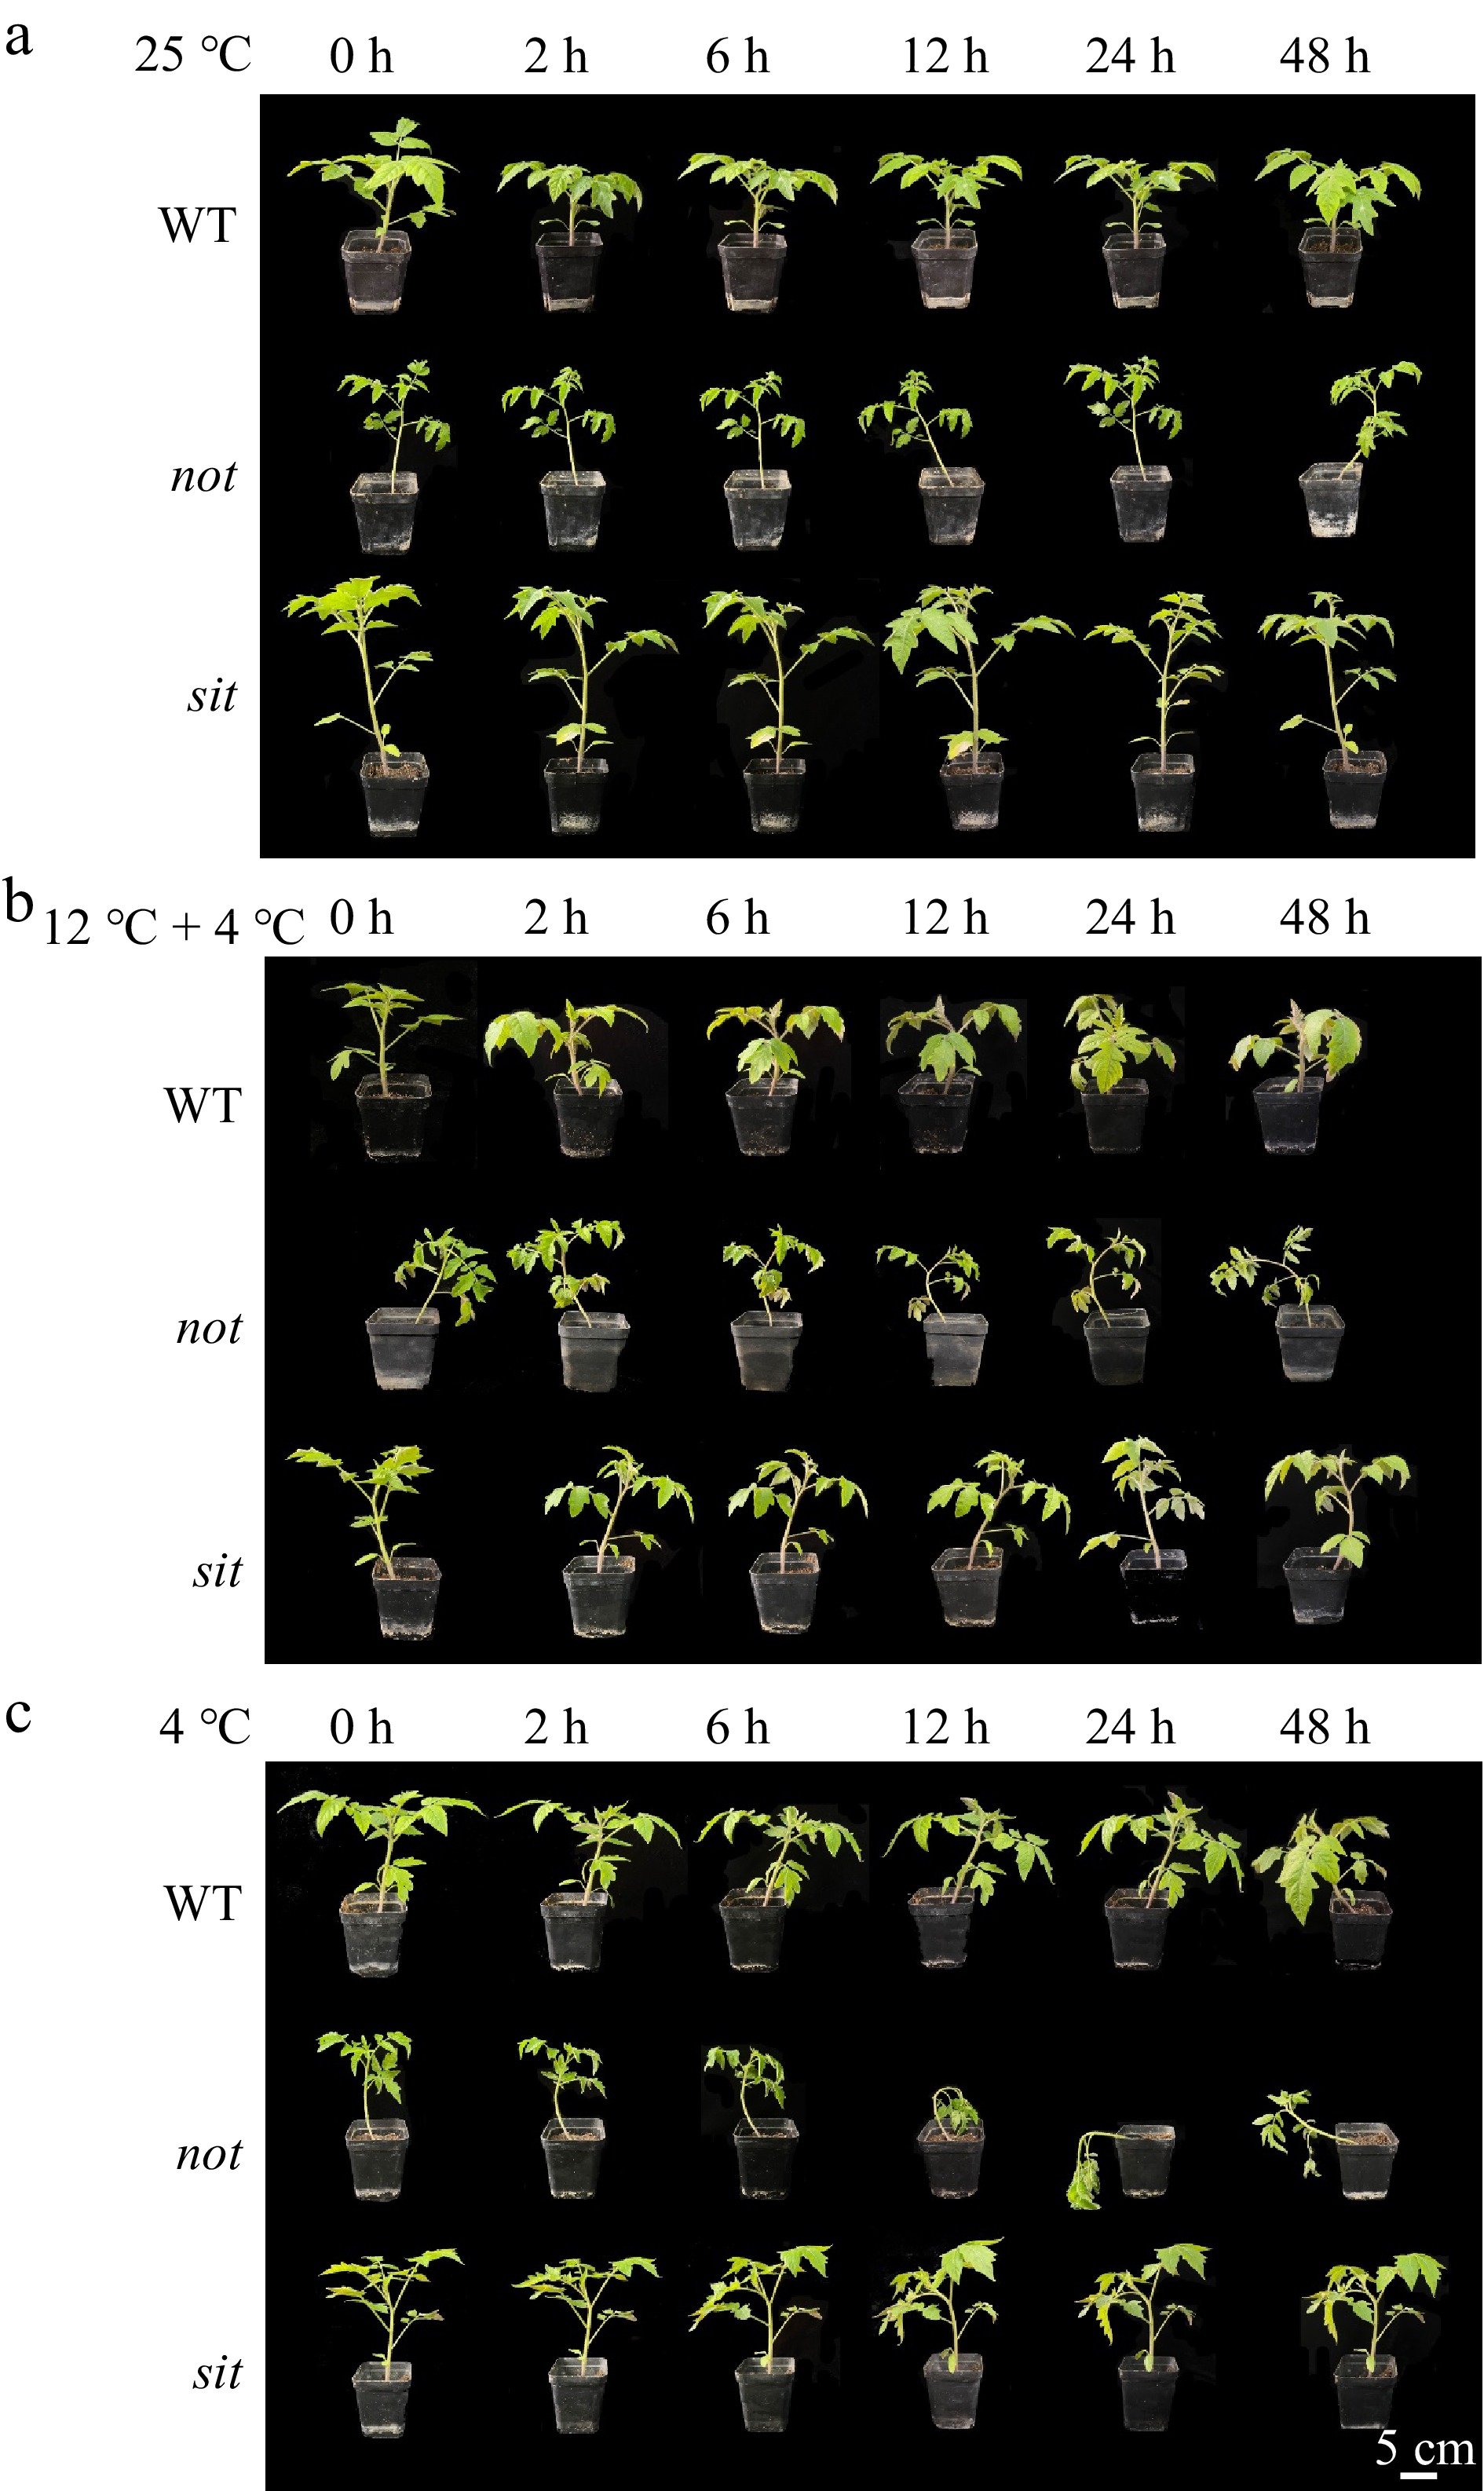
Figure 1.
Phenotypes of WT and ABA biosynthesis mutants in response to cold stress. The representative phenotypes of tomato WT, not, and sit mutants under (a) normal growth condition, (b) cold acclimation and (c) cold stress conditions for 0, 2, 6, 12, 24, and 48 h. WT, not, and sit seedlings, reaching the four-leaf stage, were moved to 4 °C for cold treatment (4 °C). Cold acclimation was performed by transferring seedlings to 12 °C for 1 d before moving to 4 °C (12 °C − 4 °C). Seedlings grown at normal growth condition (25 °C) were used as the control. Scale bars indicate 5 cm.
-
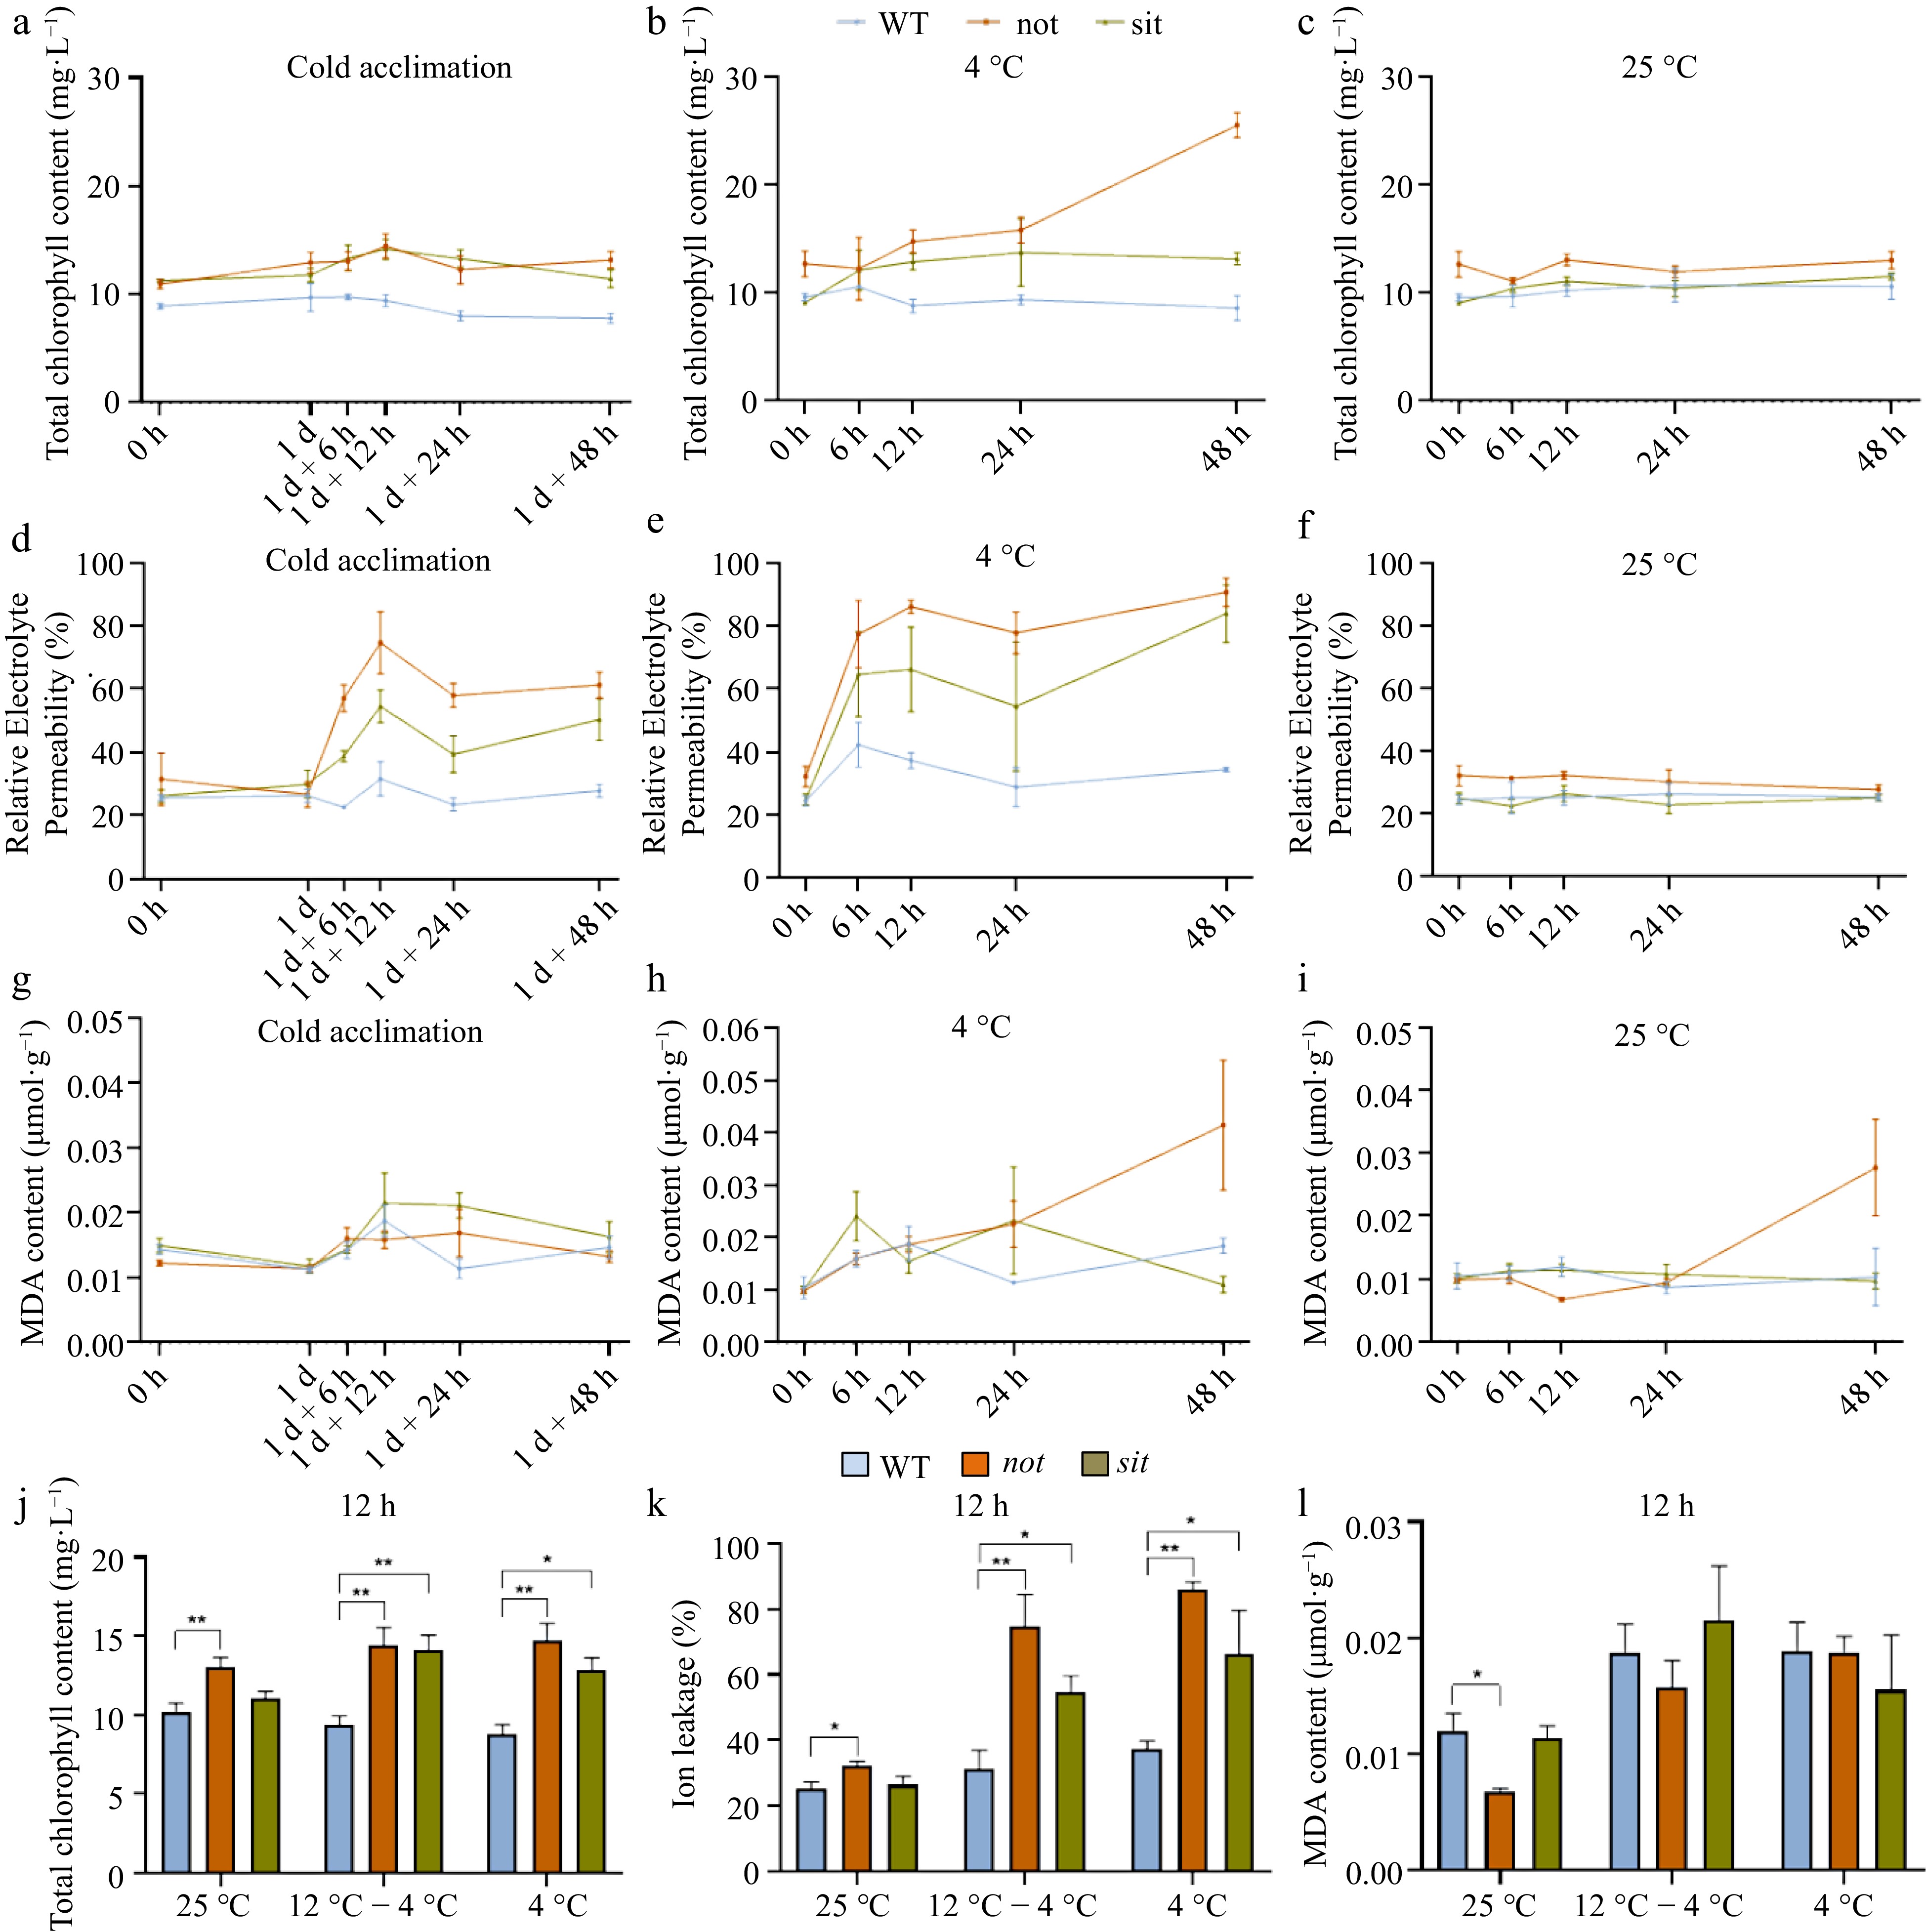
Figure 2.
Cold tolerance evaluation of tomato WT, not, and sit in response to low temperature. WT, not, and sit seedlings, reaching the four-leaf stage, were moved to 4 °C for cold treatment (4 °C). Cold acclimation was performed by transferring seedlings to 12 °C for 1 d before moving to 4 °C (12 °C − 4 °C). Seedlings grown under normal growth conditions (25 °C) were used as the control. For cold tolerance evaluation, time-course experiments were conducted to measure the total chlorophyll content (a)−(c), Relative Electrolyte Permeability (REP) (d)−(f), and MDA content (g)−(i) in WT, not, and sit mutants after low temperature treatment for 0, 6, 12, 24, and 48 h. Bar graphs represent (j) total chlorophyll content, (k) REP, and (l) MDA content in WT, not, and sit mutants at the 12-h from the same time-course experiments as (a)−(i). Values are means of minimum three replicates, with each containing 9 to 10 seedlings. Date are expressed as mean ± standard deviation, and one-way ANOVA followed by Student's t-test was used for significant difference analysis. * p < 0.05, ** p < 0.01, *** p < 0.001.
-
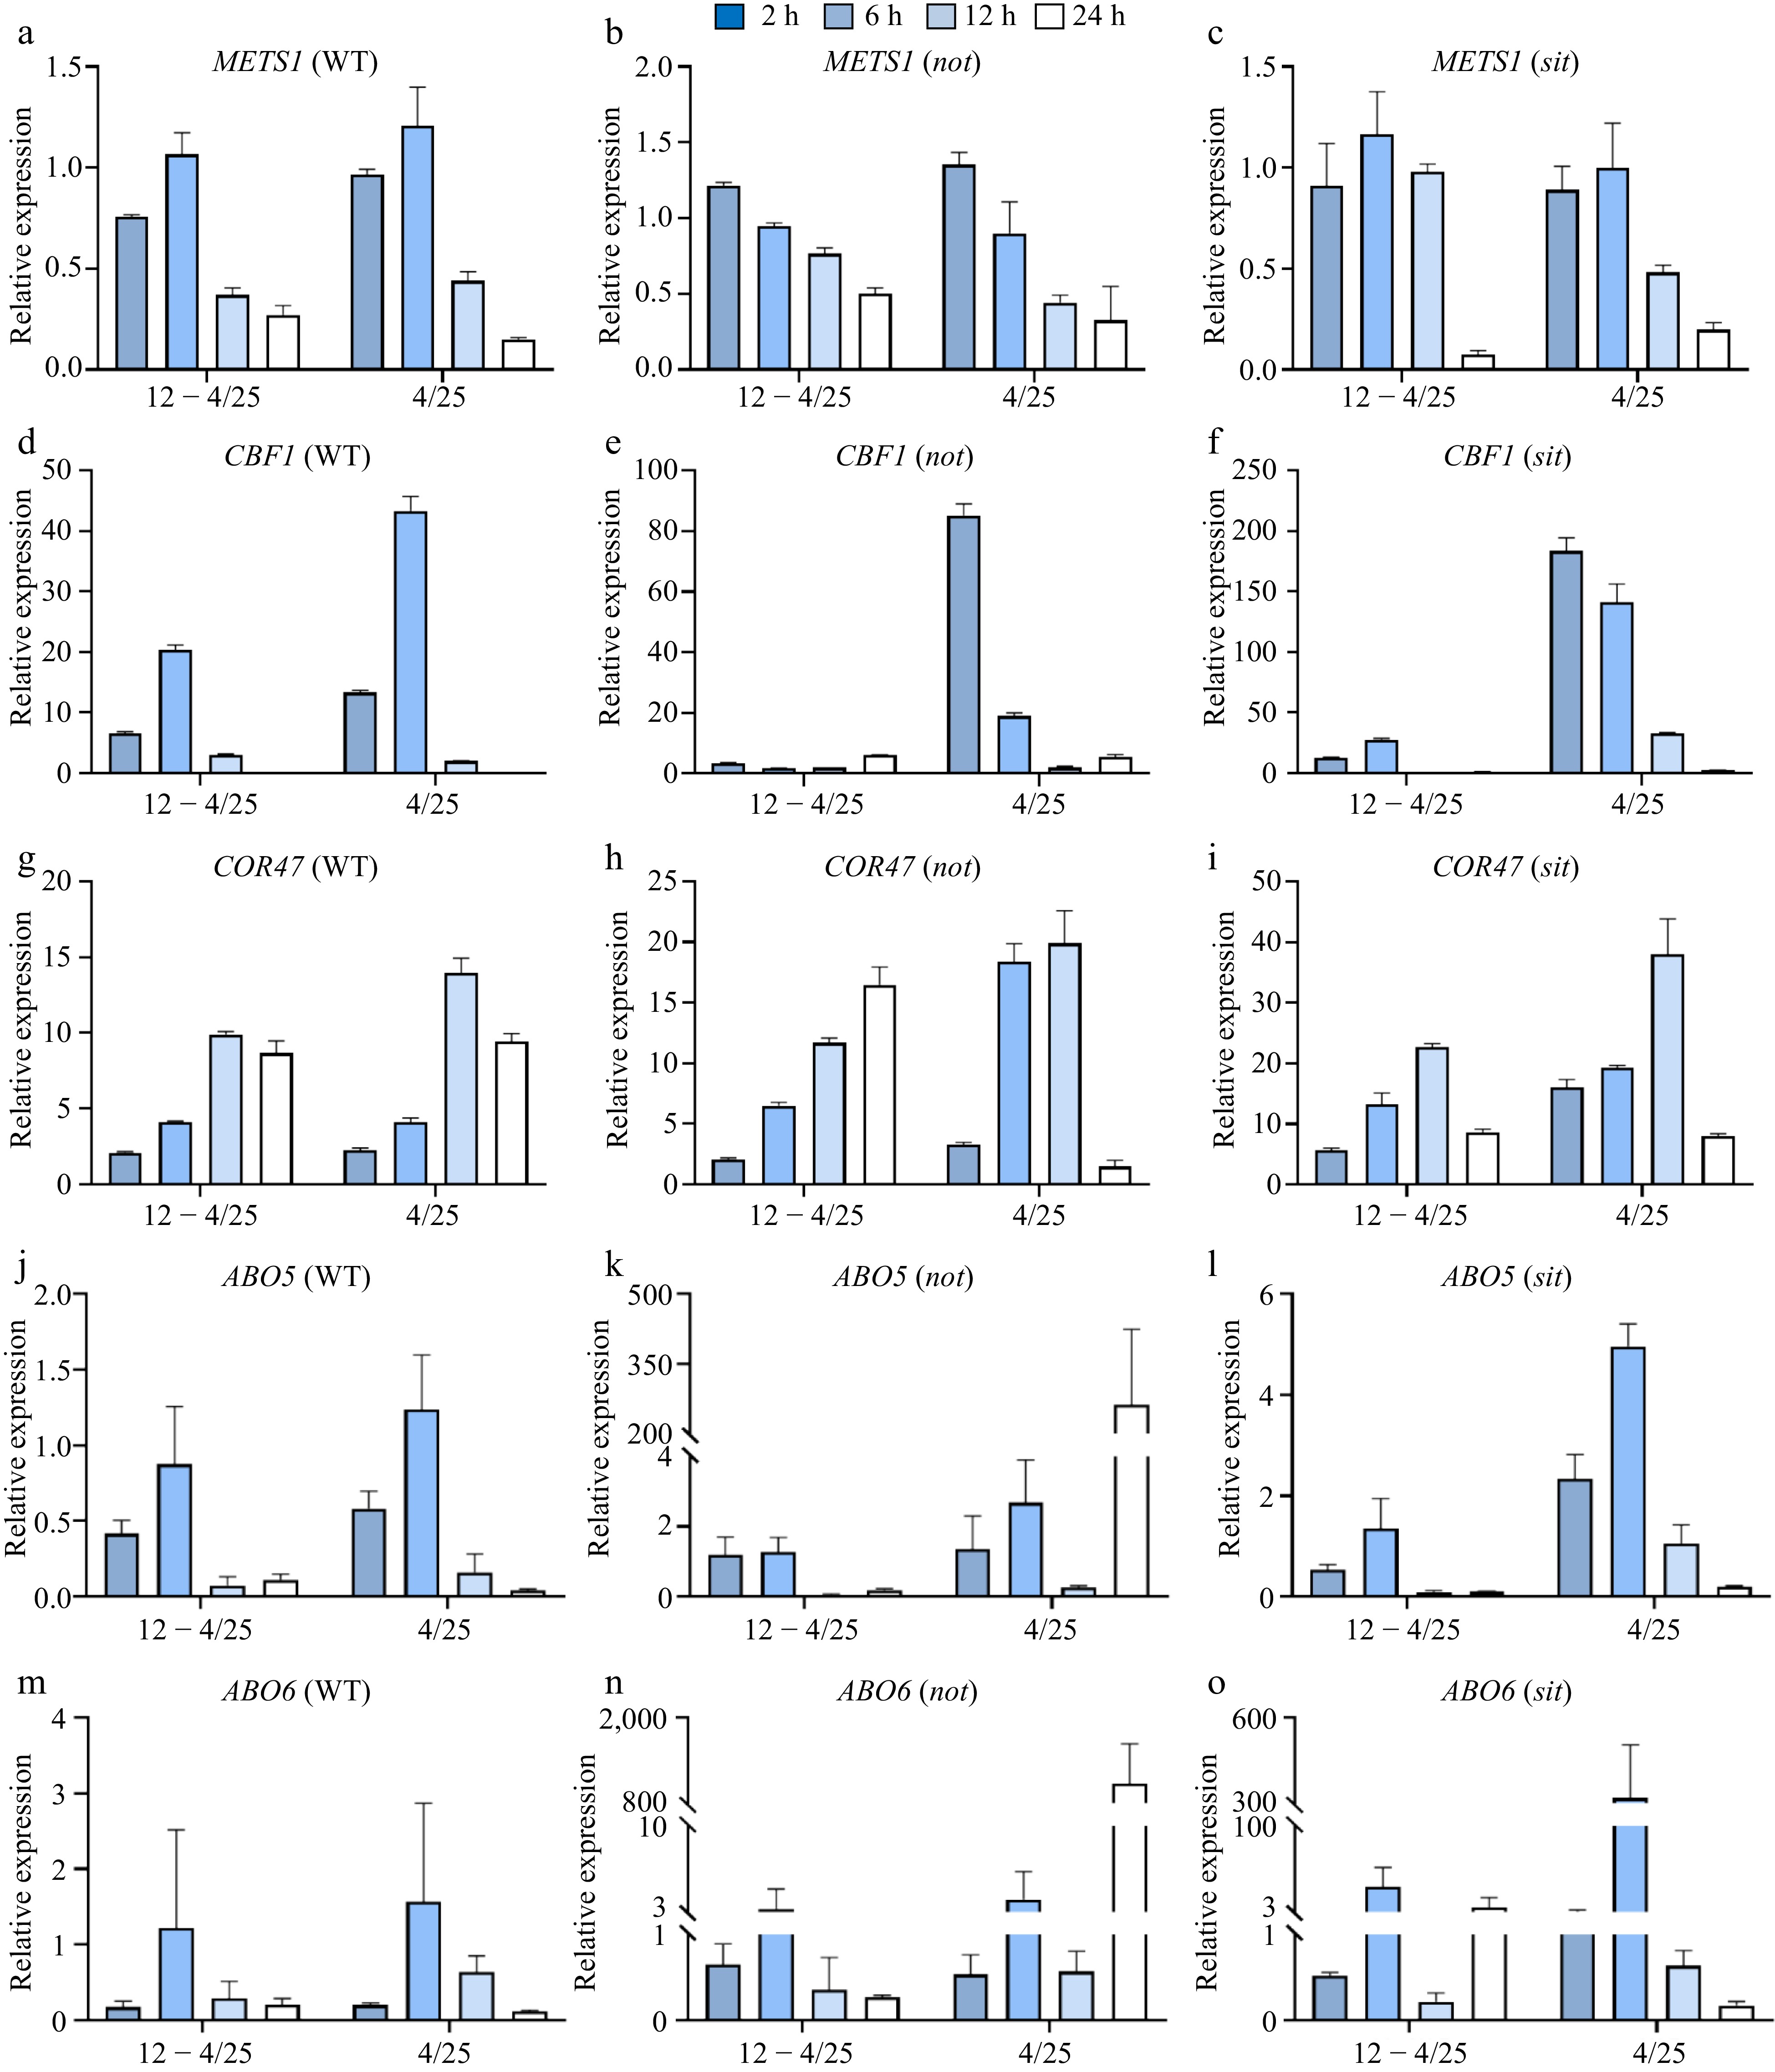
Figure 3.
Expression dynamics of SlMETS1, CBF1, COR47, ABO5 and ABO6 under cold stress. Cold treatments of plants and time-course experiments were the same as described in Fig. 2. Gene relative expression levels were determined by RT-qPCR in tomato WT, not, and sit. The expression levels under cold acclimation and 4 °C cold stress were normalized to room temperature (12 − 4/25, 4/25), and SlEfα was used as internal reference. Relative expression of (a)−(c) SlMETS1, (d)−(f) CBF1, (g)−(i) COR47, (j)−(l) ABO5, and (m)−(o) ABO6, respectively. The experiments were repeated at least three times with similar results.
-
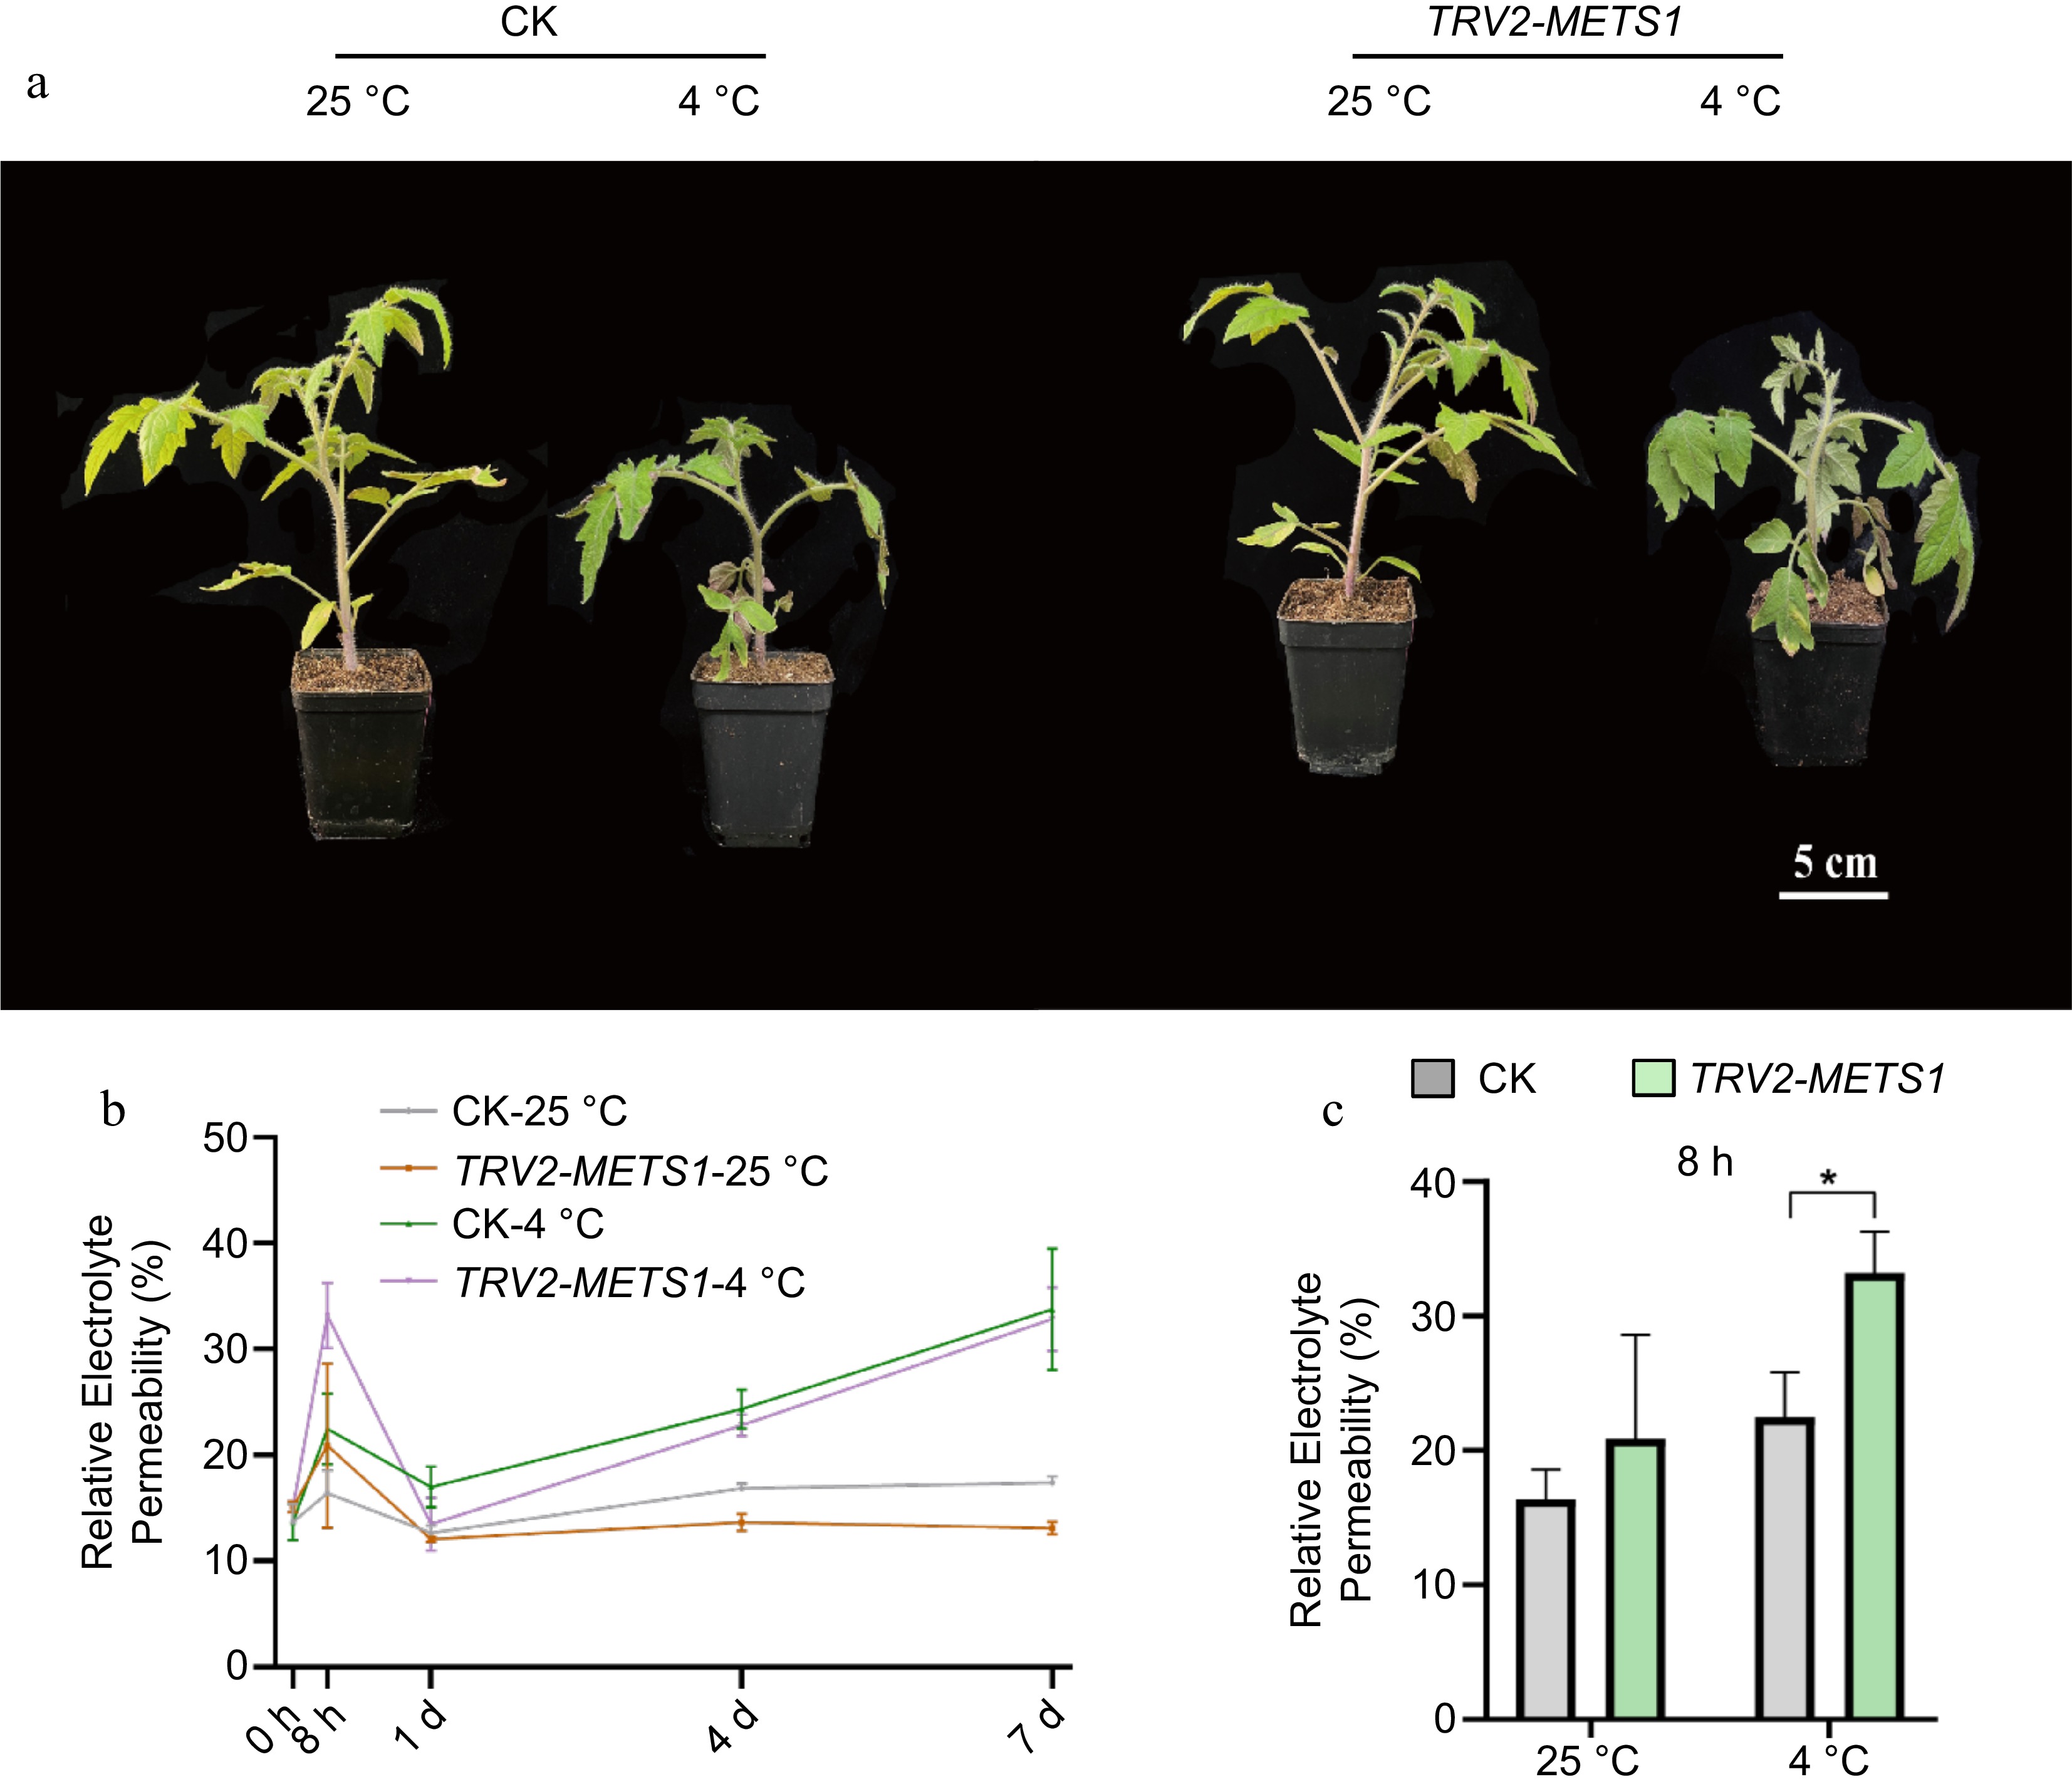
Figure 4.
SlMETS1 inhibition increases sensitivity to early 4 °C cold stress in tomato. SlMETS1 suppression allele (TRV2-SlMETS1) was obtained by VIGS via TRV2-SlMETS1 construct, while the control (CK) was transformed with TRV2 construct without SlMETS1 insertion. (a) Representative phenotype of plants TRV2-SlMETS1 and the CK at 25 and 4 °C for 8 h. (b) Relative Electrolyte Permeability (REP) of TRV2-SlMETS1 and the CK plants exposed to 4 or 25 °C for 0 h, 8 h, 1 d, 4 d, and 7 d. (c) REP of TRV2-SlMETS1 and the CK plants exposed to 4 or 25 °C for 8 h. Represented values were obtained from minimum three replicates, with each containing nine seedlings. REP difference among groups were detected by t-test. *, p < 0.05, **, p < 0.01, n = 9.
Figures
(4)
Tables
(0)