-
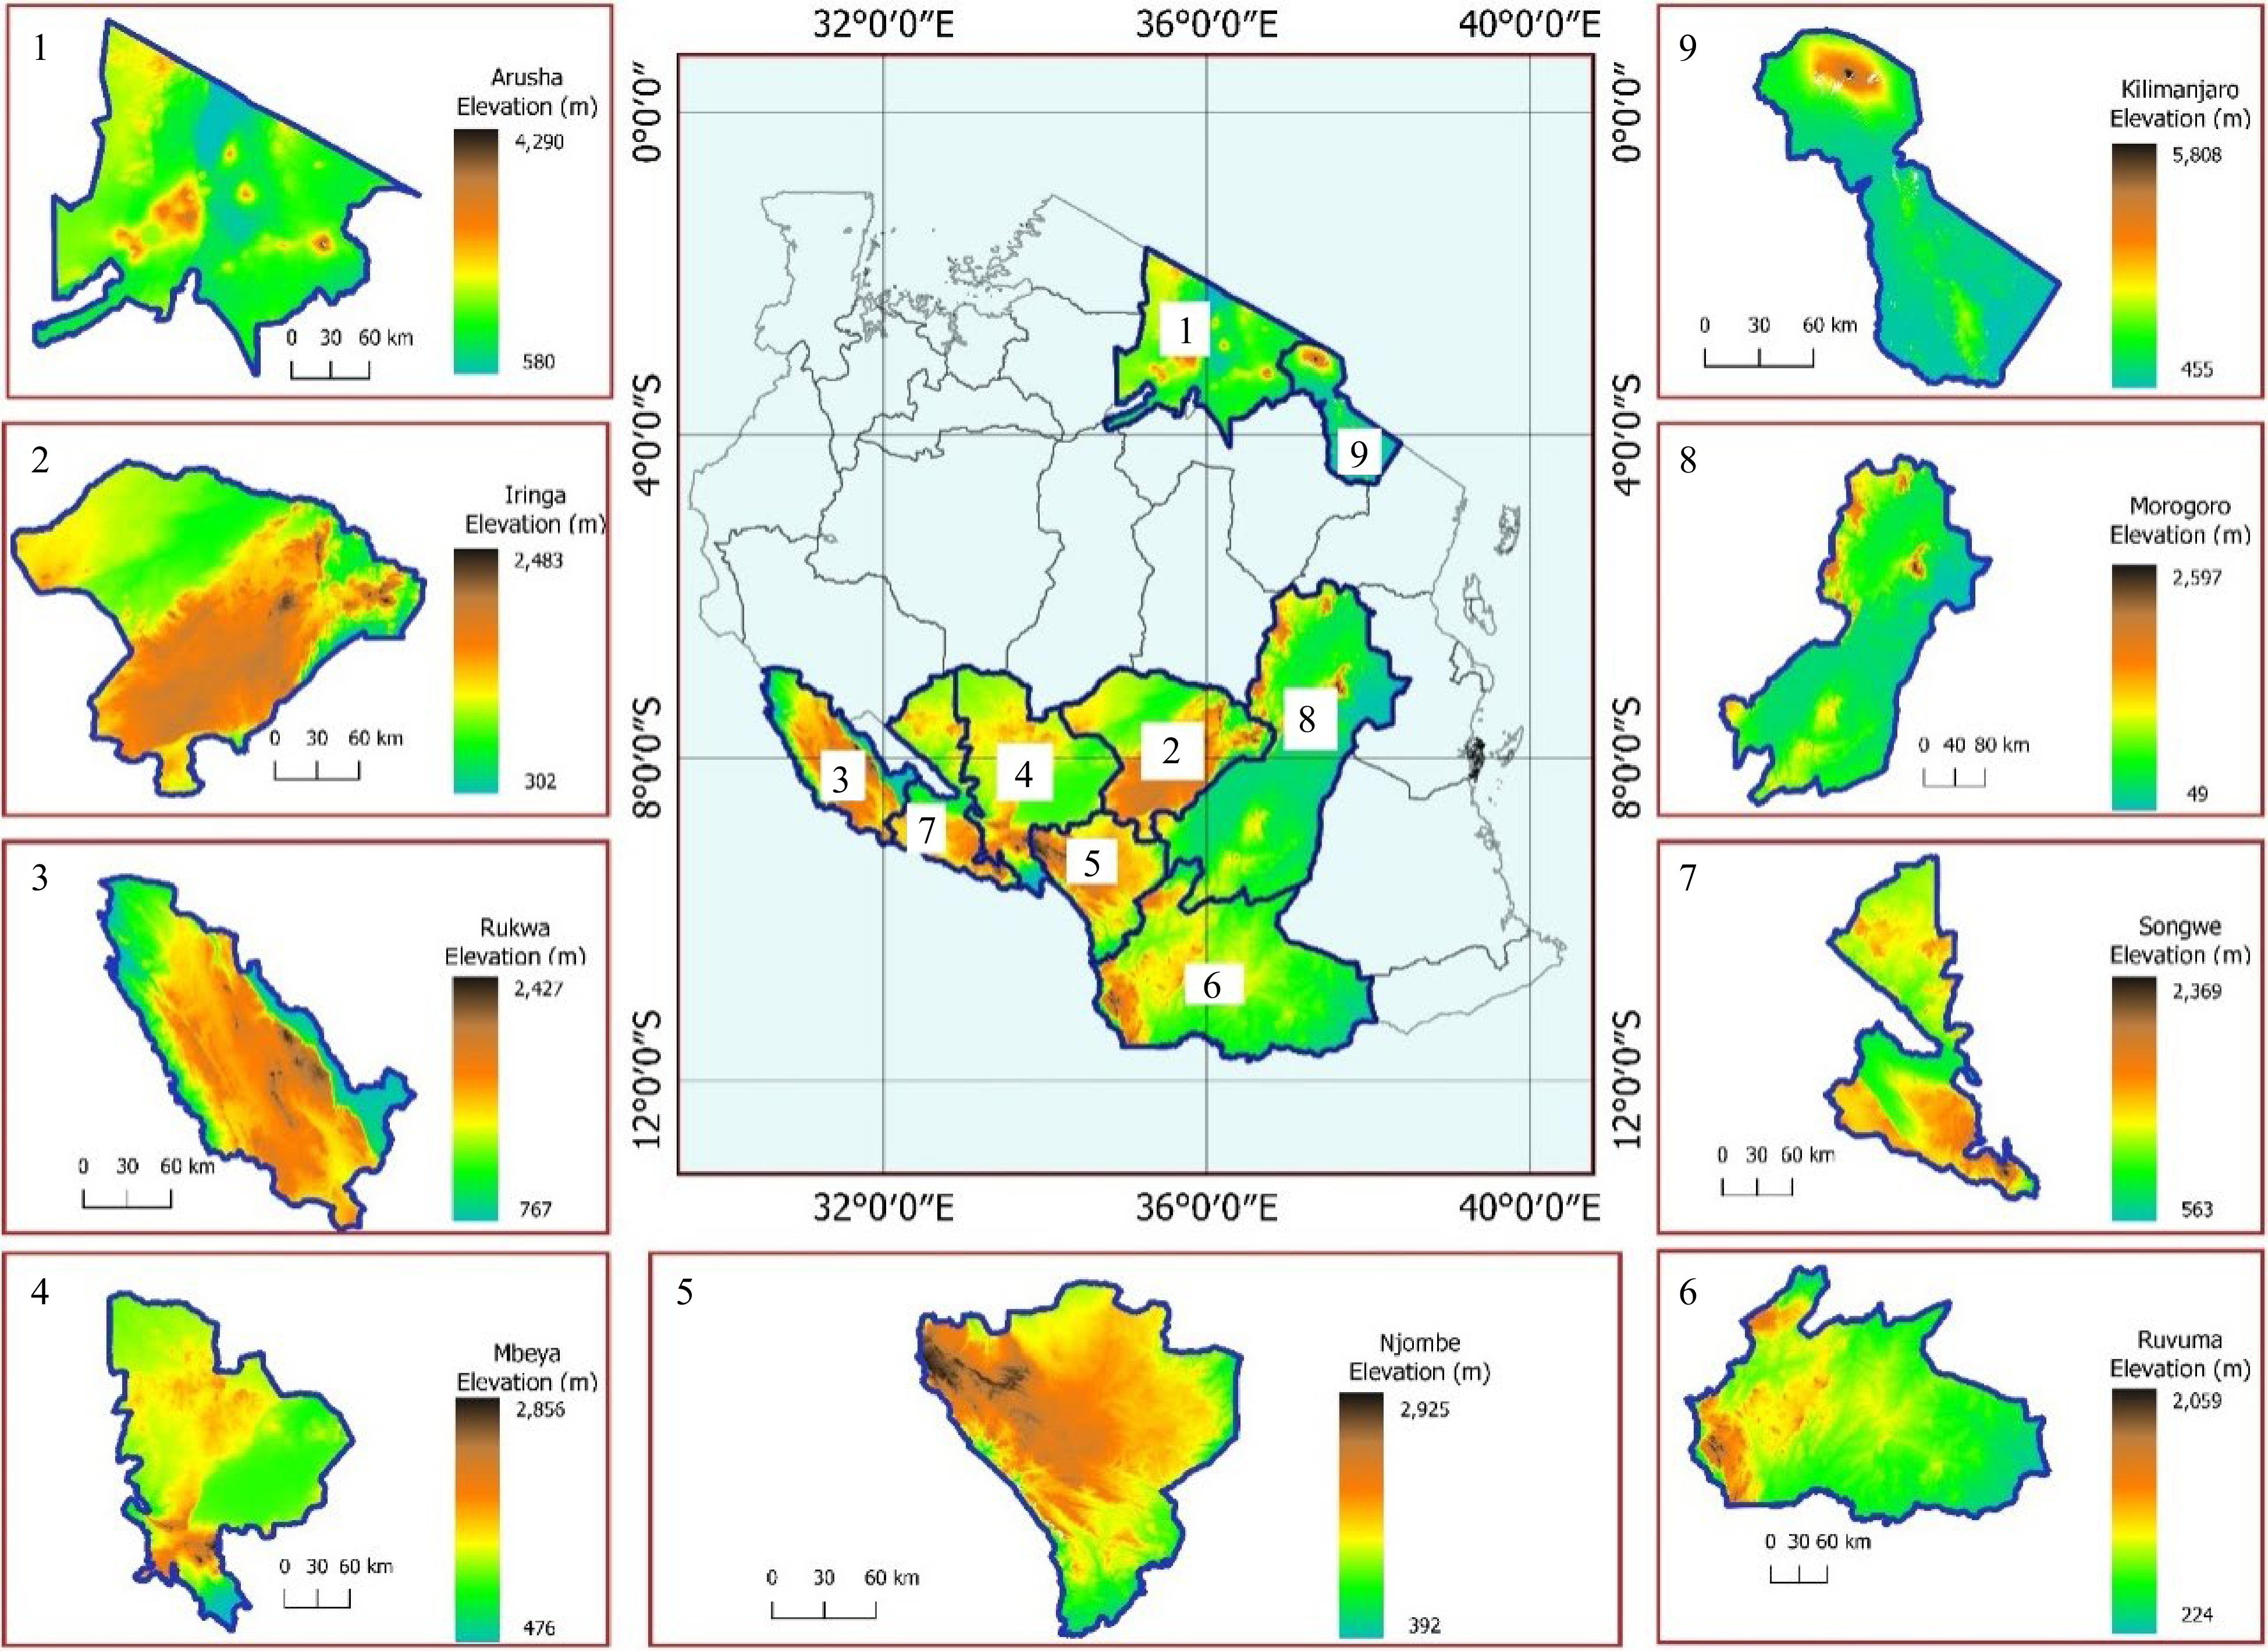
Figure 1.
Map showing maximum and minimum elevations of the regions in the study sites.
-
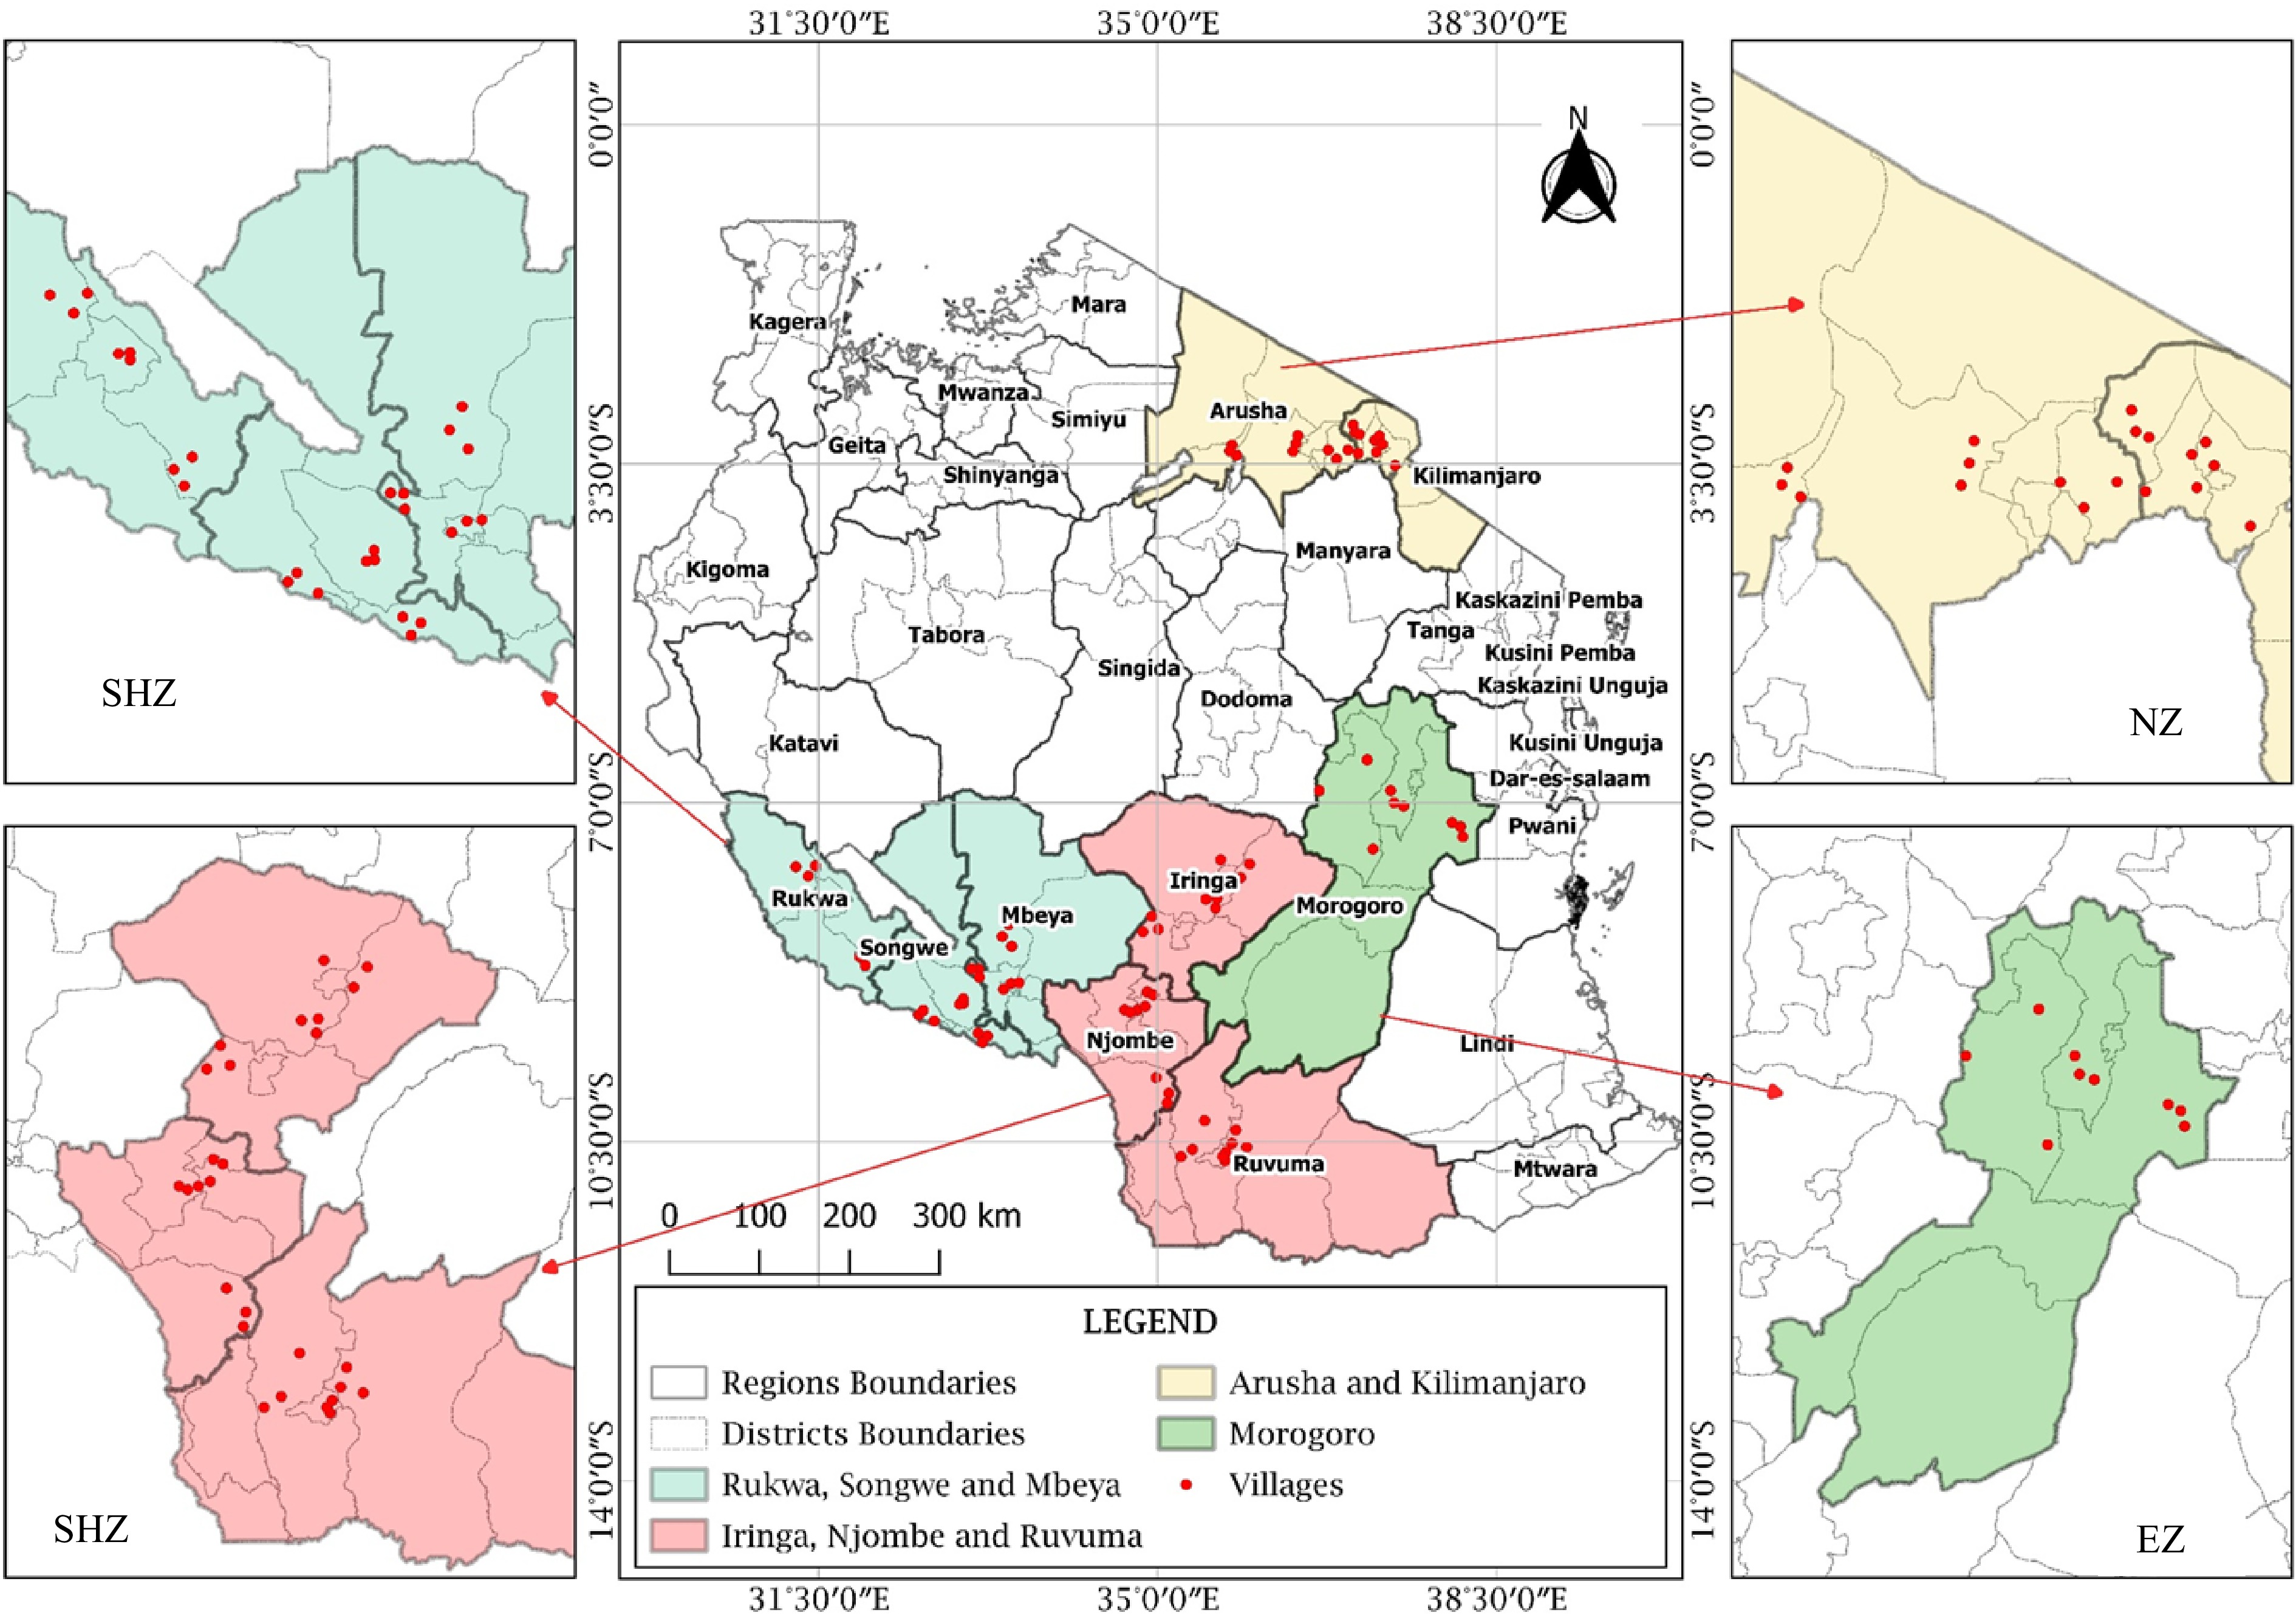
Figure 2.
Map showing soil and nodules sampling fields in different regions of Tanzania (SHZ-Southern Highland Zone, EZ-Eastern Zone and NZ-Northern Zone).
-
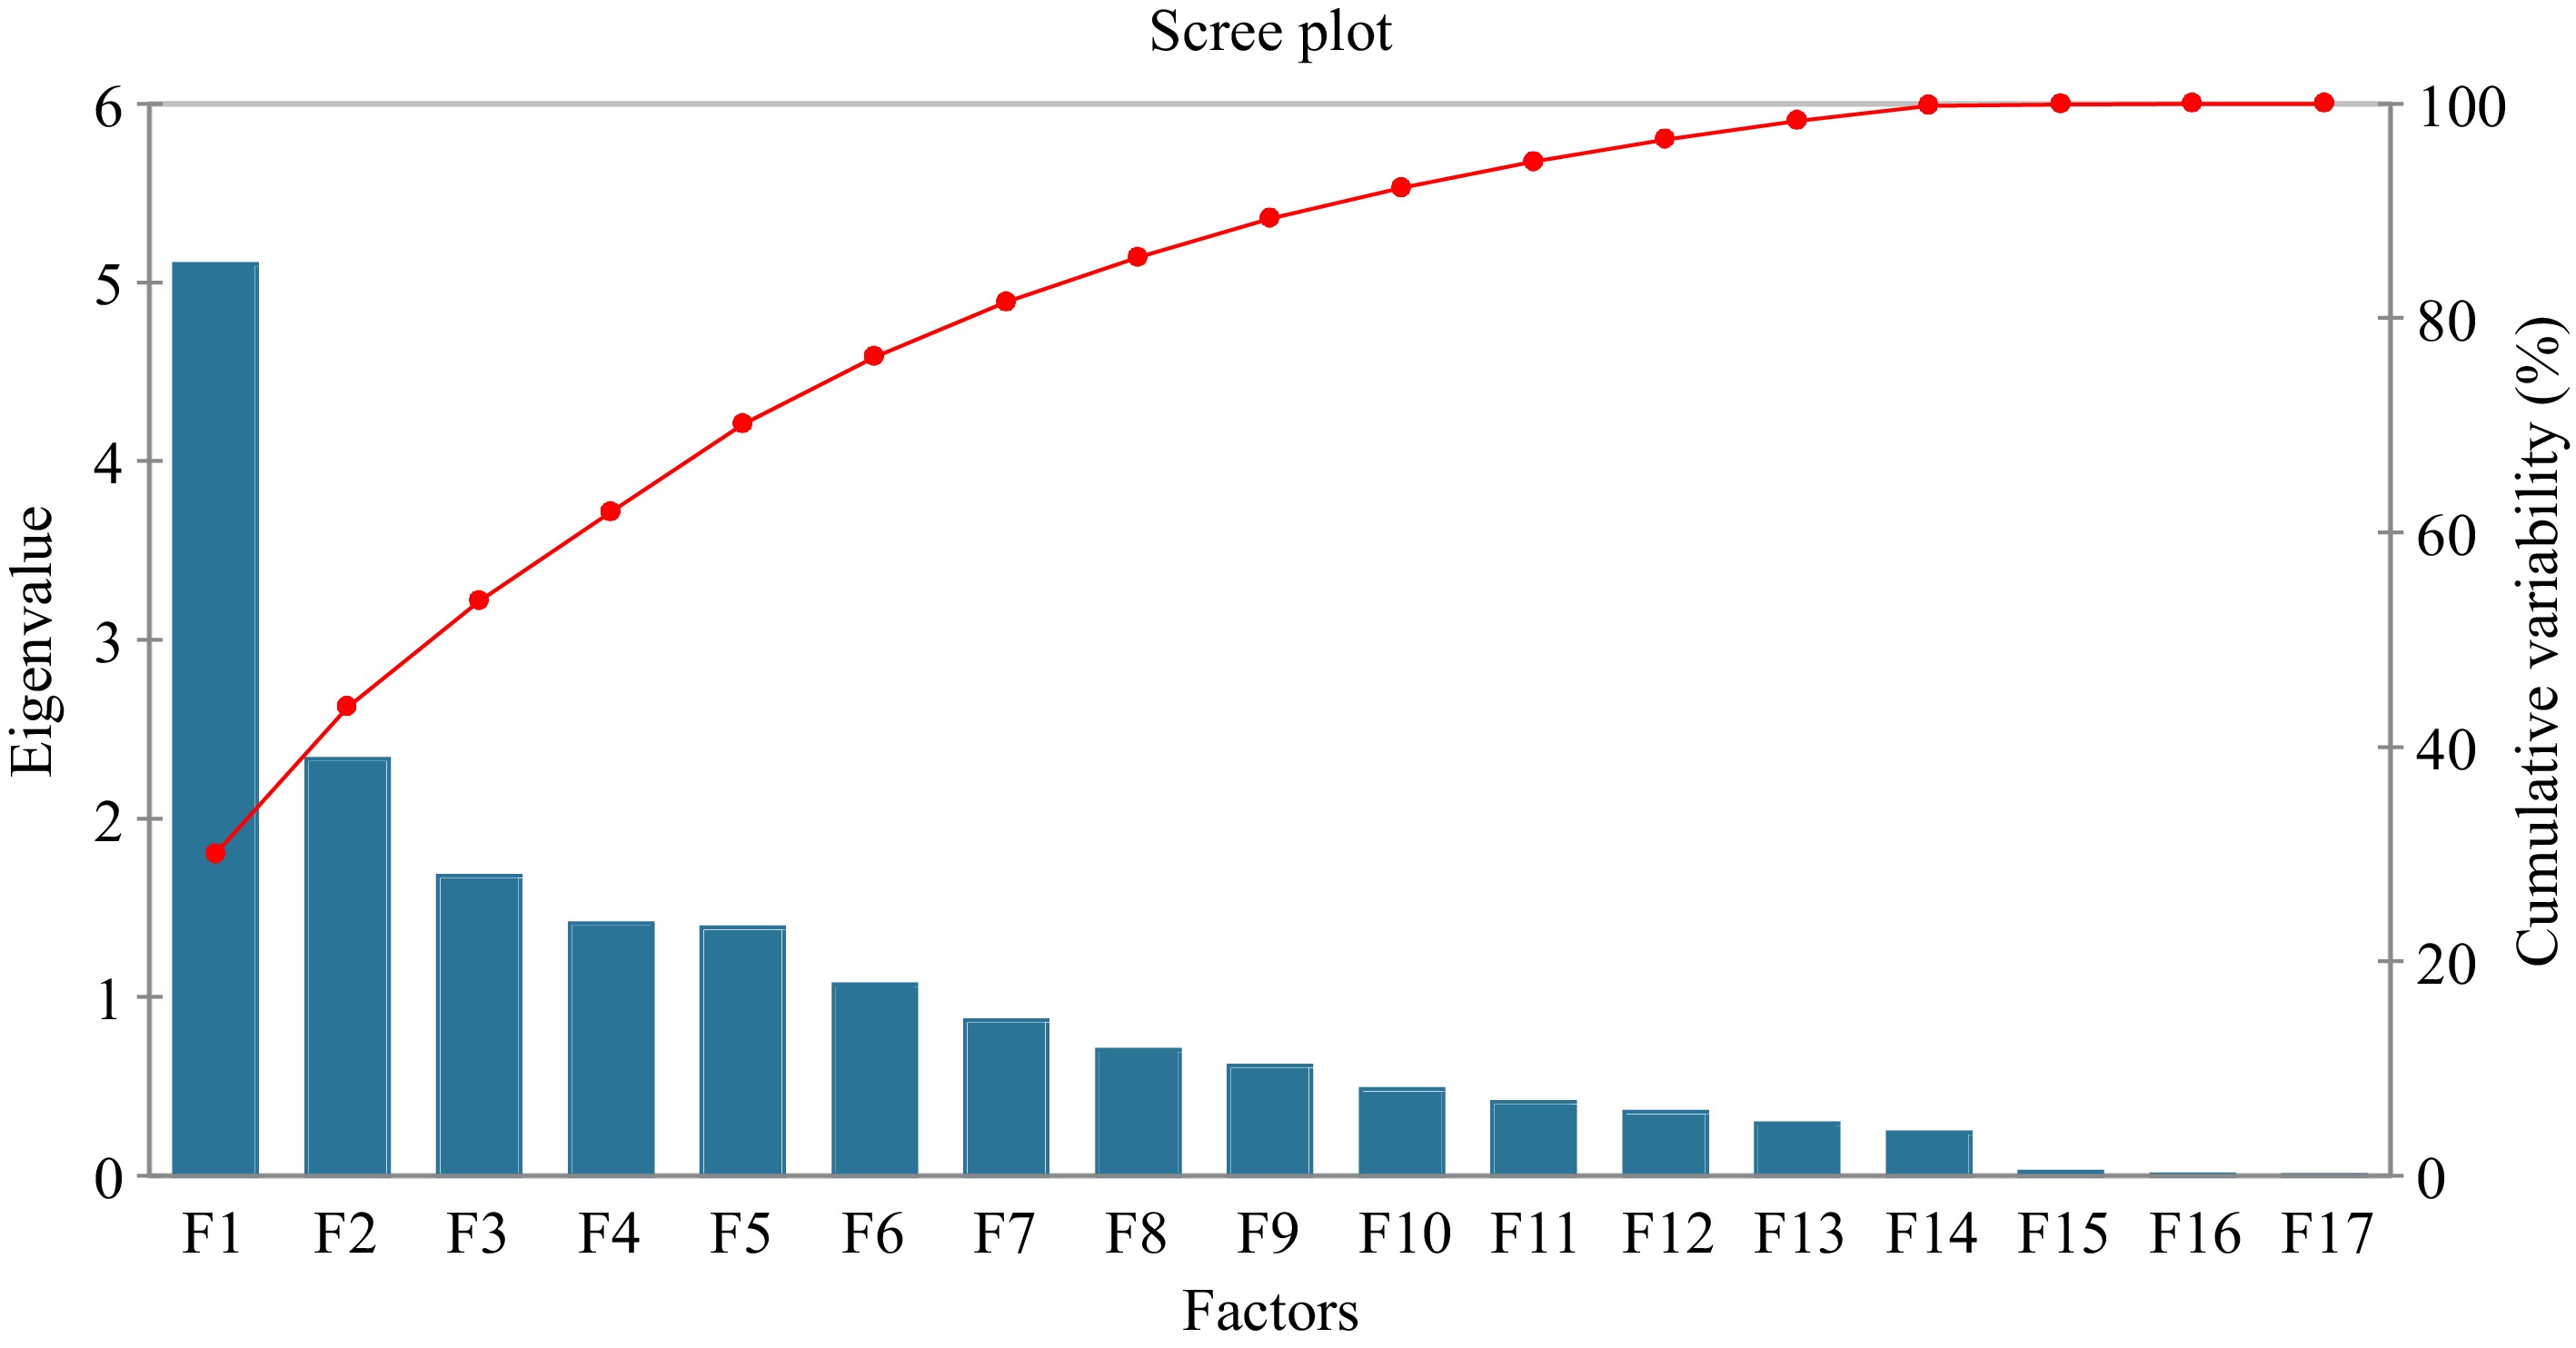
Figure 3.
Eigen values and cumulative variability of the Principal Component Analysis.
-

Figure 4.
Principal component plot of soil physicochemical properties (81 samples).
-
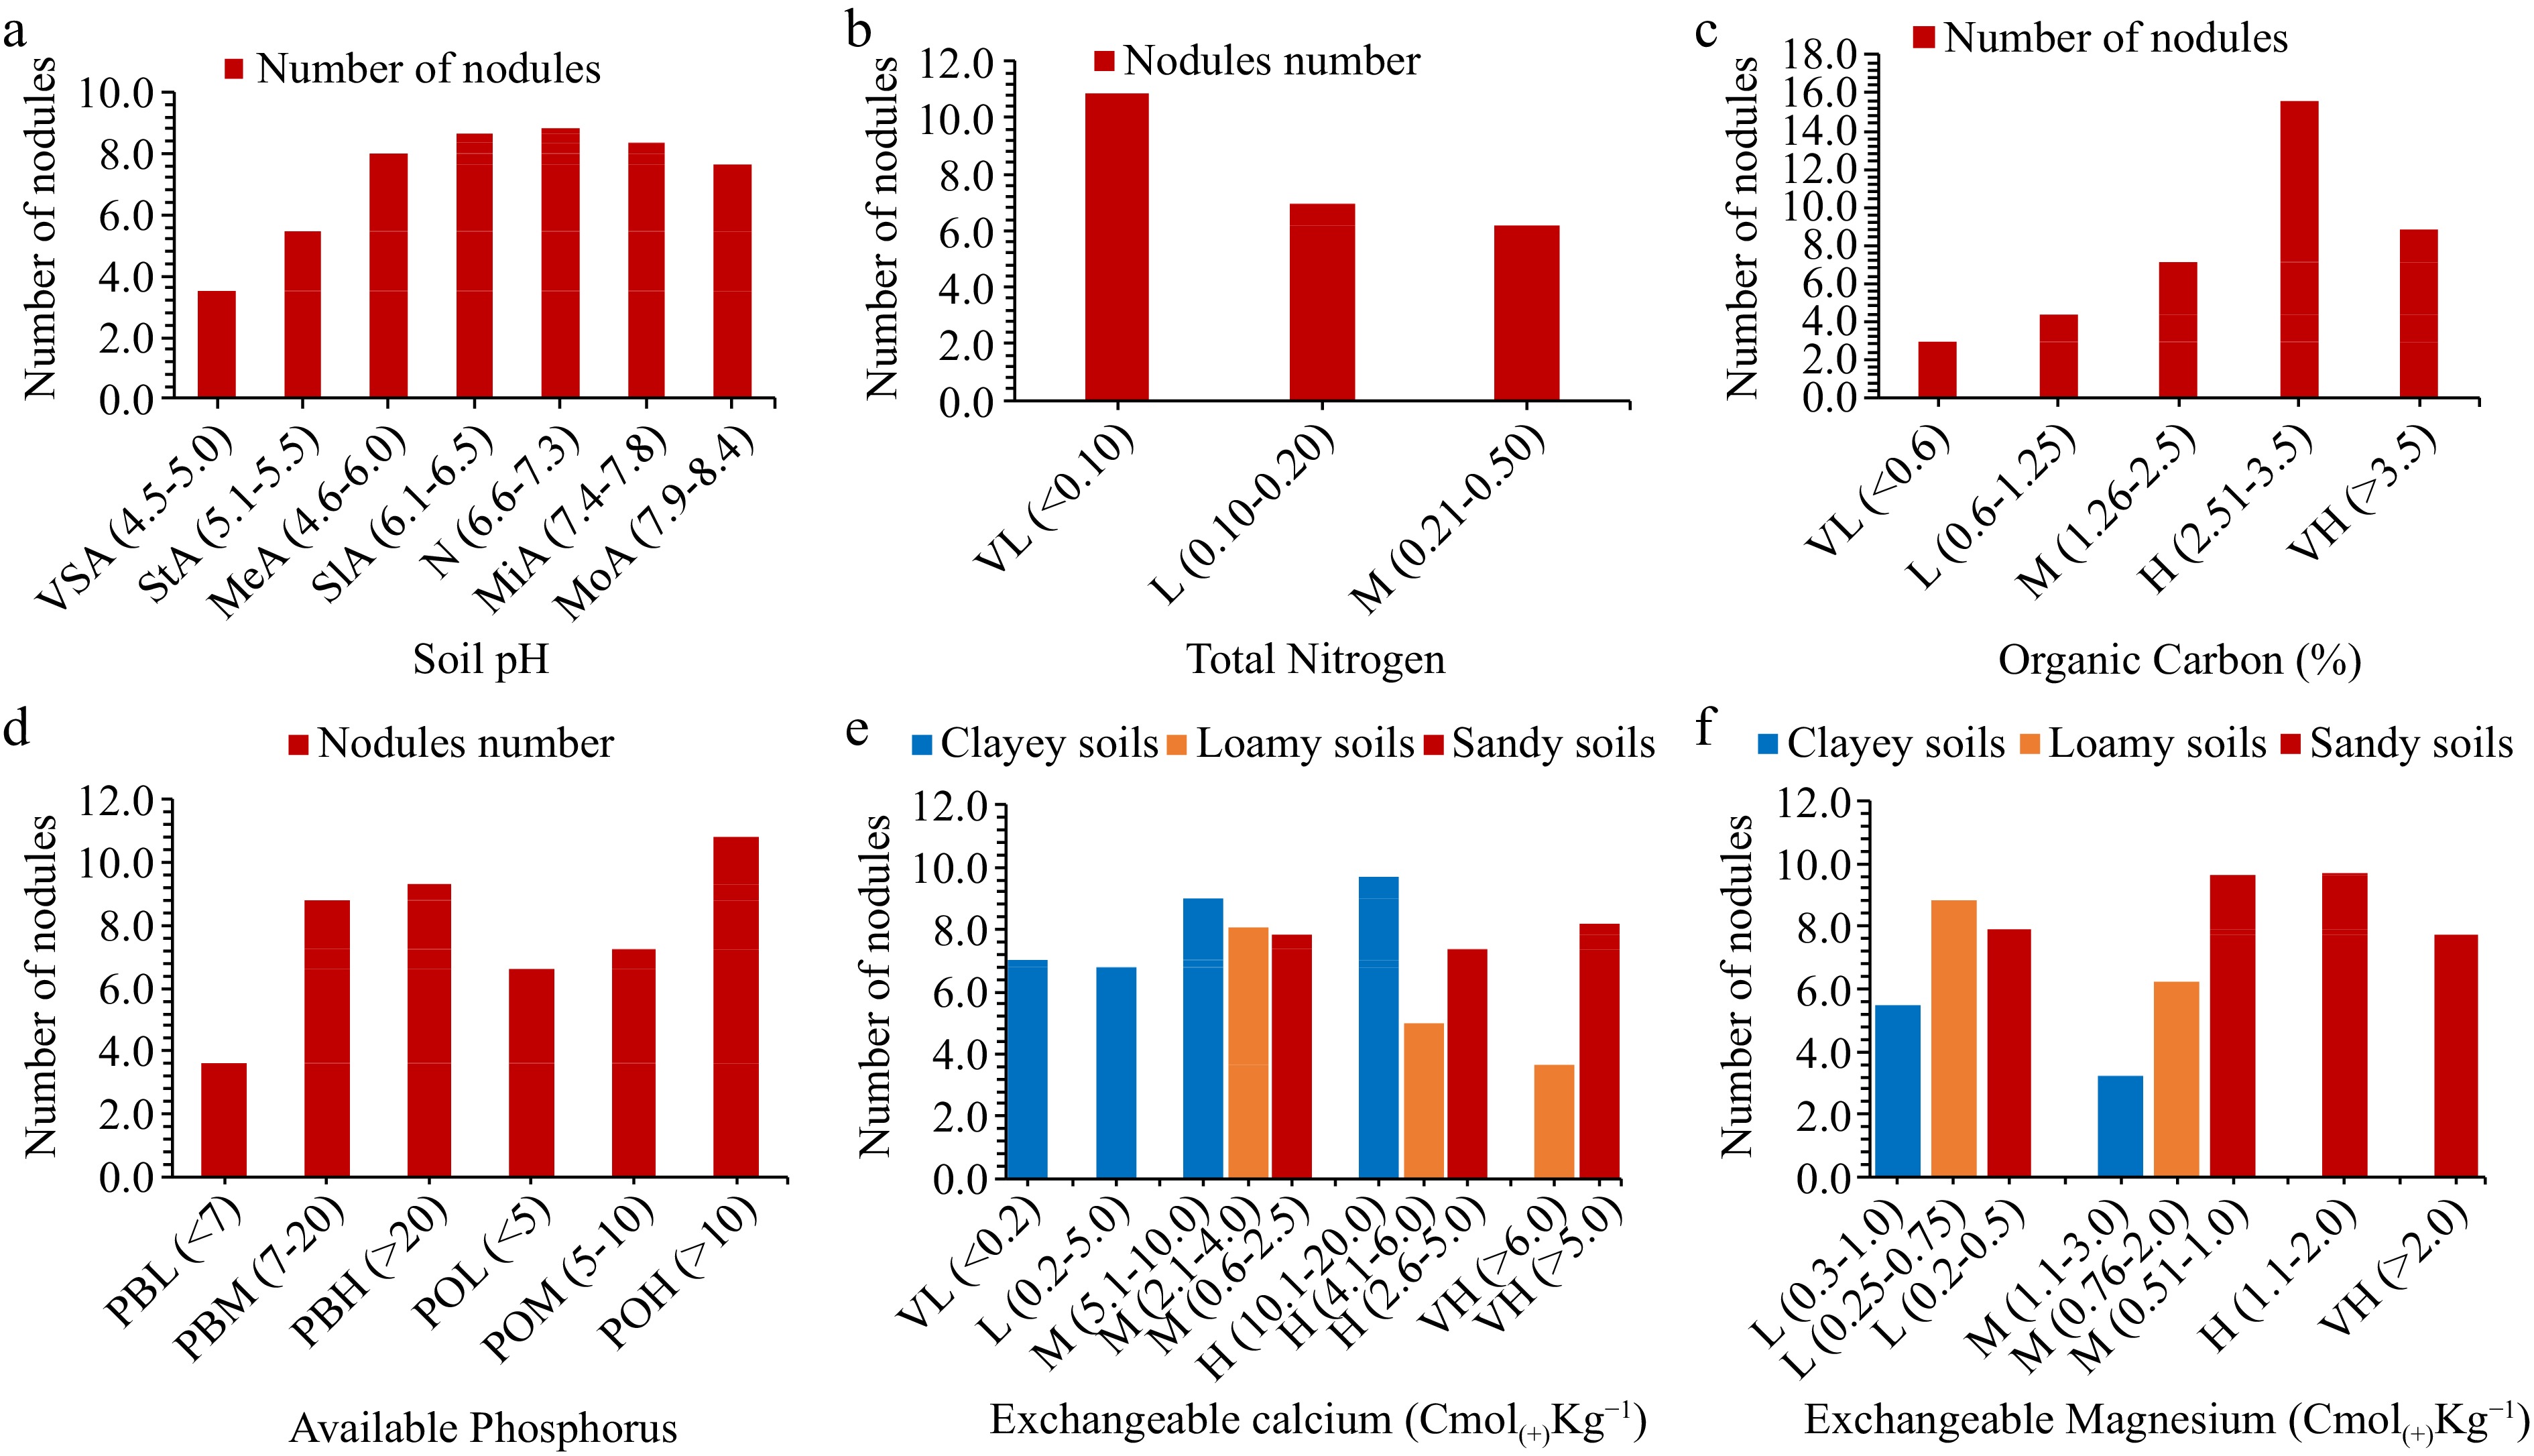
Figure 5.
The influence of total nitrogen, organic carbon and extractable phosphorus on nodulation (VL = very low, L = low, M = medium, H = high and VH = very high), soil pH ratings as per Msanya[36] (VSA = very strongly acidic, StA = strongly acidic, MeA = medium acidic, SlA = slightly acidic, N = neutral, MiA = mildly alkaline and MoA = moderate alkaline.
-

Figure 6.
The influence of exchangeable potassium, soil texture and micronutrients on nodulation (VL = very low, L = low, M = medium, H = high and VH = very high), soil texture (C = clay, CL = clay loam, LS = loamy sand, S = sandy, SC = sandy clay, SCL = sandy clay loam and SL = sandy loam).
-
Parameter Number Minimum Maximum Mean Std. deviation Soil pH (1:2.5) (H2O) 81 4.480 7.923 6.222 0.655 Cu (mg·kg−1) 81 0.048 49.185 3.312 7.984 Zn (mg·kg−1) 81 0.062 40.778 4.410 5.859 Mn (mg·kg−1) 81 1.597 172.535 80.462 43.892 Fe (mg·kg−1) 81 7.840 526.726 66.553 63.671 TN-Kjeld (%) 81 0.066 0.378 0.153 0.074 OC-BlkW (%) 81 0.427 4.993 1.663 0.893 C/N ratio 81 4.670 19.778 11.385 2.591 Ext. P (mg·kg−1) 81 2.352 166.179 33.909 37.264 CEC (cmol(+)Kg−1) 81 1.913 20.801 7.899 4.582 Ca2+ (cmol(+)Kg−1) 81 0.202 14.375 5.099 3.698 Mg2+ (cmol(+)Kg−1) 81 0.177 3.479 1.257 0.906 Na+ (cmol(+)Kg−1) 81 0.000 0.255 0.026 0.034 K+ (cmol(+)Kg−1) 81 0.034 2.692 0.277 0.397 Total acidity
(cmol(+)Kg−1)81 0.085 5.153 0.292 0.589 Exch. Al
(cmol(+)Kg−1)81 0.000 0.847 0.045 0.125 Exch. H
(cmol(+)Kg−1)81 0.000 4.743 0.247 0.543 Table 1.
Soil chemical parameters of the study sites.
-
Variables F1 F2 F3 F4 F5 Soil pH (1:2.5) (H2O) 0.209 −0.143 0.520 0.031 0.033 Cu (mg·kg−1) 0.077 −0.002 −0.113 0.332 −0.515 Zn (mg·kg−1) 0.212 0.045 −0.008 0.521 0.045 Mn (mg·kg−1) −0.115 0.034 −0.066 0.406 −0.399 Fe (mg·kg−1) 0.015 0.318 −0.128 0.169 −0.008 TN-Kjeld (%) 0.291 0.104 −0.473 −0.071 −0.136 OC-BlkW (%) 0.284 0.137 −0.493 0.058 0.185 C/N ratio 0.063 0.115 −0.114 0.209 0.654 Ext. P (mg·kg−1) 0.285 0.050 0.304 0.190 −0.025 CEC (cmol(+)Kg−1) 0.406 0.089 0.157 0.021 0.010 Ca2+ (cmol(+)Kg−1) 0.396 0.008 0.171 0.093 0.025 Mg2+( cmol(+)Kg−1) 0.364 0.014 0.069 −0.014 0.006 Na+ (cmol(+)Kg−1) 0.251 0.035 −0.044 −0.431 −0.287 K+ (cmol(+)Kg−1) 0.317 0.058 −0.042 −0.345 −0.074 Total acidity (cmol(+)Kg−1) −0.103 0.606 0.171 −0.047 −0.040 Exch. Al (cmol(+)Kg−1) −0.061 0.335 0.044 −0.139 −0.026 Exch. H (cmol(+)Kg−1) −0.102 0.581 0.174 −0.021 −0.037 Table 2.
Summarization of the Principal Component Analysis.
-
Parameters Nodules Soil pH % C/N
ratioMg/kg cmol(+)kg-1 Mg/kg TN-Kjeld OC-BlkW Ext. P CEC Ca2+ Mg2+ Na+ K+ Tot. acidity Al3+ H+ Cu Zn Mn Fe Nodules − Soil pH 0.14* − TN-Kjeld −0.22* −0.056ns − OC-BlkW −0.27* −0.09ns 0.88*** − C/N ratio −0.13ns −0.03ns −0.03ns 0.37*** − Ext. P −0.11ns 0.48*** 0.22* 0.24* 0.07ns − CEC −0.19ns 0.46*** 0.47*** 0.47*** 0.12ns 0.61*** − Ca2+ −0.15ns 0.52*** 0.43*** 0.44*** 0.11ns 0.61*** 0.97*** − Mg2+ −0.24* 0.39*** 0.50*** 0.47*** 0.07ns 0.54*** 0.79*** 0.70*** − Na+ −0.07ns 0.21ns 0.44*** 0.24* −0.12ns 0.16ns 0.47*** 0.42*** 0.38*** − K+ −0.03ns 0.23* 0.45*** 0.41*** 0.07ns 0.34** 0.62*** 0.52*** 0.51*** 0.68ns*** − Tot. acidity −0.07ns −0.17ns −0.11ns −0.10ns 0.05ns −0.03ns −0.04ns −0.16ns −0.15ns −0.05ns −0.08 − Al3+ 0.09ns −0.09ns 0.02ns 0.04ns −0.03ns 0.05ns −0.11ns −0.17ns −0.06ns −0.09ns 0.004 0.46*** − H+ −0.10ns −0.17ns −0.13ns −0.12ns 0.07ns −0.05ns −0.02ns −0.14ns −0.16ns −0.03ns −0.10 0.96*** 0.28* − Cu −0.15ns −0.01ns 0.18ns 0.09ns −0.16ns 0.19ns 0.11ns 0.12ns 0.07ns 0.09ns 0.07 −0.07 −0.09 −0.05 − Zn −0.05ns 0.23* 0.25* 0.33** 0.22ns 0.30** 0.42*** 0.46*** 0.31ns** 0.06ns 0.19 −0.08 −0.09 −0.07 0.17 − Mn 0.15ns −0.19ns −0.07ns −0.15ns −0.15ns −0.11ns −0.22ns −0.20ns −0.17ns −0.13ns −0.27* 0.10 0.06 0.09 0.17 0.14 − Fe −0.19ns −0.13ns 0.11ns 0.15ns 0.06ns −0.001ns 0.06ns 0.04ns 0.00ns −0.023ns 0.001 0.29** 0.004 0.32** 0.14 0.10 −0.08 − Correlation coefficients (r) in individual cells represent each correlation between variables. Values with asterisk (*) are statistically significant different at * < 0.05, ** p < 0.01 and *** p < 0.001. ns-non significant. The charges in initials of nutrient names represents exchangeable Table 3.
The correlation matrix among different soil chemical parameters and nodule number.
Figures
(6)
Tables
(3)