-
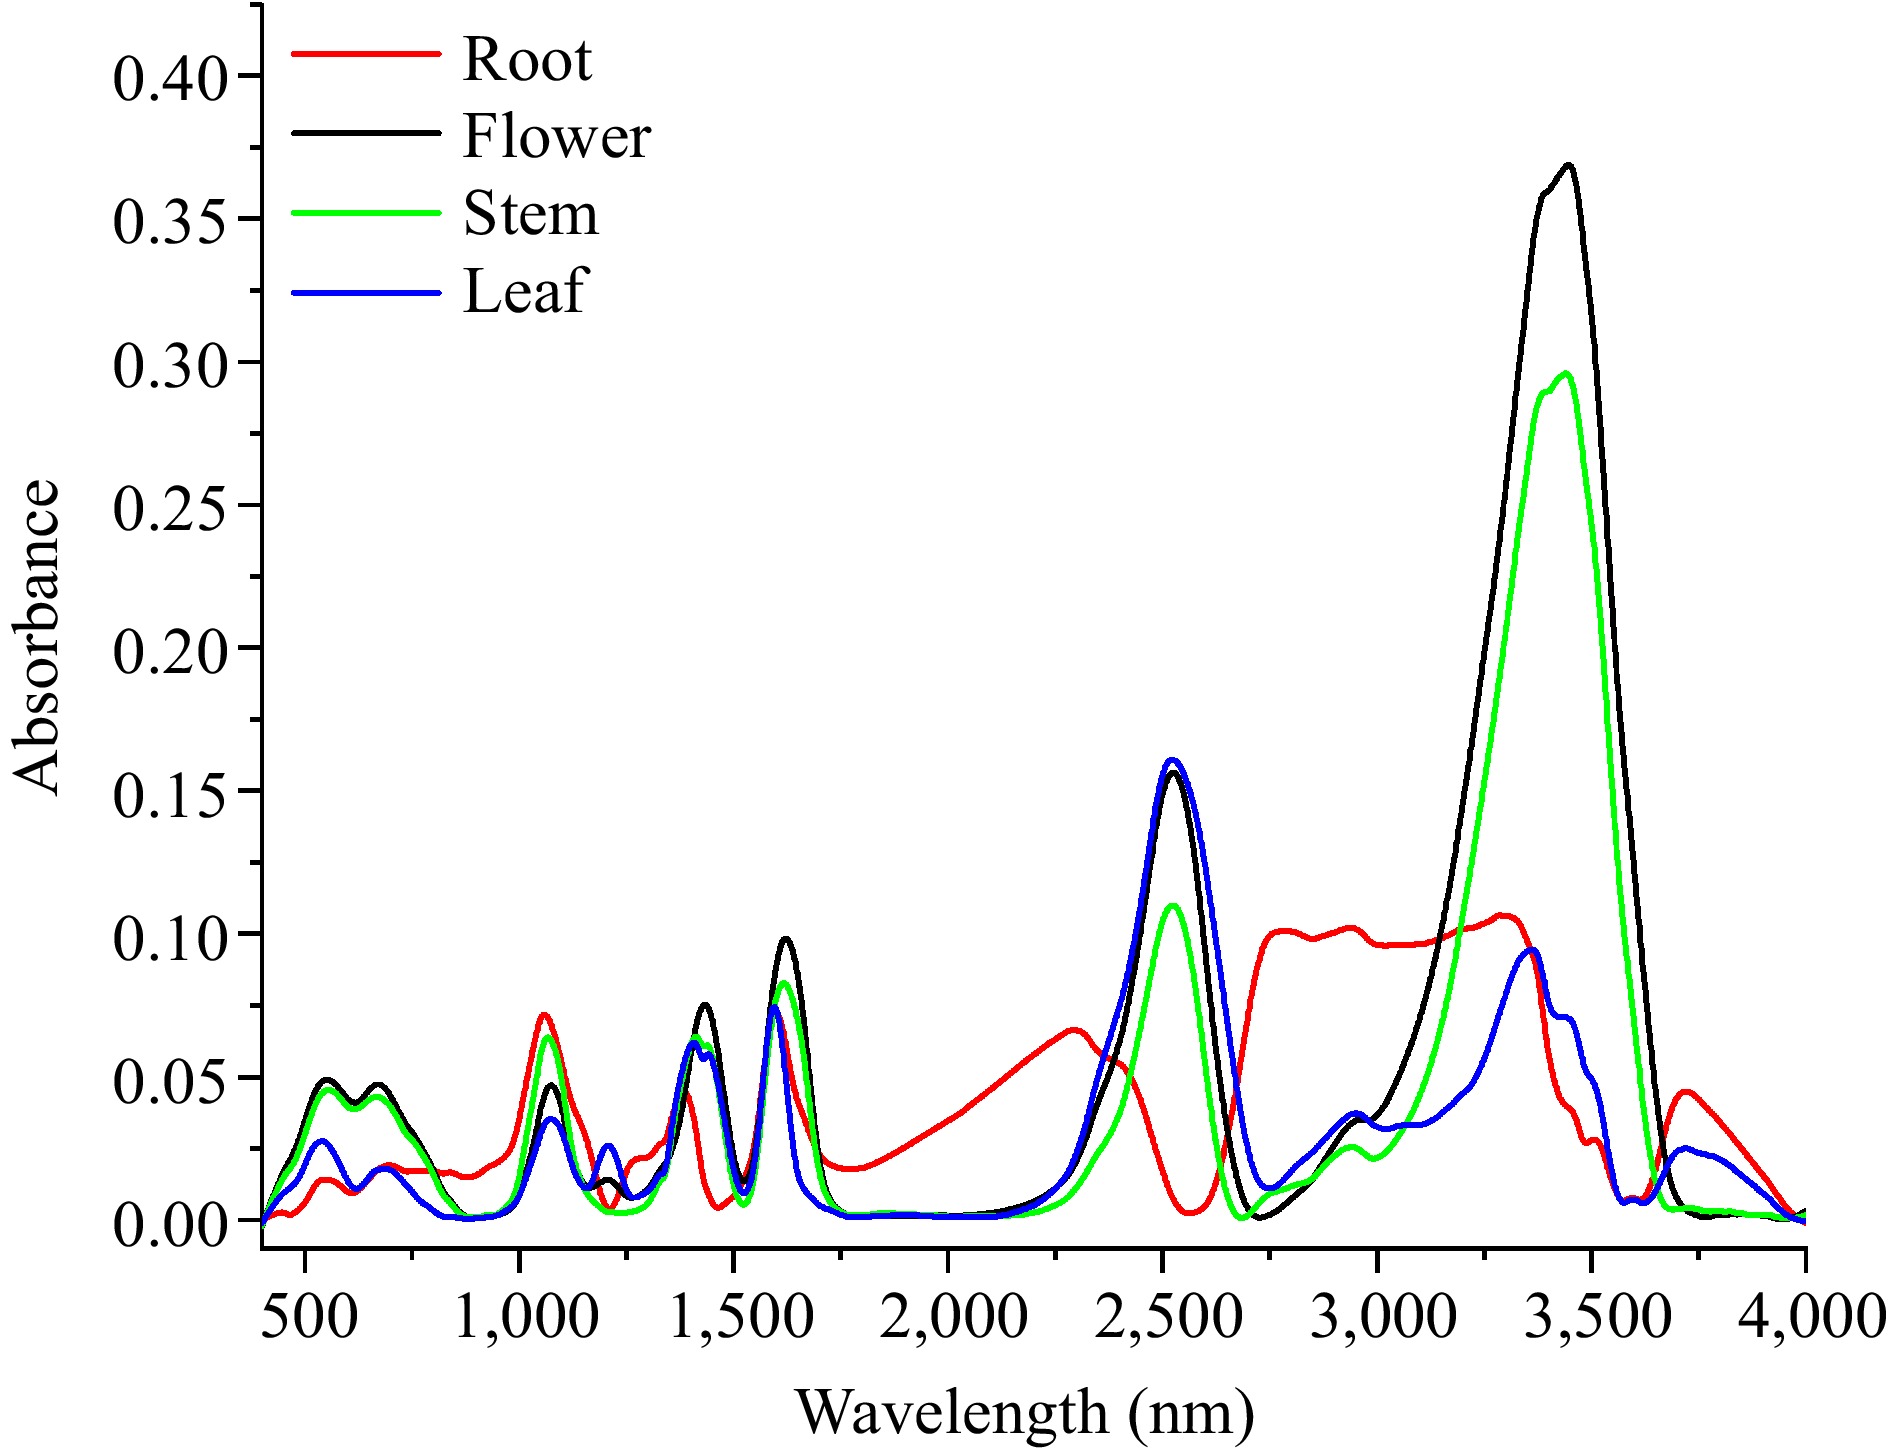
Figure 1.
Fourier transform infrared spectroscopy of dandelion tissue extracts.
-
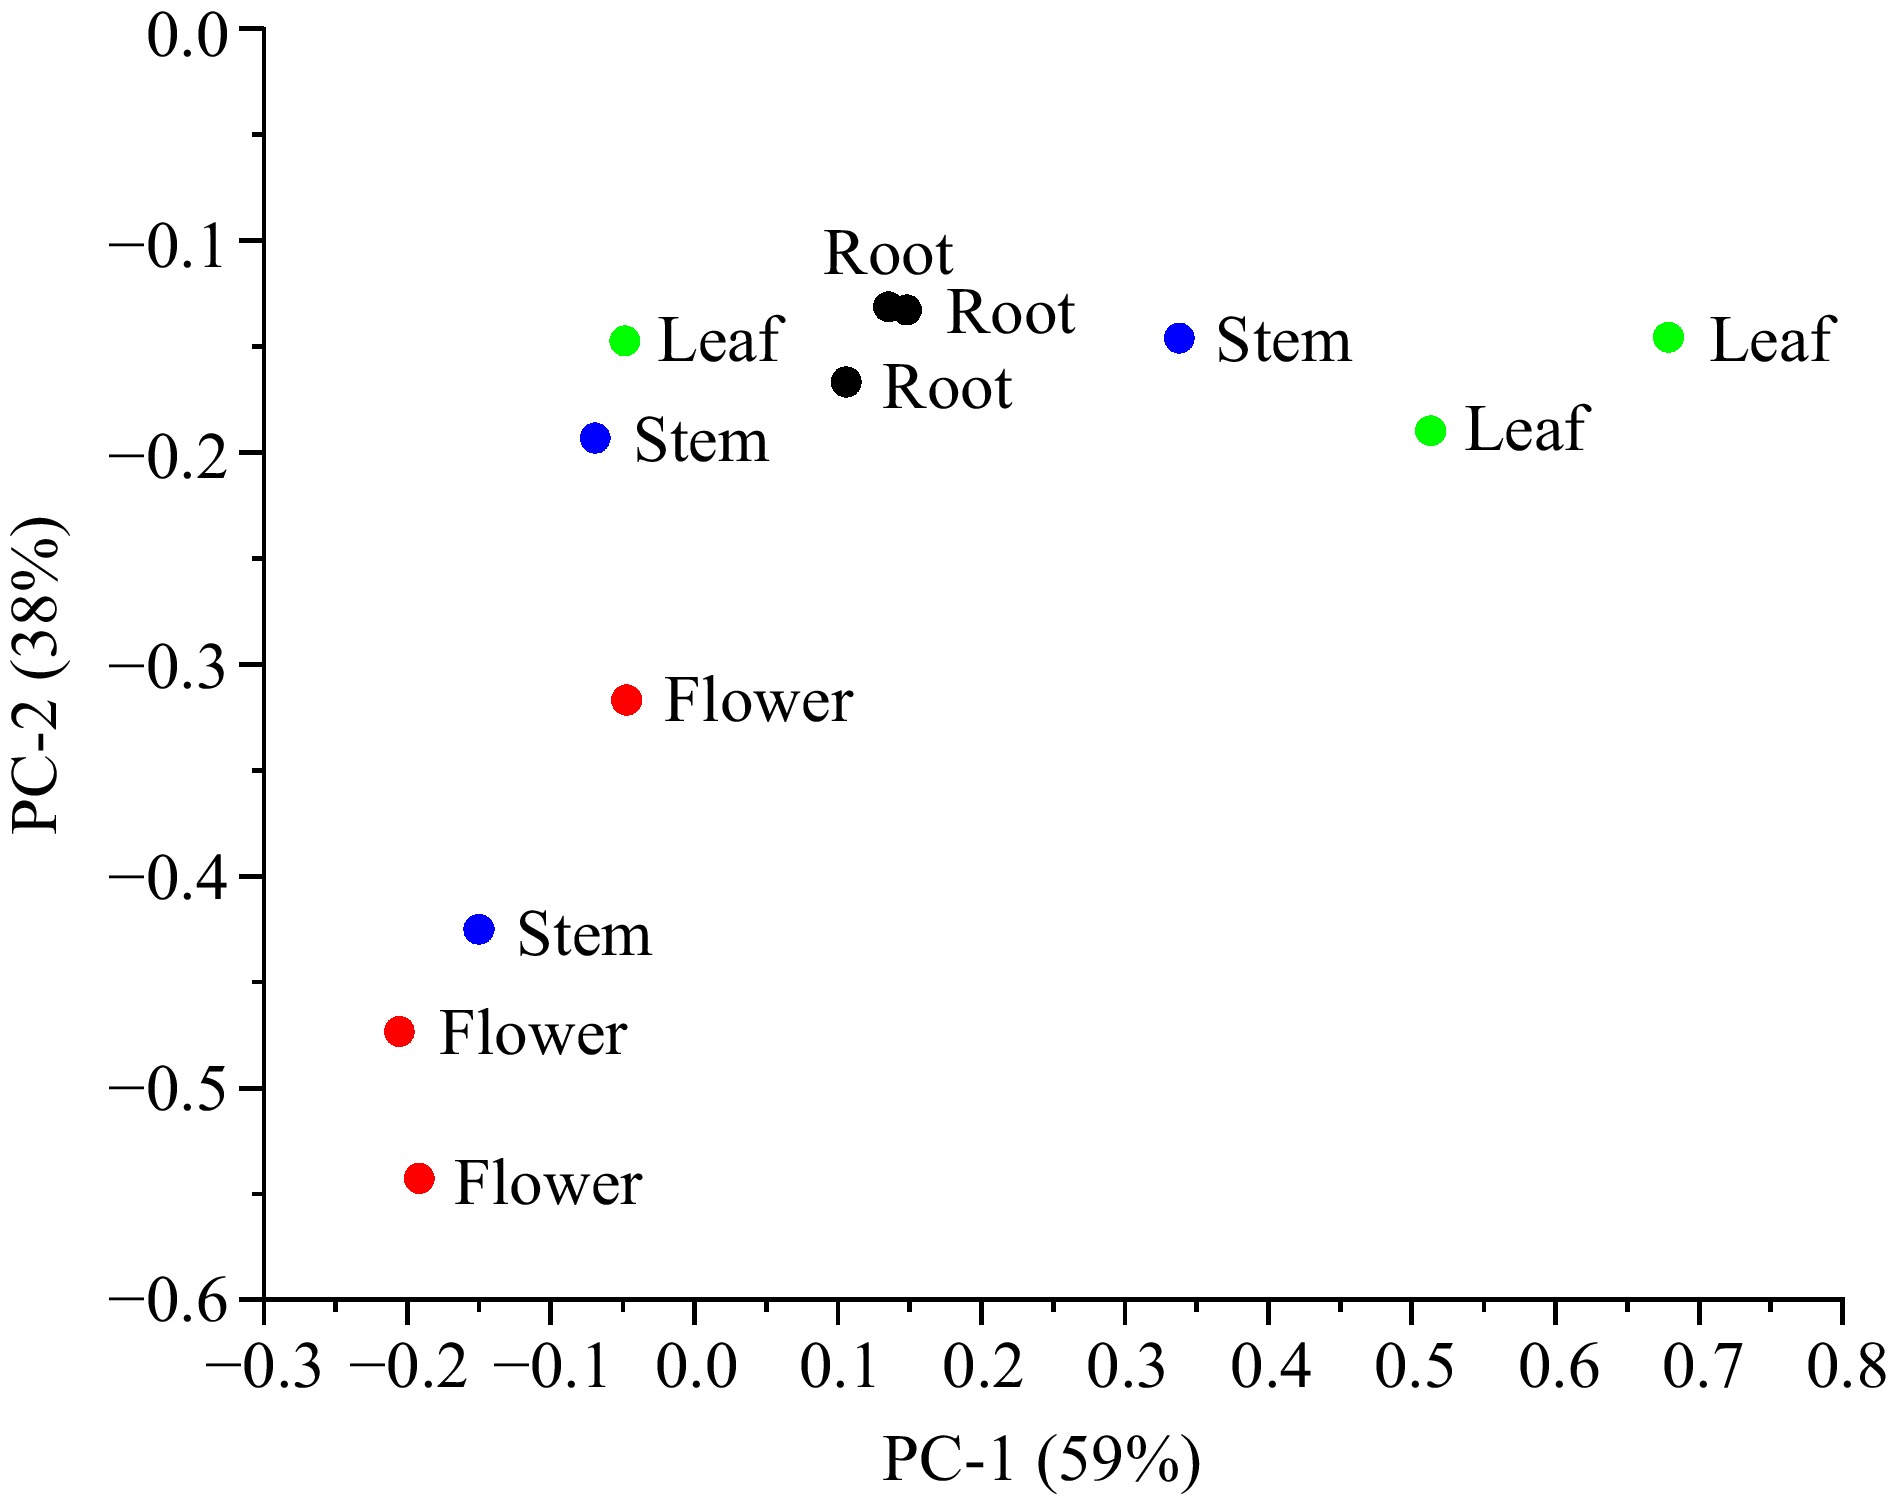
Figure 2.
Score cluster plot with top two principal components (PCs) for different dandelion tissues.
-

Figure 3.
Three-dimensional fluorescence spectra of dandelion tissue extracts. (a) Root, (b) flower, (c) stem, (d) leaf).
-
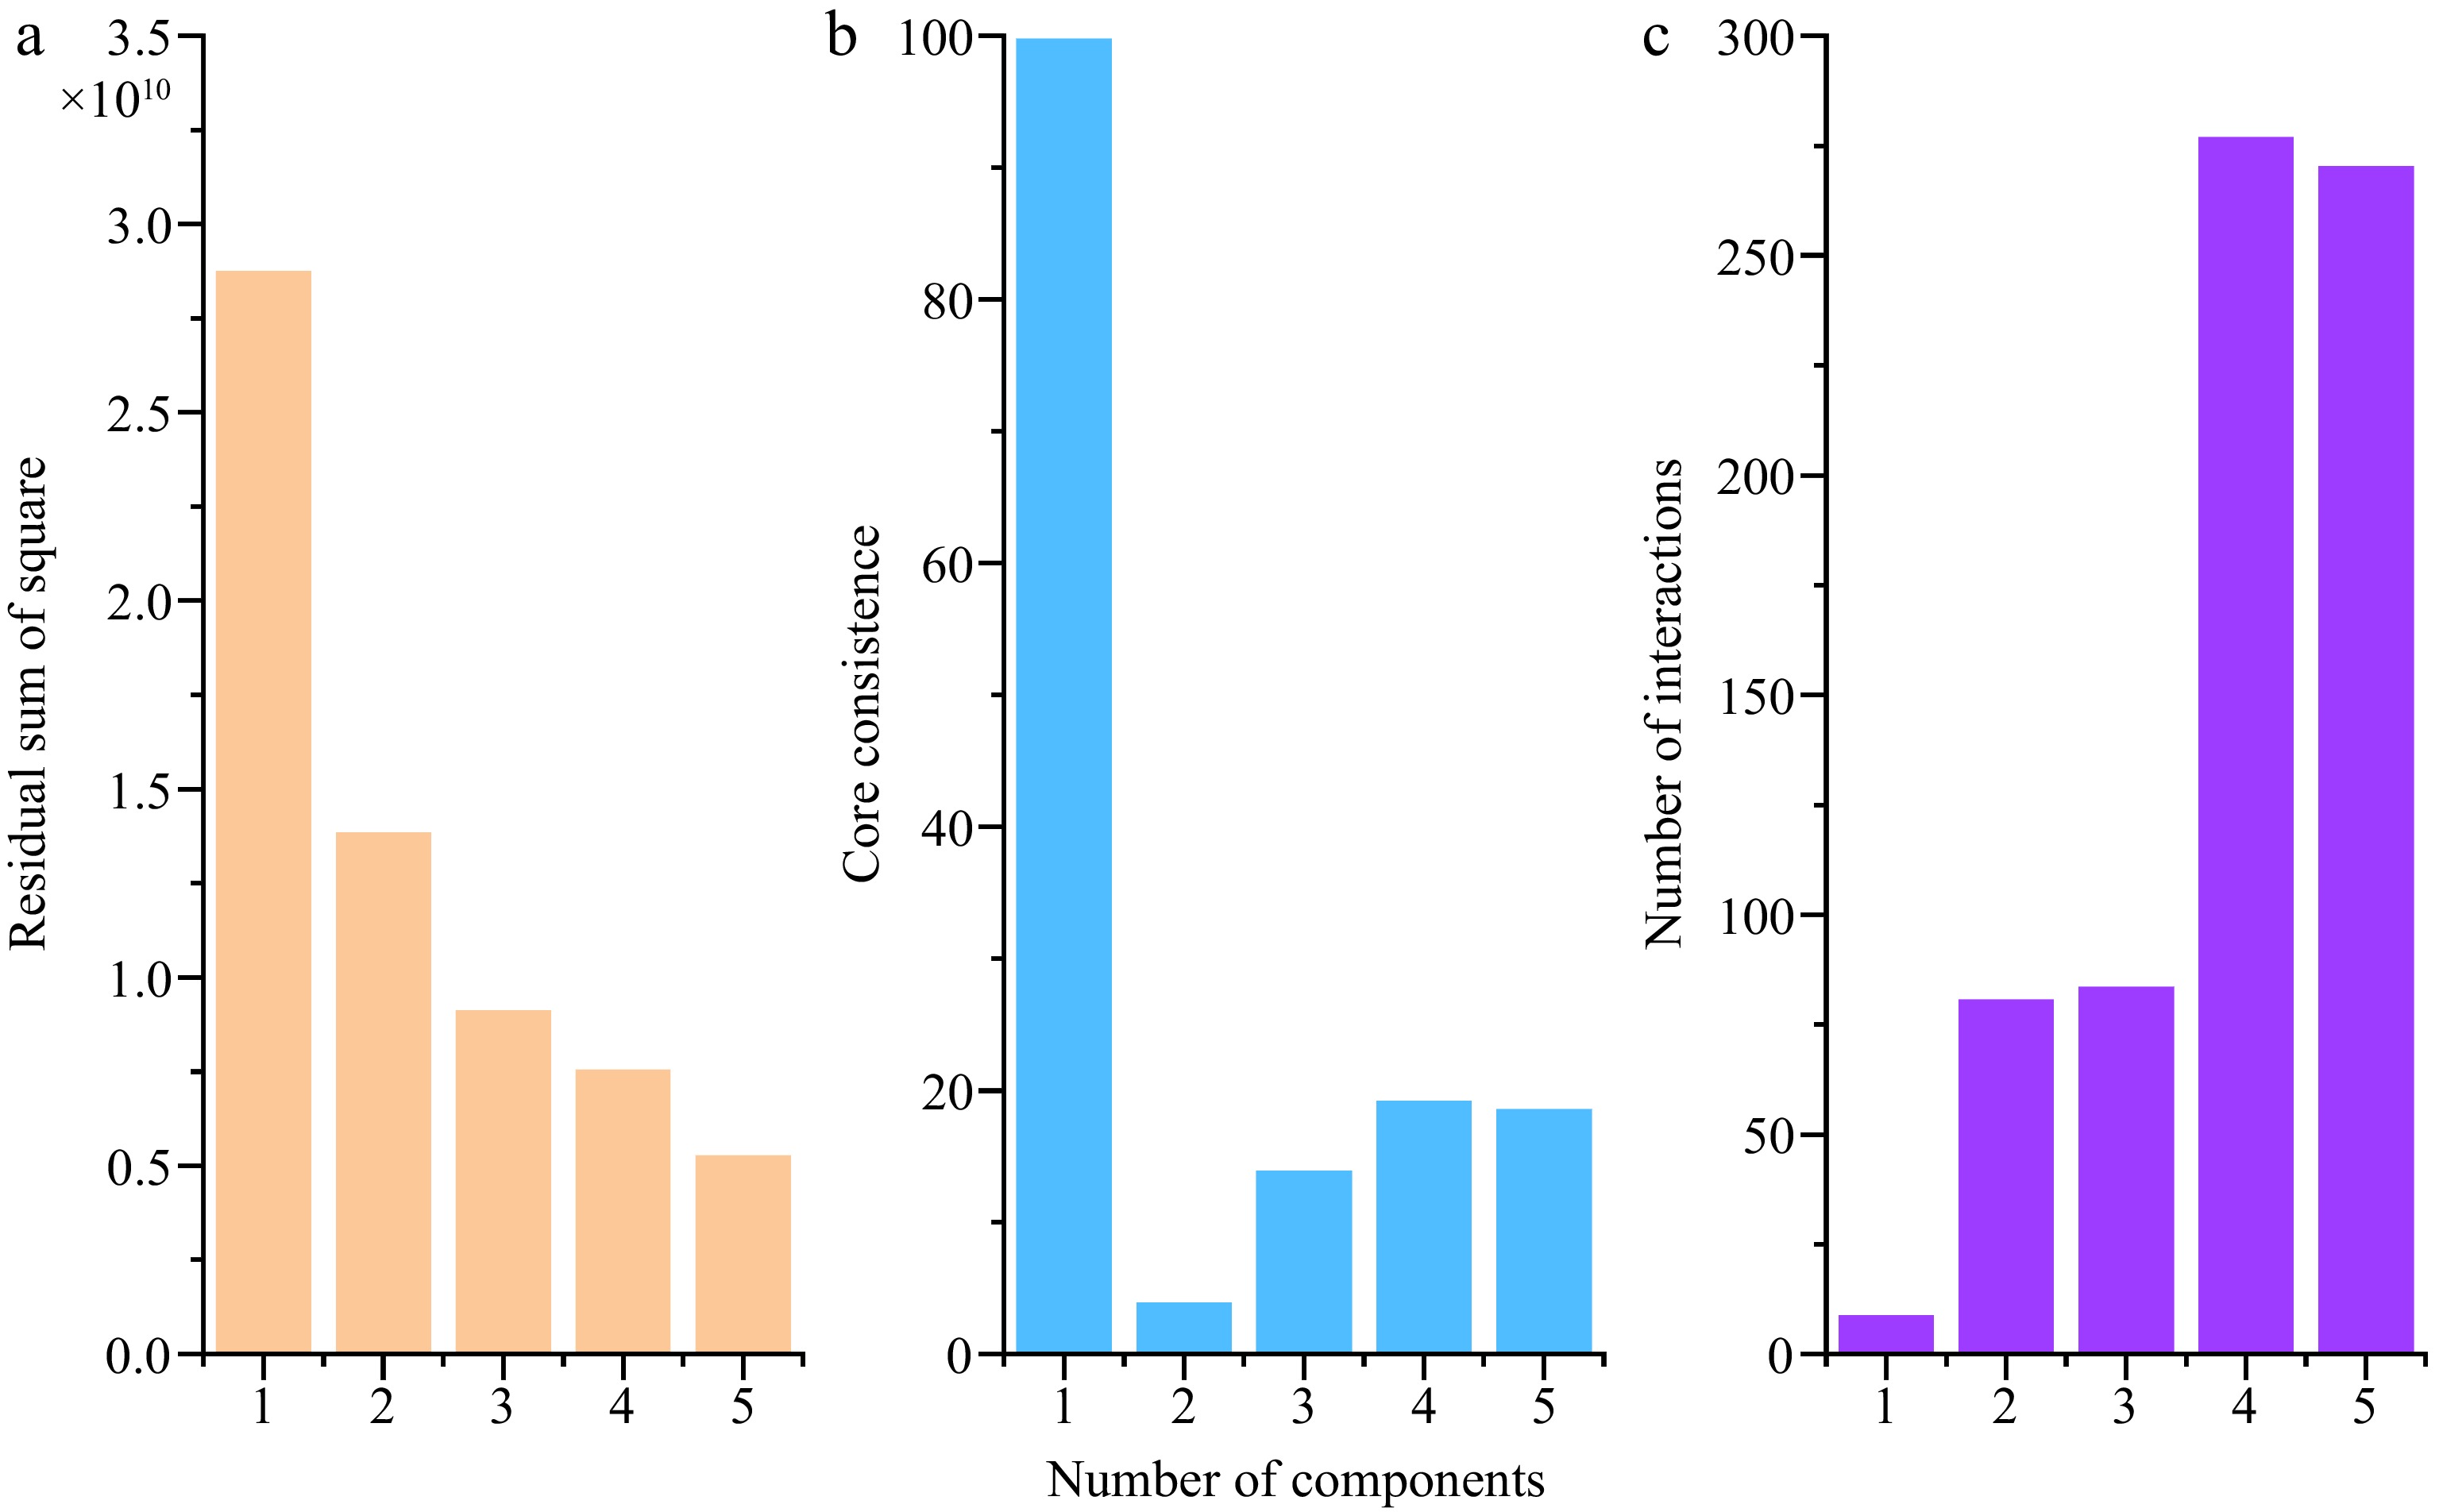
Figure 4.
Analysis diagram of the parallel factor model. (a) Square residual, (b) core consistence, (c) interaction number.
-
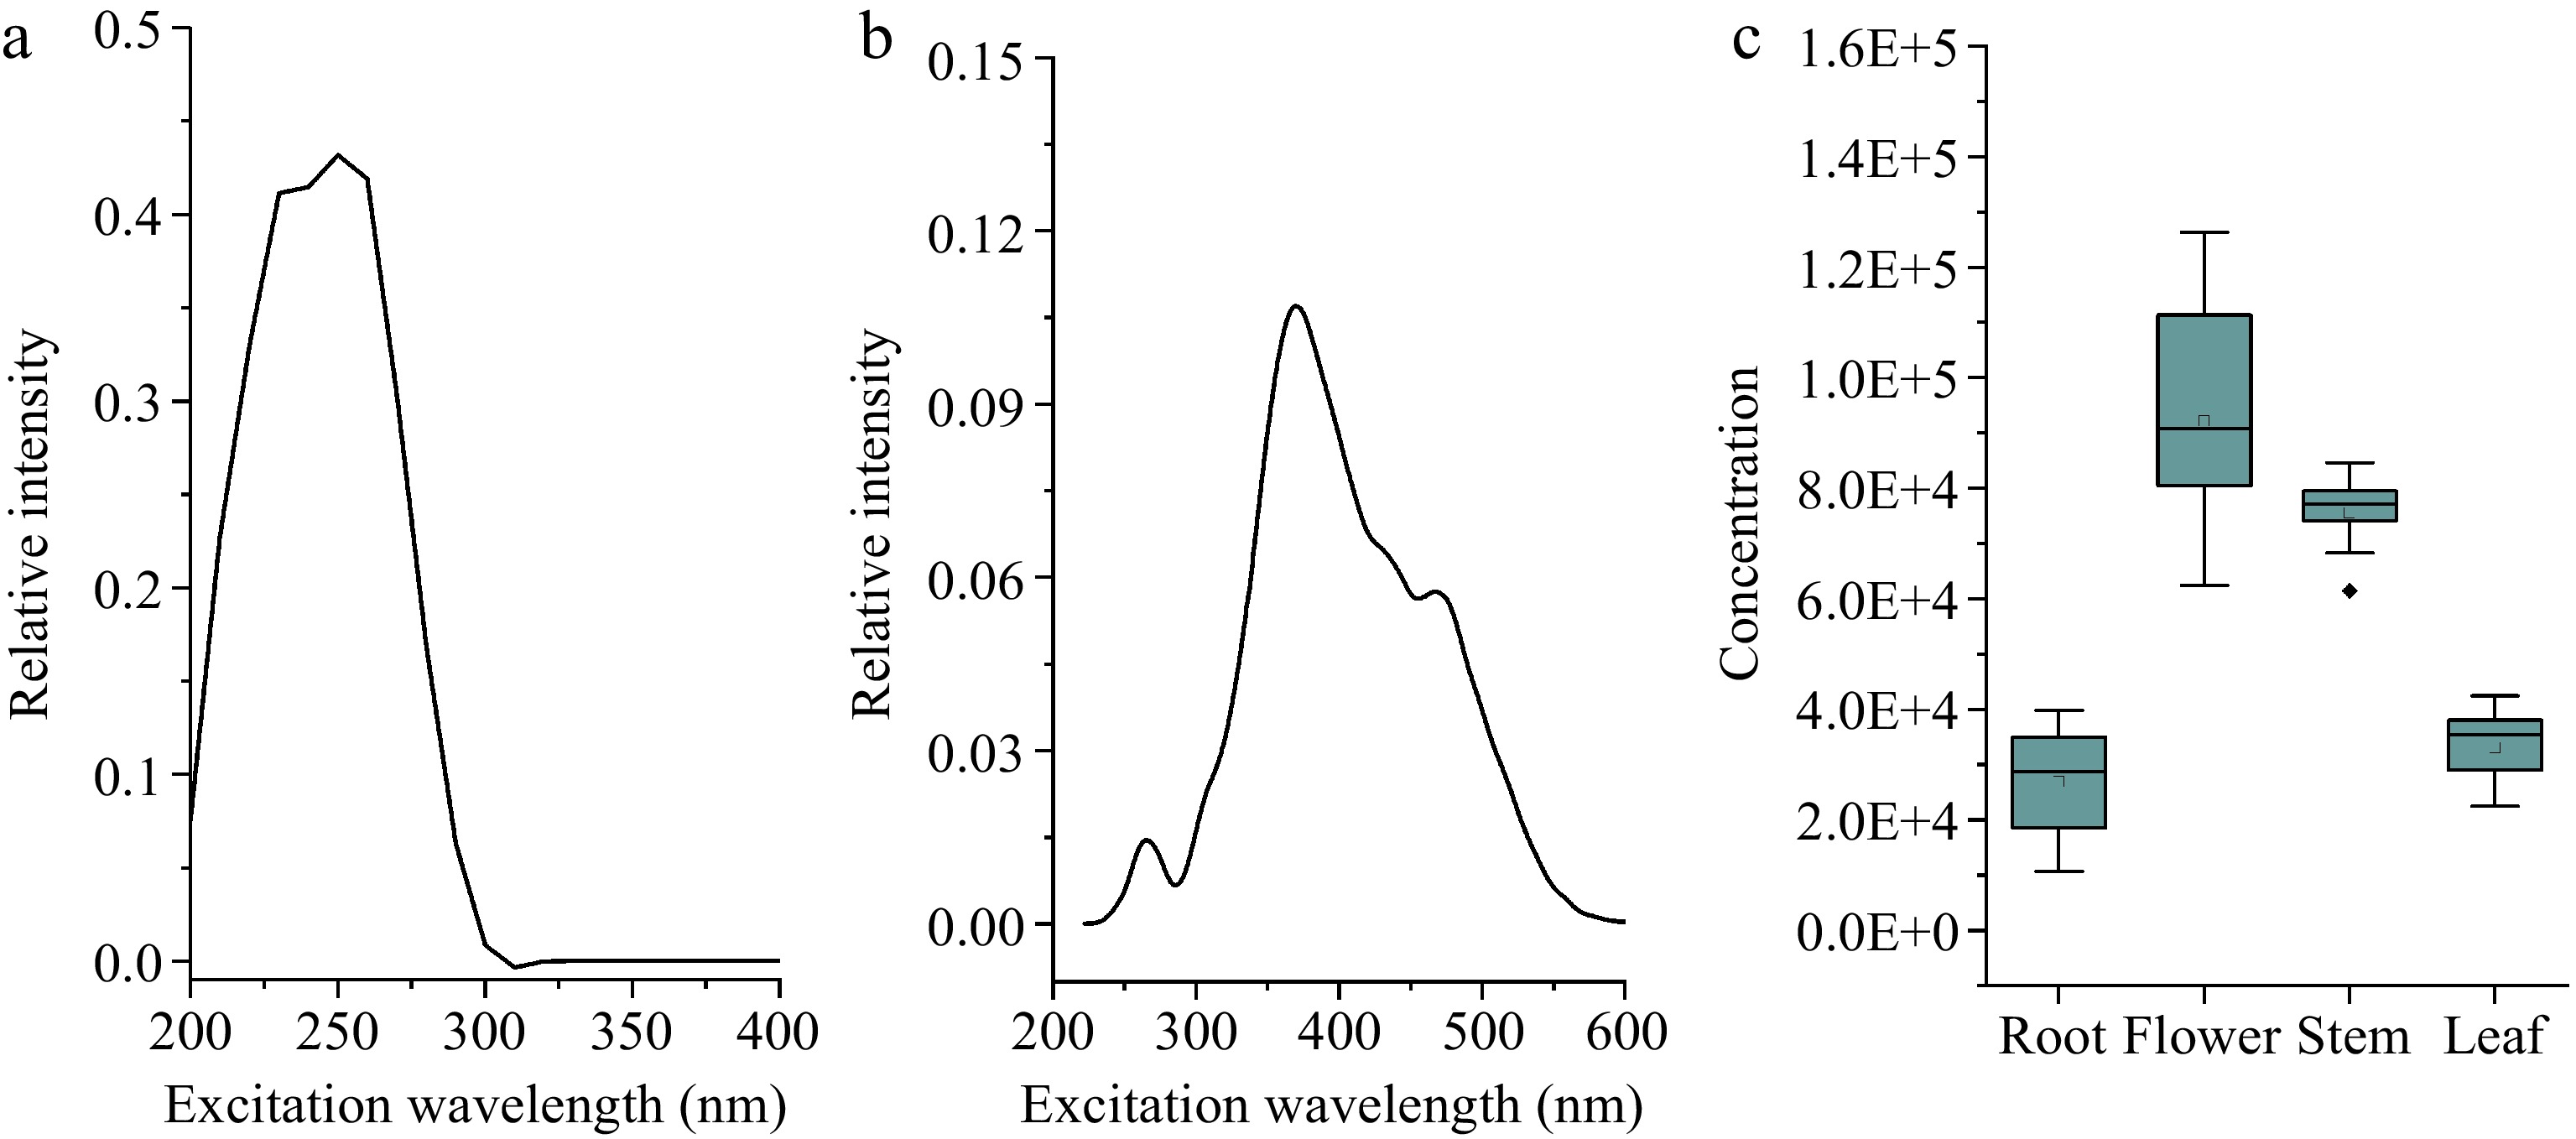
Figure 5.
Results of one component PARAFAC model of dandelion tissue extracts. (a) Excitation specta, (b) emission spectra, (c) relative concentration of dandelion tissue extract.
-
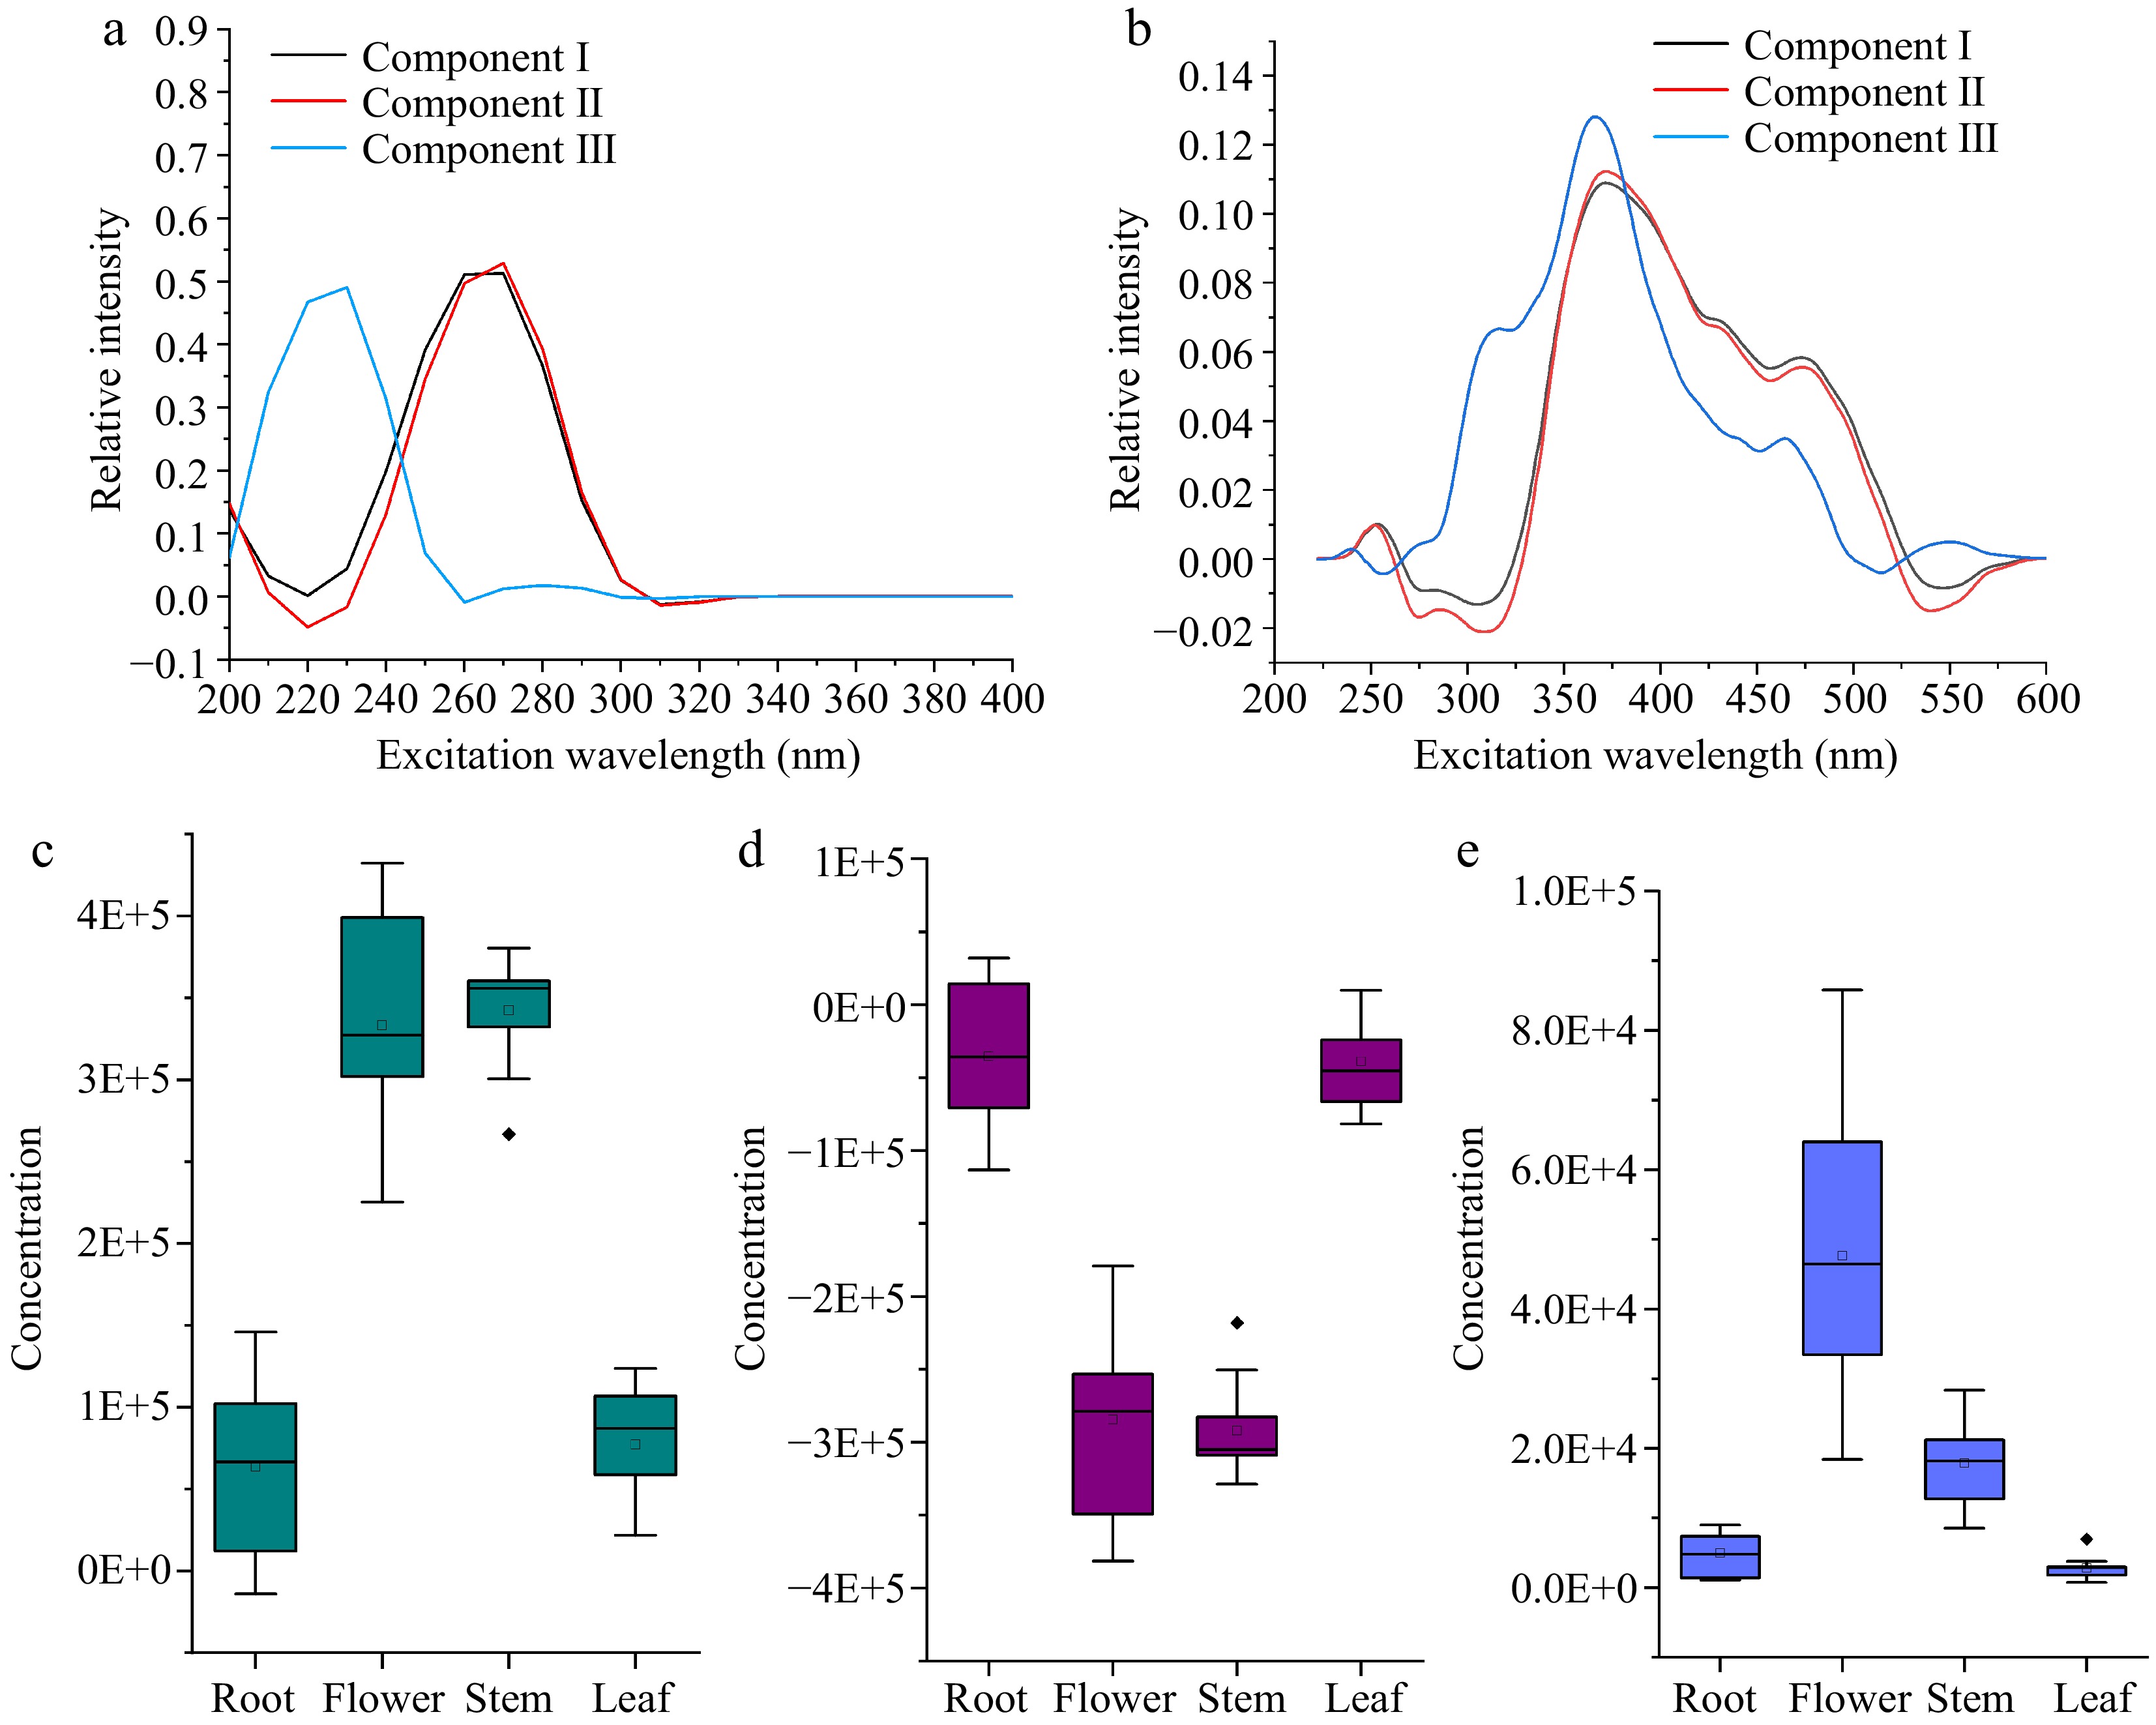
Figure 6.
Results of three component PARAFAC model of dandelion tissue extracts (a-b were (a) Excitation spectra, (b) emission spectra, (c) - (e) relative concentrations of dandelion tissue extracts in components I−III.
Figures
(6)
Tables
(0)